


Abstract
Response time inconsistency (RTI)—or trial-to-trial variability in speeded performance—is increasingly recognized as an indicator of transient lapses of attention, cognitive health status, and central nervous system integrity, as well as a potential early indicator of normal and pathological cognitive aging. Comparatively, little research has examined personality predictors of RTI across adulthood.
We evaluated the association between the personality trait neuroticism and RTI in a community-dwelling sample of 317 adults between the ages of 19–83 and tested for two indirect pathways through negative affect (NA) and cognitive interference (CI).
The personality trait neuroticism predicted greater RTI independent of mean response time performance and demographic covariates; the results were age-invariant. Furthermore, NA (but not CI) accounted for this association and moderated mediation model results indicated that older adults were more vulnerable to the adverse effects of NA.
Neuroticism predicts greater RTI irrespective of mean performance and this effect is driven largely by heightened negative emotionality that may be particularly detrimental for older adults.
In the field of cognitive aging, numerous studies have reported associations between performance inconsistency and lower cognitive function (Ram, Rabbitt, Stollery, & Nesselroade, 2005; West, Murphy, Armilio, Craik, & Stuss, 2002), cognitive decline (Bielak, Hultsch, Strauss, MacDonald, & Hunter, 2010a), and dementia risk (Holtzer, Verghese, Wang, Hall, & Lipton, 2008). Comparatively fewer studies have examined the potential psychological mechanisms underlying the association between performance inconsistency and cognitive function in aging adults. In the present investigation, we examine individual differences in the personality trait neuroticism as a predictor of trial-to-trial performance inconsistency in community dwelling adults (ages 19–83), and evaluate how negative affect (NA) and cognitive interference (CI) modulate age-related associations between personality and inconsistency.
Individual Differences in Response Time Inconsistency
Average response time (RT) from multitrial performance-based tasks is usually used to indicate function (i.e., processing speed). However, inconsistency in RTs across successive trials, or response time inconsistency (RTI), captures additional important dimensions of cognitive function (i.e., processing efficiency, processing robustness; Hultsch, Strauss, Hunter, & MacDonald, 2008). Indeed, prior work has identified RTI as “mental noise” that represents reduced efficiency in cognitive processing, lapses of attention, and dampened cognitive control (Robinson & Tamir, 2005; Robinson, Wilkowski, & Meier, 2006; West et al., 2002). RTI has been of interest in aging research as older adults tend to be more variable in their RTs (Bunce et al., 2013) and RTI has been implicated in normal and pathological cognitive aging (Bielak et al., 2014). RTI is related to lower ability levels in several cognitive domains including perceptual speed, working and episodic memory, and fluid ability (Grand, Stawski, & MacDonald, 2016; Ram et al., 2005; Salthouse & Berish, 2005; Yao, Stawski, Hultsch, & MacDonald, 2016). Given the consistent negative association between RTI and proximal and longitudinal cognitive health outcomes, it is pertinent to identify factors that contribute to greater RTI. In this study, we aimed to evaluate the association between individual differences in the personality trait neuroticism and RTI.
Neuroticism and RTI
Various markers of psychological distress have been associated with impaired cognitive performance, cognitive decline, and the likelihood of developing dementia among aging adults (Karlamangla, Singer, Chodosh, McEwen, & Seeman, 2005; Katz et al., 2016; McEwen & Sapolsky, 1995; Munoz, Sliwinski, Scott, & Hofer, 2015; Wilson et al., 2005). These results have been demonstrated with state measures of distress (e.g., depressive symptoms; McDermott & Ebmeier, 2009) as well as with trait-level or personality measures, with the most common one being trait neuroticism. Neuroticism is characterized by variability in emotional and cognitive processes (e.g., Carver, Sutton, & Scheier, 2000; Gross, Sutton, & Ketelaar, 1998). Individuals who score high in trait neuroticism tend to exhibit unstable coping behaviors that promote emotional distress such as anxiety (Suls & Martin, 2005) and they are less flexible in their cognitive processes making them more error-prone while completing cognitive tasks (Robinson et al., 2006). An early study by Robinson and Tamir (2005) showed that trait neuroticism was associated with greater mental noise (measured by RTI) among young adult college students, but this link has yet to be examined among older individuals who are community-dwelling or across domains of processing (e.g., verbal vs nonverbal processing). Importantly, it is unclear whether emotional and/or cognitive mechanisms associated with this personality trait underlie increased RTI.
Why Might Neuroticism be Associated With RTI?
Although studies have yet to examine mechanisms of the neuroticism-RTI association, theoretical and empirical evidence suggests that CI and NA are two possible mechanisms underlying this association. CI reflects the tendency to experience recurrent and intrusive thoughts that negatively affect cognitive processing by depleting or disrupting attentional resources and focus that may ultimately result in greater performance inconsistency (Eysenck & Calvo, 1992; Eysenck & Derakshan, 2011; Watkins, 2008). Higher neuroticism levels have been associated with greater CI (Flehmig, Steinborn, Langner, & Westhoff, 2007; Muris, Roelofs, Rassin, Franken, & Mayer, 2005; Nezlek, 2005). Further, CI explains the association between neuroticism, proneness to distress, and mean performance-based and self-report measures of cognition (Korten, Sliwinski, Comijs, & Smyth, 2014; Munoz, Sliwinski, Smyth, Almeida, & King, 2013; Stawski, Mogle, & Sliwinski, 2013).
NA is common among individuals who score higher in trait neuroticism (Suls & Martin, 2005) and NA is proposed to interfere with attentional resources resulting in compromised executive control (Ellis, Thomas, McFarland, & Walter, 1985; e.g., Figueira et al., 2017) and increased variability in cognitive performance (Brose, Schmiedek, Lövdén, & Lindenberger, 2012). Though CI and NA are interrelated (Nolen-Hoeksema, Wisco, & Lyubomirsky, 2008), it is important to determine the relative contribution of thoughts and emotional/affective processes linking neuroticism to RTI (Munoz et al., 2013; Nolen-Hoeksema et al., 2008). One study evaluated the competing hypotheses of whether NA or CI linked with neuroticism explain neuroticism’s link with poor cognitive function and found that cognitive intrusions explain this association above and beyond the effect of NA (Munoz et al., 2013). This previous study examined associations with average levels of memory and speeded cognitive performance, but to our knowledge, no studies have formally addressed this question as it pertains to RTI.
Nonverbal Versus Verbal Information Processing
Additionally, measures of processing speed vary in the type and amount of information to be processed, and such factors impact the strength of associations between theoretically relevant constructs and performance. Hale and Myerson (1996) differentiate between “lexical” and “nonlexical” tasks in which verbal processing is required for the former and nonverbal processing is required for the latter. They found that older adults (69.7 years old on average) were differentially slower when processing nonverbal compared to verbal information, suggesting that nonverbal tasks may be more reliant on executive and attentional resources, which may be reduced among older adults (Hasher, Zacks, & May, 1999). Similarly, performance in nonverbal tasks may be compromised to a greater extent among those who score high in trait neuroticism as their attentional resources may be usurped by irrelevant thoughts related to worry and anxiety, or negative emotions (e.g., Eysenck, Derakshan, Santos, & Calvo, 2007). Furthermore, Bielak and colleagues found that RTI in attention-demanding tasks predicted poorer longitudinal cognitive outcomes compared to less attention-demanding tasks (Bielak, Hultsch, Strauss, MacDonald, & Hunter, 2010b). Thus, we also aimed to determine sensitivity of neuroticism and mediators in predicting performance across RTI for verbal and nonverbal domains of processing.
Age Differences in Neuroticism, RTI, and Mediating Mechanisms
Trait neuroticism tends to be negatively associated with age and to decrease with age longitudinally (Allemand, Zimprich, & Hertzog, 2007; Mroczek & Spiro, 2003). These changes may be due to selection or survival effects (Luo & Huang, 2016; Mroczek & Spiro, 2007) as well as improved emotion regulation associated with aging (e.g., Carstensen, Isaacowitz, & Charles, 1999). Though findings in the literature are mixed, some studies show that those older individuals who score high in the personality trait neuroticism tend to exhibit lower initial (e.g., Meier, Perrig-Chiello, & Perrig, 2002) and steeper decline in cognitive performance compared to their counterparts (Caselli et al., 2016; Wilson, Begeny, Boyle, Schneider, & Bennett, 2011). Nonetheless, some studies report small or unreliable associations between neuroticism and cognition across age (e.g., Soubelet & Salthouse, 2011). Part of the reason why findings are mixed is because neuroticism does not predict all types of cognitive function, as it seems to be more reliably related to fluid abilities (Curtis, Windsor, & Soubelet, 2015; Graham & Lachman, 2014). Indeed, RTI is representative of reduced cognitive processes related to fluid-like abilities requiring attentional focus and control.
To our knowledge, studies have yet to examine whether associations between neuroticism and RTI differ across age. Given previous evidence showing that older individuals with higher neuroticism levels tend to be more vulnerable in terms of average cognitive health status and decline, they may also be more vulnerable to increased RTI. Further, higher neuroticism scores are associated with increased negative affectivity among older adults (Ready, Åkerstedt, & Mroczek, 2012). Older age and neuroticism are also associated with a greater tendency to experience CI (Roelofs, Huibers, Peeters, & Arntz, 2008; Stawski, Sliwinski, & Smyth, 2006). Thus, older individuals may be more vulnerable to the detrimental effects of trait neuroticism as well as the potential adverse effects of NA and CI.
Current Study
We evaluated the unique association between neuroticism and RTI while accounting for mean performance among community-dwelling individuals from young to older age (19–83 years of age). We hypothesized that neuroticism would be positively associated with RTI (Hypothesis 1). Based on reviewed evidence that older age is associated with greater RTI (e.g., West et al., 2002) and that trait neuroticism may be associated with cognitive aging (Munoz et al., 2013; Wilson et al., 2005), we expected age to moderate the neuroticism-RTI association such that this association would be stronger at older ages (Hypothesis 1a).
We also tested whether CI and NA are mechanisms underlying the association between neuroticism and RTI. We predicted that both CI and NA would be positively associated with trait neuroticism and that both CI and NA would predict greater RTI (Figure 1 provides a visual representation of this conceptual focus). Given previous evidence demonstrating the explanatory role of CI on neuroticism and cognitive performance, we predicted that CI would explain the association between neuroticism and RTI while accounting for the indirect effect through NA (Hypothesis 2). We also tested the robustness of associations to the type of information processing and predicted that results would be more pronounced for the nonlexical compared to the lexical tasks (Hypothesis 3). Lastly, we tested for possible age differences in the link between our mediators of interest and RTI and expected that older individuals with greater levels of NA or CI would show increased RTI (Hypothesis 4).
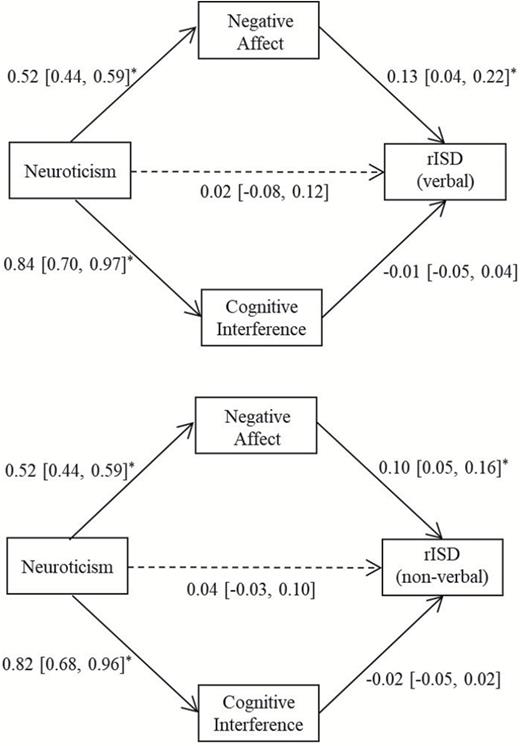
Path coefficients and direct effect of verbal rISD and nonverbal rISD. Values in brackets show 95% confidence interval; asterisks indicate that the interval does not include zero. rISD = Residualized intraindividual standard deviation.
Method
Participants
This is a secondary data analysis based on data from a study aimed at examining the associations between stress and working memory across age. Three hundred and seventeen community-dwelling adults were recruited using advertisements in local newspapers, flyers in community centers, and other public venues. Participants were told that they were participating in a study examining the relations among health, cognition, and personality throughout the life span. Participants were introduced to the study and informed consent was obtained as approved by the Syracuse University Institutional Review Board and were compensated commensurate with their participation. Recruitment was stratified by age to obtain a uniform age distribution. Average age of the current sample was 49.44 (SD = 17.23, range = 19–83), and 49.69% (n = 161) were female. The average years of education were 13 years (SD = 2.71); 52.1% of participants self-identified as white, 37.6% as black, 1.5% as Hispanic, and 8.7% as other.
Materials
Participants completed 60 trials for each choice reaction time (CRT) task involving nonverbal and verbal processing speed tasks.
Nonverbal Processing Speed Tasks
For the orientation task, participants indicated whether an arrow presented on the screen was pointing left or right (LR). For the location task, participants indicated whether an arrow presented on the screen was above or below (AB) the midpoint of the screen.
Verbal Processing Speed Tasks
For the size task, participants classified an object represented by a given word as either bigger or smaller (BS) than a basketball (Mayr & Kliegl, 2000). For the existence task, participants classified a given word as either living or nonliving (LN; Goffaux, Phillips, Sinai, & Pushkar, 2006). Words for these conditions were selected from the Toronto Word Pool (Friendly, Franklin, Hoffman, & Rubin, 1982) and they did not differ in their imagery, concreteness, frequency, or length (all ps > .50).
RTI
Our index for RTI consisted of a residualized intraindividual standard deviation (rISD) score. Additional computation of two indices of RTI consisted of the raw intraindividual standard deviation (ISD), and the coefficient of variation. Results were replicated across these two indices and are available from the first author upon request. We focus on the rISD quantification because it controls for systematic time or practice effects, and this is the marker used in a previous study examining the association between neuroticism and RTI in young participants (Robinson & Tamir, 2005; Stawski et al., 2017). We first removed anticipatory and delayed responses from the raw RT data by excluding RTs that were faster than 150 ms or slower than 3 SD above the average RTs (Ratcliff, 1993). We then computed a raw intraindividual mean score for each person and task. To create a rISD, we regressed RT onto trial number to account for practice-related improvements across trials and retained the residual values (MacDonald, Hultsch, & Dixon, 2008). We subsequently computed an ISD for the residualized values for each person resulting in a rISD score.
As expected, performance on each of the nonverbal (AB and LR) and verbal (BS and LN) tasks was more strongly correlated within than across domain (see Supplementary Material). As such, we created composite rISD and mean RT scores by calculating a T-score with a mean of 50 and standard deviation of 10 for each of the tasks and averaging across both the tasks related to nonverbal and verbal processing (i.e., we averaged across the AB and LR scores for the nonverbal tasks, and BS and LN scores for the verbal tasks). The RTI (i.e., rISD) composite scores were used as our outcome variables and the mean RT scores where used as covariates.
Neuroticism
Participants rated whether 10 statements accurately described how they perceived themselves in general on a scale of 1 (very inaccurate) to 5 (very accurate). Items were taken from the International Personality Item Pool (Goldberg et al., 2006) and included statements such as “am not easily bothered by things”. A composite score was calculated where higher scores indicated greater neuroticism (α = .82).
CI
We assessed the tendency to experience CI through the White Bear Suppression Inventory (WBSI; Wegner & Zanakos, 2006). This scale consisted of 15 items designed to assess the general experience of intrusive thoughts and what the individual does to control these thoughts (e.g., “I wish I could stop thinking about certain things” and “I often do things to distract myself from my thoughts”). Responses were made on a 5-point scale from strongly disagree to strongly agree and higher scores indicated a greater tendency to experience CI (α = 93). Although this measure incorporates items related to behaviors undertaken to suppress unwanted or off-task thoughts, previous evidence reports that the WBSI reliably predicts greater frequency of unwanted intrusive thoughts (Muris, Merckelbach, & Horselenberg, 1996).
NA
In the Positive and Negative Affect Schedule-Expanded Form (Watson & Clark, 1994), participants indicated the extent to which a series of adjectives described how they felt in general. Ratings were made from not at all (1) to extremely (5). Only NA items were used: irritable, afraid, upset, guilty, nervous, hostile, jittery, ashamed, scared, and distressed. One total score was obtained from these items with higher scores indicating greater NA (α = .89).
Procedure
Cognitive tasks were administered in a fixed order over two in-lab sessions approximately 1 week apart. The average number of days between sessions was 7.75 (2.52), range: 3–23. The following processing speed tasks were administered in the first session: existence and size CRT tasks. The rest of the tasks were administered during the second session in the following order: orientation CRT, and location CRT. All CRT tasks were administered via similar computer desktops using e-prime software to ensure accuracy of millisecond response timing. Assessments of fluid intelligence, episodic memory, and primary and working memory as well as a number of health measures were collected in this protocol but are not used in the current analysis. Between the lab sessions, participants completed questionnaires assessing personality, CI, affect, and demographic and background information.
Analytic Strategy
To test our first hypotheses, we fit multiple linear regression models with nonverbal or verbal rISD regressed onto neuroticism, covarying for average RT, and demographic variables: age, sex, years of education, and race and ethnicity. To test for moderation by age (Hypothesis 1a), we included an interaction term of neuroticism by age. Figure 1 provides an illustration of the path analytic model specified to test for multiple mediation proposed in our second hypothesis whereby NA and CI have an indirect effect from neuroticism to rISD. To test for age differences in the link between the mediators and RTI, we included a main effect of age and an interaction term of age by mediator (i.e., CI or NA; Edwards & Lambert, 2007), in a structural equation framework. Descriptive statistics and multiple regression analyses were conducted using SAS 9.4 (SAS Institute, 2013) and path analytic models were estimated using Mplus v.7 (Muthén & Muthén, 1998).
Results
Participants scored an average of 25.83 (SD = 7.79; range: 11, 50) on the trait neuroticism scale, 46.44 (SD = 12.95; range: 15, 74) on the CI scale and 17.28 (SD = 6.87, range: 10, 47.78) on the trait NA scale. Table 1 shows the zero-order correlations among the composite RTI variables and variables of interest. Neuroticism was unrelated to average RT scores but positively associated with inconsistency in the verbal task (r = .17, p = .003) and unrelated to nonverbal residualized ISD. CI was positively associated with neuroticism (r = .55, p <.001) as well as with the RTI scores (rs = .13 and .25, p = .022 and <.001). NA was also positively associated with neuroticism (r = .61, p <.001), it was positively associated with verbal rISD (r = .21, p <.001), but unrelated to nonverbal rISD.
Intercorrelations Among Composite RTI Variables, Neuroticism, NA, CI, and demographics
| 1 | 2 | 3 | 4 | 5 | 6 | 7 | 8 | 9 | 10 | 11 | |
|---|---|---|---|---|---|---|---|---|---|---|---|
| 1. Neuroticism | - | ||||||||||
| 2. rISD (nonverbal) | 0.05 | - | |||||||||
| 3. rISD (verbal) | 0.17* | 0.38* | - | ||||||||
| 4. Mean (nonverbal) | −0.03 | 0.91* | 0.32* | - | |||||||
| 5. Mean (verbal) | 0.08 | 0.46* | 0.80* | 0.51* | - | ||||||
| 6. CI | 0.55* | 0.13* | 0.25* | 0.10 | 0.21* | - | |||||
| 7. NA | 0.61* | 0.07 | 0.21* | −0.04 | 0.09 | 0.46* | - | ||||
| 8. Age | −0.22* | 0.38* | −0.10 | 0.48* | 0.10 | −0.20* | −0.21* | - | |||
| 9. Sex (0 = male) | 0.00 | 0.08 | −0.04 | 0.12* | 0.01 | 0.08 | −0.07 | 0.03 | - | ||
| 10. Years of education | −0.20* | −0.11 | −0.32 | −0.10 | −0.29 | −0.31* | −0.18* | 0.13* | 0.02 | - | |
| 11. Race/ethnicity | 0.04 | −0.09 | 0.22* | −0.11 | 0.11 | 0.16* | 0.03 | −0.38* | −0.09 | −0.12* | - |
Note: An asterisk indicates that the 95% confidence interval for the correlation coefficient does not include zero.
CI = Cognitive interference; NA = Negative affect; rISD = Residualized intraindividual standard deviation.
Neuroticism Predicts RTI
Table 2 presents the results from our regression analyses and shows that trait neuroticism predicts greater RTI while accounting for the covariates of interest. Note that regression estimates are presented in milliseconds, which yields small estimated coefficients (e.g., estimate for the nonverbal rISD is 0.08, 95% CI [0.03, 0.14]). Moreover, the results demonstrate that although mean RT is a strong predictor of RTI (i.e., slower RT predicts greater RTI), neuroticism independently predicts RTI. These regression results counter our third hypothesis, as RTI estimates for the lexical and nonlexical tasks were comparable. We also fit models predicting mean RT and found a dissociation between neuroticism and mean speed of processing, as neuroticism did not predict average RTs for either verbal and nonverbal tasks.
Multiple Regression Estimates Predicting RTI (95% confidence intervals)
| rISD (verbal) | rISD (nonverbal) | Mean (verbal) | Mean (nonverbal) | |
|---|---|---|---|---|
| Estimate (CI) | Estimate (CI) | Estimate (CI) | Estimate (CI) | |
| Intercept | 49.35 (48.07, 50.63)* | 50.41 (49.44, 51.38)* | 47.27 (45.11, 49.43)* | 47.99 (45.93, 50.05)* |
| Neuroticism | 0.08 (0.01, 0.16)* | 0.08 (0.03, 0.14)* | 0.07 (−0.06, 0.20) | 0.05 (−0.07, 0.18) |
| Mean RT | 7.89 (7.22, 8.56)* | 8.77 (8.23, 9.31)* | - | - |
| Age | −0.07 (−0.10, −0.03)* | −0.03 (−0.06, 0.00) | 0.10 (0.04, 0.17)* | 0.29 (0.23, 0.35)* |
| Years of Education | −0.13 (−0.35, 0.09) | 0.02 (−0.14, 0.18) | −0.94 (−1.31, −0.58)* | −0.53 (−0.88, −0.18)* |
| Race/Ethnicity | 0.71 (0.16, 1.25)* | −0.10 (−0.50, 0.31) | 1.20 (0.28, 2.12)* | 0.61 (−0.26, 1.48) |
| Sex (0 = male) | −0.85 (−1.97, 0.27) | −0.52 (−1.38, 0.34) | 0.37 (−1.55, 2.28)* | 1.98 (0.15, 3.81)* |
Note: An asterisk indicates that the 95% confidence interval for the regression slope does not include zero.
CI = Cognitive interference; NA = Negative affect; rISD = Residualized intraindividual standard deviation; RT = Response time.
Age Differences in the Effects of Neuroticism on RTI
Our analysis of age-moderation, to evaluate whether the examined associations between neuroticism and RTI were stronger among older compared to younger adults, showed that these associations were age invariant as the moderated associations were not statistically significant (all ps > .38). Nonetheless, the main effect of age on RTI for the verbal RTI tasks was negative (B = −0.07, 95% CI [−0.10, −0.03]) and the effect of age for the nonverbal RTI task was also negative though not statistically significant (B = −0.03, 95% CI [−0.06, 0.00]).
CI and NA as Indirect Pathways
We tested for multiple indirect pathways using bootstrap methodology, to evaluate the significance of the indirect effects (Preacher & Hayes, 2008). We fit a model analogous to that presented in Figure 1, while accounting for demographic covariates presented in Table 2, including age. The total effects for verbal and nonverbal RTI were significant (Bverbal = 0.08, 95% CI [0.01, 0.15]; Bnonverbal = 0.08, 95% CI [0.03, 0.13]). Path coefficients for verbal and nonverbal RTI are presented in Figure 1. All individual paths through NA were significant as were the paths from neuroticism to CI, but the path from CI to the RTI indicators were not. For both verbal and nonverbal RTI, the indirect effects through NA (Bverbal = 0.07, 95% CI [0.02, 0.12]; Bnonverbal = 0.05, 95% CI [0.03, 0.09]) were statistically significant whereas the indirect effects through CI were not (Bverbal = −0.01, 95% CI [−0.04, 0.03]; Bnonverbal = −0.01, 95% CI [−0.04, 0.01]). Further, the direct effect from neuroticism to the RTI indicators was no longer significant after CI and NA were included in the analysis (see path coefficients for dashed lines on Figure 1). Although CI was correlated with both neuroticism and the RTI indicators, it did not significantly account for any variance when NA was also included as an indirect pathway. NA accounted for 88% and 63% of the total effect of neuroticism for the verbal and nonverbal RTI, respectively. Indirect effects of neuroticism through CI in univariate mediation models were not statistically significant; indirect effects through NA were statistically significant for all univariate mediation models.
Age Differences in Indirect Effect Through NA
Our hypothesis on age moderation of the mediator on RTI was only tested for NA since it showed reliable mediation in the prior models. We tested an interaction of NA by age to determine whether or not the effect of NA on RTI varied by age (Edwards & Lambert, 2007). We found a reliable effect of the NA by age term on RTI (B = 0.12, 95% CI [0.04, 0.20]) indicating that older individuals who report higher levels of NA tended to be more inconsistent in their RTs. Figure 2 provides a graphical representation of estimated scores for the average age (~49 years), 1 SD above the sample mean age (~66 years), and one below (~32 years). It is apparent in this figure that the effect of NA is stronger for those in the older age group compared to the younger group. As a follow-up, we evaluated whether the indirect effect through NA was moderated by age and found that the moderated mediation effect was statistically significant (B = 0.12, 95% CI [0.06, 0.21]). We evaluated this effect for specific age groups (i.e., 1 SD below average age, average age, 1 SD above average) and found the effect was not significant for the young group (B = 0.60, 95% CI [−0.04, 0.15]), but was significant for those in the average age group (B = 0.12, 95% CI [0.06, 0.21]), and the older age group (B = 0.16, 95% CI [0.09, 0.24]) thus corroborating the age moderation effect presented in Figure 2. Finally, because cognitive assessments were split across two in-lab sessions, we fit all the models presented above with number of days between assessments as a covariate. Results from this sensitivity analysis showed that the pattern, strength, and significance of results did not change when including this covariate.
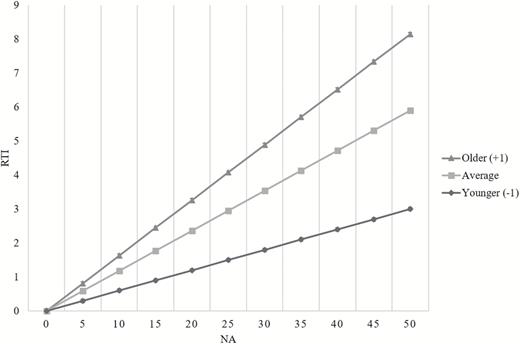
Estimated RTI scores for average age and +1 (older) and −1 (younger) standard deviation from the average age. RTI = Response time inconsistency.
Discussion
We found a positive association between the personality trait neuroticism and RTI in processing speed tasks independent of mean RT. We focused on evaluating neuroticism, NA, and CI as predictors of RTI because RTI has been consistently shown to predict reduced cognitive function, and normal and pathological cognitive changes in aging individuals. We found that neuroticism was significantly associated with both verbal and nonverbal RTI, and that this association did not vary with age. Tests for multiple indirect effects indicated that NA, but not CI, accounted for the association between trait neuroticism and RTI and that older adults who experience greater NA tend to be more variable in their RTs.
Neuroticism and RTI
We found a dissociation between the personality trait neuroticism with mean performance and RTI. Neuroticism was not associated with slower average RTs, but was associated with greater RTI while accounting for mean RT. This result is consistent with previous evidence (Robinson & Tamir, 2005) and extends findings to age-heterogeneous community dwelling adults. Previous research showed no association between neuroticism and mean RT in adulthood (Munoz et al., 2013), and the current finding provides robust evidence of the unique association between neuroticism and RTI. Furthermore, the dissociative pattern of relationships between neuroticism with mean RT and RTI is consistent with theoretical accounts contending the importance of considering performance variability and not just average performance (Jensen, 1992). Thus, rather than reduced average speed of processing capacity, personality trait neuroticism promotes interruptions of attentional processes resulting in greater variability in processing speed. RTI may be representative of a process akin to fluid abilities as lower levels of RTI would require control of attentional resources, and thus less mental noise (Robinson & Tamir, 2005), needed to efficiently process the tasks at hand. This result is thus consistent with some prior work suggesting that neuroticism may be more predictive of fluid abilities (e.g., Curtis et al., 2015).
Previous evidence reporting a negative association between neuroticism and cognitive function has focused primarily on global measures of cognition (e.g., Duchek, 2007; Wilson et al., 2003) that did not allow for explicit hypotheses of the process underlying the neuroticism–cognition association. Our results indicate that trial-to-trial variability in speed of processing, possibly representative of lapses of attention (e.g., West et al., 2002) or central nervous system integrity (Anstey et al., 2007; MacDonald, Li, & Bäckman, 2009), may be a viable pathway explaining these previously reported associations (Stawski et al., 2017). Indeed, trait neuroticism may be associated with a tendency to experience attentional lapses or “mental inconsistency” that may undermine efficient processing of information.
Although we predicted that trait neuroticism would be differentially associated with RTI of nonverbal versus verbal tasks, neuroticism predicted greater RTI in both domains of processing. This suggests that neuroticism may influence RTI in choice RT tasks more generally, regardless of the type of information needed to be processed, and associated attentional demands. Because previous evidence showed that older adults perform more poorly on nonverbal tasks (Hale & Myerson, 1996), our follow-up analysis examined age differences. The association between neuroticism and nonverbal (and verbal) tasks did not vary by age in this sample suggesting that neuroticism is an important risk factor for compromised cognitive health, as reflected in RTI, across the adult life span. Nonetheless, there was a negative association between age and verbal RTI suggesting that older adults in this sample were less inconsistent in this domain. Due to the cross-sectional nature of the current study, however, we cannot rule out possible selection effects. For example, older adults in our sample scored lower in our neuroticism measure (rage,neurot = −.22; see Table 1) and this might have underestimated differential effects of this personality trait across the life span. However, our result that older adults scored lower in neuroticism is supportive of socioemotional aging propositions that age is linked with improved emotion regulation (e.g., Carstensen et al., 1999). Future longitudinal studies will be able to clarify this result.
NA Explains the Neuroticism-RTI Link
Contrary to our hypothesis, we found that NA, but not CI, accounted for the neuroticism-RTI link and that this effect increased with age. Elevated NA is a prominent feature of the personality trait neuroticism raising the question of what is it about this affective correlate of neuroticism that specifically contributes to greater trial-to-trial variability. Some have posited that attentional resources are compromised among those with elevated levels of depressive mood, which suggests that greater RTI may likely be due to a tendency to direct attentional resources toward negatively-valenced thoughts rather than at the task at hand (Bunce, Handley, & Gaines, 2008). Given previous evidence showing that CI explained the association between neuroticism and average level of test performance while accounting for NA (Munoz et al., 2013), this study’s finding may point to the utility of both CI and NA as two risk factors for compromised cognitive function, but the contribution of each is task specific (Moberly & Watkins, 2008). For example, CI may be a relevant mechanism when performance draws on limited storage but NA may be a more relevant predictor of the integrity or efficiency of information processing as it was for this study.
Lastly, we found moderation of NA by age on RTI indicating that older individuals who report greater NA tend to be more inconsistent. Further, the indirect effect through NA was moderated by age showing that the indirect effect of NA is stronger among older individuals. This shows that increased levels of NA in older adults may place them in a vulnerable position for compromised cognitive task performance, and that NA is key mechanism in this relationship among those older adults who score high in trait neuroticism (e.g., Charles, 2010). Thus, NA may be one relevant modifiable risk factor for reduced cognitive health in older age. Strategies that have been proposed to reduce NA among aging individuals include cognitive behavioral therapies (Butler, Chapman, Forman, & Beck, 2006) and mindfulness interventions (Grossman, Niemann, Schmidt, & Walach, 2004). Other strategies could also include person-specific investigations of lifestyle factors that may be exacerbating negative affectivity among older adults, such as loneliness or lack of physical activity, and targeting those factors in efforts to see reductions in NA. The lack of an indirect effect through NA for those in the younger age group indicates that there may be different mechanisms for younger adults. Future work evaluating additional mediating mechanisms may reveal relevant pathways in this association among younger adults.
One important limitation to the current study is its cross-sectional nature precluding statements about the ordering of effects from trait neuroticism to RTI. We estimated models based on theory and previous evidence, but we are unable to discern directionality. Future research examining these constructs longitudinally, across multiple time points and across multiple time scales (e.g., hours, weeks, years) will be invaluable for uncovering the mechanics of these processes. Another limitation is the lack of an experimental method for uncovering whether RTI reflects attentional bias toward negatively valanced thoughts among those who score high in trait neuroticism. Future research implementing relevant experimental techniques, such as a dote probe approach (MacLeod, Mathews, & Tata, 1986), are needed to identify the attentional biases for those high in trait neuroticism and NA. Relatedly, the size task that comprised our verbal processing speed task required both visuo-spatial and verbal processing as participants had to visualize the word of the object presented on the screen to determine if it was bigger or smaller than a basketball. Future research considering tasks that are purely visuospatial and purely verbal will allow for a more complete disentanglement of the effects of neuroticism and NA in the context of different types of information processing. Additionally, although we employed a commonly used quantification of RTI, future research would benefit from the examination of rigorous mathematical and computational approaches to quantifying RTI (Stawski et al., 2017). Lastly, we were unable to determine whether our single assessment of RTI reflects a stable trait-like (e.g., central nervous system integrity) or a more state-like (e.g., transient lapses of attention) phenomena. Nonetheless, this study underscores the value of examining RTI in processing speed tasks in addition to average RT scores.
Conclusion
RTI has been targeted as an early indicator of underlying pathological processes and may be an early indicator of cognitive status that may be useful for future prevention and intervention efforts aimed at reducing the risk of cognitive impairment (MacDonald & Stawski, 2015). This work extends previous findings by demonstrating that NA accounts for the association between neuroticism and RTI while accounting for the effects of CI. Our findings highlight the utility of measures of performance inconsistency, and neuroticism and NA as two risk factors for increased RTI that may be key in the intervention and prevention of normal and pathological cognitive dysfunction in older adults.
Funding
Research reported in this publication was supported by the National Institute on Aging of the National Institutes of Health under Award Numbers: R21AG045575, R01AG39409, R01AG26728, and F32AG056134. The content is solely the responsibility of the authors and does not necessarily represent the official views of the National Institutes of Health.
Conflict of Interest
None reported.

