


Abstract
Background: accurate and practical assessment methods for assessing appendicular skeletal muscle (ASM) is of clinical importance for the diagnosis of geriatric syndromes associated with skeletal muscle wasting.
Objectives: the purpose of this study was to develop and cross-validate novel anthropometric prediction equations for the estimate of ASM in older adults post-surgical fixation for hip fracture, using dual-energy X-ray absorptiometry (DEXA) as the criterion measure.
Subjects: community-dwelling older adults (aged ≥65 years) recently hospitalised for hip fracture.
Setting: participants were recruited from hospital in the acute phase of recovery.
Design: validation measurement study.
Measurements: a total of 79 hip fracture patients were involved in the development of the regression models (MD group). A further 64 hip fracture patients also recruited in the early phase of recovery were used in the cross-validation of the regression models (CV group). Multiple linear regression analyses were undertaken in the MD group to identify the best performing prediction models. The linear coefficient of determination (R2) in addition to the standard error of the estimate (SEE) were calculated to determine the best performing model. Agreement between estimated ASM and ASMDEXA in the CV group was assessed using paired t-tests with the 95% limits of agreement (LOA) assessed using Bland–Altman analyses.
Results: the mean age of all the participants was 82.1 ± 7.3 years. The best two prediction models are presented as follows: ASMPRED-EQUATION_1: 22.28 – (0.069 * age) + (0.407 * weight) – (0.807 * BMI) – (0.222 * MAC) (adjusted R2: 0.76; SEE: 1.80 kg); ASMPRED-EQUATION_2: 16.77 – (0.036 * age) + (0.385 * weight) – (0.873 * BMI) (adjusted R2: 0.73; SEE: 1.90 kg). The mean bias from the CV group between ASMDEXA and the predictive equations is as follows: ASMDEXA – ASMPRED-EQUATION_1: 0.29 ± 2.6 kg (LOA: −4.80, 5.40 kg); ASMDEXA – ASMPRED-EQUATION_2: 0.13 ± 2.5 kg (LOA: −4.77, 5.0 kg). No significant difference was observed between measured ASMDEXA and estimated ASM (ASMDEXA: 16.4 ± 3.9 kg; ASMPRED-EQUATION_1: 16.7 ± 3.2 kg (P = 0.379); ASMPRED-EQUATION_2: 16.6 ± 3.2 kg (P = 0.670)).
Conclusions: we have developed and cross-validated novel anthropometric prediction equations against DEXA for the estimate of ASM designed for application in older orthopaedic patients. Our equation may be of use as an alternative to DEXA in the diagnosis of skeletal muscle wasting syndromes. Further validation studies are required to determine the clinical utility of our equation across other settings, including hip fracture patients admitted from residential care, and also with a longer-term follow-up.
Introduction
Body composition assessment, particularly skeletal muscle mass (SMM), is a key component of assessing the health and functional status of older adults [1]. Assessing SMM, specifically appendicular skeletal muscle (ASM), is a key diagnostic feature for the assessment of geriatric syndromes associated with skeletal muscle wasting, such as sarcopenia [2] and geriatric cachexia [3]. Older adults with recent hip fractures are an important clinical group at an increased risk of significant reductions in SMM and adverse health outcomes including frailty, progressive disability, institutionalisation and subsequent mortality post-surgery [4, 5].
Dual-energy X-ray absorptiometry (DEXA) is commonly referred to as a reference technique for assessing body composition [6]. However its high cost, routine availability within the clinical setting and the potential challenges for the measurement of frail older adults recovering from surgery highlights the need for practical alternatives [7].
Upper-arm anthropometry offers a quick, portable and inexpensive method of assessing body composition. Previous prediction models using a set of appendicular circumferences and skinfolds have been developed and cross-validated [8–10]. However, such validation studies are yet to be undertaken in nutritionally vulnerable hospitalised older adults with hip fracture. Visvanathan et al. [11] recently developed and validated an anthropometric predication equation for application in older adults; however, the sample used to establish and validate this equation were not representative of a hip fracture sample, with few participants aged ≥80 years, few having BMIs ≤22 kg m−2 and were otherwise healthy community-dwelling adults (mean age: 50.6 ± 15.7 years); moreover, it has been suggested that the application of general predictive equations in populations different to which they are derived should be avoided [12]. Therefore, the objective of this study was to develop and cross-validate novel anthropometric prediction models for the assessment of ASM in a sample of older adults post-surgical fixation for hip fracture using DEXA as the criterion measure.
Methods
Patients and recruitment
These were cross-sectional analyses performed in older adults post-surgical fixation for hip fracture. Body composition data were collected at baseline in a sample of hip fracture patients recruited from two randomised controlled trials (RCTs) conducted by our group: (i) INTERACTIVE trial (ACTRN 12607000017426) [13]; (ii) ATLANTIC trial (ACTRN 12609000241235) [14].
Participants were eligible for each respective study if they were admitted to hospital with a diagnosis of hip fracture confirmed by a radiology report, had a Mini-Mental State Examination (MMSE) score of ≥18/30, had a body mass index (BMI) between 18.5 and 35 kg m−2 and were community dwelling. This study was conducted according to the guidelines described in the Declaration of Helsinki with all procedures involving human subjects approved by the Human Research Ethics Committee at each recruitment site.
Body composition measurements and procedures
A detailed description of all outcome measures from both investigations is reported elsewhere [13, 14]. For the purpose of the present validation study, participants recruited from the INTERACTIVE trial were used as the model development (MD) group. Predictor variables, including weight, BMI, mid-arm circumference (MAC), triceps skinfolds (TSF), age and gender, were used in the development of the prediction model. Using the same predictor variables, participants recruited from the ATLANTIC trial acted as the cross-validation (CV) group.
Weight and height
Body weight was recorded to the nearest 0.1 kg using calibrated digital scales with participants wearing light clothing and without footwear. Participants who were unable to mobilise were weighed using a calibrated weigh chair. Height was estimated from knee height using validated age- and gender-specific equations [15]. BMI was calculated as weight (kg) divided by the square of estimated height (m).
Dual-energy X-ray absorptiometry
Whole body and regional body composition were estimated using Lunar Prodigy DEXA and automated reporting the GE EnCORE bone densitometry software (version 10.51.006). The system software also provides estimates of ASM, defined as the sum of lean soft tissue mass in both arms and legs [6].
Upper-arm anthropometry
MAC was measured at the mid-point between the superior and lateral border of the acromion process and the proximal and lateral border of the radial head to the nearest 0.1 cm using a flexible steel measuring tape. TSF thickness was measured at the marked posterior mid-acromiale-radiale to the nearest 0.2 mm using a calibrated Harpenden skinfold calliper. All anthropometric measures were performed by trained staff. Unless affected by injury, all anthropometric measures were taken on the right-hand side of the body.
Statistical analyses
Analyses were performed using SPSS for Windows 21.0. Significance was set at P < 0.05. Differences between the MD and CV cohorts were examined by independent samples t-test. Using ASMDEXA as the criterion measure, multiple linear regression analysis was undertaken in the MD group to identify the best performing predictive models. In the development of the prediction model, we selected predictor variables based on the results of the correlation analyses and their relationship with ASMDEXA. Variables displaying no significant relationship in the regression model were removed from the final prediction model. The linear coefficient of determination (R2) in addition to the standard error of the estimate (SEE) was calculated. The equations developed in the MD group were used to calculate predicted ASM in the CV group. Agreement between estimated ASM and ASMDEXA was assessed using paired t-tests to identify fixed bias with the limits of agreement (LOA) between the two measures assessed using Bland and Altman analyses [16, 17].
Results
Seventy-nine participants in the MD group (males, n = 23 and females, n = 56) and 64 participants (males, n = 14 and females, n = 50) in the CV group contributed data. The mean (SD) weight, BMI, MAC, TSF thickness and ASM for both groups are presented in Table 1.
Post-surgical anthropometric characteristics in two hip fracture cohorts (all such variables reported as mean ± SD)
| All | MD groupa (INTERACTIVE) n = 79 | CV groupb (ATLANTIC) n = 64 | ||||
|---|---|---|---|---|---|---|
| Mean | SD | Mean | SD | Mean | SD | |
| Age (years) | 82.1 | 7.3 | 82.7 | 5.9 | 81.1 | 8.9 |
| Weight (kg) | 64.3 | 13.8 | 65.4 | 14.0 | 62.6 | 13.3 |
| BMI (kg m−2) | 24.7 | 4.2 | 24.9 | 4.0 | 24.3 | 4.5 |
| MAC (cm) | 26.0 | 4.0 | 26.2 | 3.8 | 25.6 | 4.2 |
| TSF thickness (mm) | 14.6 | 5.9 | 15.2c | 5.6 | 13.5c | 6.2 |
| ASMDEXA (kg) | 16.8 | 3.8 | 17.2 | 3.8 | 16.4 | 3.9 |
All data were collected at baseline within 14-days post-surgery for INTERACTIVE participants or within 7-days post-surgery for ATLANTIC participants.
MD, model development group; CV, cross-validation group; BMI, body mass index; MAC, mid-arm circumference; TSF, triceps skinfold thickness; ASM, appendicular skeletal muscle; DEXA, dual-energy X-ray absorptiometry.
aINTERACTIVE participants used in the development of the prediction models; n = 79 hip fracture patients with complete DEXA and anthropometric data.
bATLANTIC participants used in the cross-validation of the prediction models; n = 64 hip fracture patients with complete DEXA and anthropometric data.
cSignificant differences in predictor variables between the MD and CV groups assessed by independent samples t-test (P < 0.05).
In relation to all other predictor variables in the model, TSF thickness and gender resulted in a weak, non-significant contribution to the regression model (TSF thickness: β = 0.093; P = 0.260 and gender: β = 0.142; P = 0.095).
The best two performing prediction models are presented as follows:
ASMPRED-EQUATION_1: 22.28 – (0.069 * age) + (0.407 * weight) – (0.807 * BMI) – (0.222 * MAC); Adjusted R2: 0.76; SEE: 1.80 kg
ASMPRED-EQUATION_2: 16.77 – (0.036 * age) + (0.385 * weight) – (0.873 * BMI); Adjusted R2: 0.73; SEE: 1.90 kg
[Age in years; weight in kg; BMI: weight (kg) divided by the square of height (m) (kg m−2); MAC in cm].
When assessing agreement in the CV group, no significant difference was observed between measured ASMDEXA and estimated ASM (ASMDEXA: 16.4 ± 3.9 kg; ASMPRED-EQUATION_1: 16.7 ± 3.2 kg (P = 0.379); ASMPRED-EQUATION_2: 16.6 ± 3.2 kg (P = 0.670)). Mean bias from the CV group between ASMDEXA and the predictive equations is as follows: ASMDEXA – ASMPRED-EQUATION_1: 0.29 ± 2.6 kg (LOA: −4.80, 5.40 kg); ASMDEXA – ASMPRED-EQUATION_2: 0.13 ± 2.5 kg (LOA: −4.77, 5.0 kg). Bland–Altman plots of the comparisons are highlighted in Figure 1.
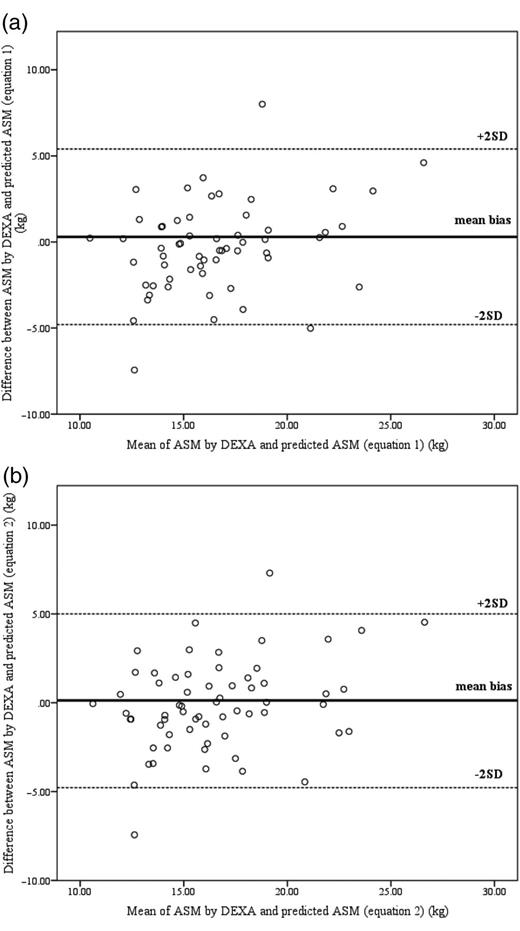
Bland–Altman plots: mean bias and 95% LOA for the assessment of predicted ASM and measured ASMDEXA, the reference technique. In this technique, the difference between measured ASMDEXA and predicted ASM (i.e. mean bias) was plotted along the vertical axis against the mean of the two measures on the horizontal axis where the aim was to describe the variability in agreement between the two measures. Assuming a normal distribution of differences, theoretically, 95% of the differences are expected to be within ± 2SD; (a) ASMDEXA versus ASMPRED-EQUATION_1; (b) ASMDEXA versus ASMPRED-EQUATION_2. The solid bold line represents the mean difference between measured ASMDEXA and predicted ASM. The two dashed lines illustrate the 95% LOA (±2 SD) between the two measures.
Discussion
To the best of our knowledge, this is the first study to develop and validate anthropometric predictive equations for the estimate of ASM in hip fracture patients. Our equations may be of use for clinical application and useful as an alternative to DEXA for inclusion in the assessment of geriatric syndromes.
At present, there are several published predictive equations that use bioelectrical impedance analysis as a reference method developed for application in older adults for the assessment of SMM, ASM and/or FFM [18–22]; however, the development of body composition predictive equations among hip fracture patients is scant. We have previously applied one these equations [22] to our MD sample of hip fracture patients and reported clinically unacceptable discordance from SMMDEXA, thus supporting the argument for population-specific algorithms that demonstrate clinically acceptable agreement with DEXA [23, 24].
Results from the present study are consistent with those presented by Visvanathan et al. [11] (Adj R2 = 0.87; SEE = 1.95). Unlike our prediction models, the best performed model established by Visvanathan et al. [11] used BMI, weight, age and gender. Although the model proposed by Visvanathan et al. [11] explained a greater variance of ASMDEXA, this is likely attributable to the heterogeneity in the body composition status of our hip fracture sample, differences in age and the acute phase of injury. Unexpectedly, in this study, gender demonstrated a weak and non-significant contribution to the regression model and was subsequently removed from both final prediction models; it is possible that this could be attributable to a gender discrepancy among both hip fracture cohorts with males under-represented relative to females.
A major strength of this study was the fact that we developed and cross-validated our prediction models in the hip fracture population. Moreover, our prediction equation also included simple upper-arm limb circumference as a predictor variable, in addition to more routine anthropometric measures such as weight and BMI. Although TSF thickness was originally a selected independent variable of interest, it demonstrated a weak and non-significant contribution to the regression model and accordingly was not included in the predictive equations. The significant difference observed in TSF thickness between the two hip fracture cohorts was likely associated with the sample recruited, with investigators from the CV group specifically recruiting cachectic hip fracture patients [14]. Less likely, but possible, is that protocol violations in the measurement of TSF may have been responsible for the significant difference observed in TSF thickness between the two hip fracture cohorts and the lack of association between TSF thickness and ASMDEXA. The measurement of TSF can be challenging and despite best efforts to train and monitor staff performance, we cannot be certain that measures were routinely undertaken according to protocol.
A potential limitation of this study was the exclusion of additional predictor variables which may have strengthened our model, including additional appendicular limb circumferences and isometric handgrip strength. Importantly, the potential for selection bias at a study entry (i.e. BMI between 18.5 and 35 kg m−2, community dwelling, medically stable and ambulatory pre-fracture) resulted in potential sarcopenic and cachectic patients being excluded from the study, which may indeed limit the generalisability of these equations; the latter considerations are pertinent because validation studies for our prediction models are required, particularly in a larger sample of hip fracture patients which specifically include more vulnerable patients such as those living in residential aged care facilities.
In conclusion, we have developed and cross-validated novel anthropometric prediction equations for the estimate of ASM designed for application in older adults post-surgery for hip fracture. Our prediction equations have potential to contribute to the diagnosis of skeletal muscle wasting syndromes in clinical care settings when DEXA scans are unavailable or unsuitable.
Accurate and practical assessment methods for assessing ASM are of clinical importance for the diagnosis of sarcopenia and cachexia.
Malnutrition and low SMM are often present upon hospital admission among hip fracture patients.
Generic application of equations developed in populations different to which they are applied is more than likely inappropriate.
We have developed and cross-validated novel anthropometric predictive equations to assess ASM in hip fracture patients.
Conflicts of interest
None declared.
Funding
Data used in this study were drawn from trials funded by the National Health and Medical Research Council (NHMRC). The PhD student (A.M.V.) was supported by a stipend from the Flinders University.
Acknowledgements
We thank the patients that agreed to participate in the projects and the research staff that were involved in collecting data. All authors contributed to this work. M.C, I.D.C, S.K and M.D.M were responsible for designing the INTERACTIVE study; M.C, L.G.C, L.C and M.D.M were responsible for designing the ATLANTIC study. A.M.V was responsible for analysis and interpretation of data and preparing the manuscript. M.D.M was responsible for analysis and interpretation of data and preparing the manuscript. M.C, I.D.C, L.G.C, S.K, and L.C provided intellectual input in refining the manuscript to its final form. P.P.S provided statistical consultation for the authors and contributed to the refining of the manuscript to its final form. All authors read and approved the final manuscript.

Comments