


Abstract
This data brief describes the European Union Statistics on Income and Living Conditions (EU-SILC). Detailed data on income and taxes are collected, as well as information on material deprivation, labour, housing, childcare, health, access to and use of services, and education. Although primarily a social policy instrument that addresses the information needs of policymakers and is used for social monitoring at the European level, EU-SILC is also closely geared to the needs of researchers and provides an excellent database for evidence-based research on a wide variety of aspects of income, income poverty, material poverty, health, and well-being in Europe. EU-SILC is composed of national probability sample surveys and is conducted annually. The target population comprises private households. Observation units are households and all current household members. EU-SILC provides cross-sectional and longitudinal data. The data are composed of a fixed core module, and annually changing ad-hoc modules. Launched in 2003 and revised with effect from 2021, EU-SILC is currently implemented in all EU Member States and in 11 non-EU countries. During the revision process, many suggestions from the research community were incorporated.
Introduction
Income in its various manifestations is an essential dimension of current and future individual welfare in a wide variety of areas of life. Current spending—e.g. on high-quality childcare, education, and healthy lifestyles for children—is an investment both in future generations and in overall societal well-being. Material poverty affects life chances and also the extent of social exclusion. From a social policy perspective, the analysis and prevention of the associated risk of social exclusion is therefore a priority objective (Marlier and Atkinson, 2010). Similarly, social research is concerned with the effect of income on the life chances of current and future generations and on society as a whole. However, few data sources cover income sources and monetary and non-monetary poverty in a comprehensive and comparative manner across Europe.
One such data source is the European Union Statistics on Income and Living Conditions (EU-SILC),1 which replaced the European Community Household Panel.2 Launched in 2003 on the basis of a gentlemen’s agreement between six EU Member States (Belgium, Denmark, Ireland, Greece, Luxembourg, Austria) and Norway, EU-SILC was implemented by means of a legal basis (EU regulations) from 2004 onwards and was gradually adopted in all EU Member States. It is currently implemented in all EU Member States and in 11 non-EU countries.3
EU-SILC is composed of annual national probability sample surveys. Detailed data are collected on income; data on material deprivation, labour, housing, childcare, health, access to and use of services, and education are collected at a lower level of detail. The target population comprises private households. Observation units are households and all current household members. EU-SILC provides cross-sectional and longitudinal data (based on a rotational panel). The data comprise a fixed core module and annually changing ad-hoc modules. Ad-hoc modules are used for in-depth analysis of specific topics and can be collected once or repeated at multi-year intervals.
As mentioned above, EU-SILC is based on binding European regulations, which is why the data are also referred to as official microdata. Until and including 2020, three types of regulations applied: (i) a framework regulation specifying scope, definitions, time reference, variables, sampling, required sample size, access for scientific purposes, etc.; (ii) Commission regulations specifying technical aspects of EU-SILC; and (iii) annual Commission regulations on the list of ad-hoc variables. In 2021, a new general framework regulation (European Parliament and European Council, 2019) came into force. Also known as the Integrated European Social Statistics, it covers all official European sample surveys of persons and households for the following domains: labour force, income and living conditions, health, education and lifelong learning, use of information and communication technologies, time use (optional), and consumption. In addition, the EU-SILC-specific regulations were updated.
Data collection and compliance with the respective European regulations is a major challenge for national statistical institutes (NSIs), as they must implement and integrate EU-SILC into their existing statistical systems and bear the costs of data collection under the constraints of scarce resources. Eurostat assists NSIs in meeting this challenge by displaying flexibility regarding national-level implementation, being open to NSI specificities and to change, and including optional variables.
This flexibility includes, e.g. the fact that EU-SILC is based on the concept of ex-ante output harmonization. While academically based international comparative surveys are regularly based on the concept of input harmonization (common survey design, survey instrument, etc.), EU-SILC is based on the concept of a common framework (in terms of requirements, concepts, and classifications) and common variables rather than a common survey.4 Within the common framework, the mode of data collection is not specified, and countries can use existing data sources (administrative data, national surveys) as well as newly established surveys for the collection of EU-SILC data.
In the early years of EU-SILC, two groups of countries could be distinguished:
The ‘traditional’ register countries (DK, FI, IS, NL, NO, SE, SI), where income data and demographic information (where available) are taken from administrative registers. Information not included in the registers (e.g. subjective information) is obtained through personal interviews.
The survey countries, where information is obtained mostly through household surveys and personal interviews with household members.
The distinction between register and survey countries is no longer clear-cut, as more and more countries use administrative data to some extent. As of 2021, 13 countries (Czech Republic, Denmark, Finland, Iceland, Ireland, Latvia, Lithuania, Malta, Netherlands, Norway, Slovenia, Sweden, Switzerland) used register data in combination with survey data for EU-SILC. The long-term aim is to replace survey-based data on social benefits and earnings with register data in as many countries as possible.
EU-SILC is primarily a social policy instrument that addresses the information needs of policymakers and is used for social monitoring at the European level. Based on social indicators generated with EU-SILC data, the economic standard of living, quality of life, and well-being of the population in the EU as a whole, across countries and over time can be observed and, where appropriate, the impact of social policy programmes or institutional differences can be studied and used for evidence-based policymaking. Since its launch, EU-SILC has become the official reference for EU social indicators on income, poverty and social exclusion (e.g. at-risk-of-poverty threshold, severe material deprivation rate, healthy life years, child well-being, housing). The country- and time-comparative indicator series are published as aggregate data and prove very useful for descriptive purposes in empirical social research.
The analytic potential of EU-SILC for social research lies primarily in the microdata. The availability of detailed income data in combination with objective and subjective data on material deprivation, health, employment, housing, etc., as well as the longitudinal component, allows for the investigation of a wide range of research questions. For example, the time series covered by EU-SILC have been extensively used to analyse the impact of the 2007–2008 financial crisis on health outcomes and labour market outcomes (e.g. Heggebo, 2015; Abebe, Tøge and Dahl, 2016).
A search in the Web of Science Core Collection using the keyword ‘EU-SILC’ yields 651 publications for the period 2010–2021 covering topics such as inequality, social transfers, mortality risk due to poverty and social exclusion, material deprivation, cross-national differences in housing conditions, unmet medical needs, child deprivation, living conditions of migrants, and the dynamics of monetary in-work poverty and deprivation and multidimensional poverty (e.g. Gonalons-Pons and Gangl, 2021; Guio, Marlier and Nolan, 2021; Mysíková, 2021).
Besides substantive research, many papers use EU-SILC for methodological research. A large body of research uses the detailed measurements to develop better indicators for poverty and material deprivation (e.g. Bishop et al., 2014; Betti et al., 2015; Želinský, Ng and Mysíková, 2020). Other papers deal with specific problems of multilevel models (Bryan and Jenkins, 2016), the handling of complex samples across countries (Goedemé, 2013; Kaminska and Lynn, 2017), differences between register-based and survey-based measurements (Lohmann, 2011), and population simulation (Alfons et al., 2011). There is also sizeable research on small-area estimation (e.g. Marhuenda, Molina and Morales, 2013).
In sum, EU-SILC is a dataset of high interest to researchers. However, its design and structure are complex. The remainder of this paper explains EU-SILC in more detail. The next section describes the methodology used by EU-SILC; the subsequent three sections explain the structure and content of and access to EU-SILC data, respectively. The paper ends with concluding remarks.
Methodological Specifics
Ex-ante harmonization requires a trade-off between flexibility and quality. Although EU-SILC has clear specifications on the target population, observation units, and data structure, it allows more flexibility in terms of sampling and fieldwork. These aspects are discussed in more detail below.
Target Population
The target population of EU-SILC comprises all private households and their current members residing in the territory of the country5 at the time of the data collection. Persons living in collective households or in institutions are excluded. The definition of ‘private household’ used by Eurostat (and by most NSIs) is based on the criterion of housekeeping—i.e. a private household is defined as a person living alone or a group of persons living together in the same private dwelling, sharing expenses and providing jointly for living essentials.
Current household members are persons usually6 resident in the household, as well as persons who are temporarily or long-term absent (e.g. at boarding school or working away from home), provided they have close ties to the household and—with the exception of persons working away from home—currently have no other private address. Subtenants, au pairs, etc. are also counted as household members if they contribute to household expenses, currently have no other private address, and have lived in the household for at least 6 months.7
While the cross-sectional data include only information on current household members, the longitudinal data also include basic information on former household members. This information indicates whether household members have moved or died since the last data collection. Accordingly, the data can be used, e.g. to study social differentiation in adolescents’ moving-out behaviour. In combination with the health topics, analyses of socially differentiated mortality are also of research interest (see Mackenbach et al., 2015; Klotz and Göllner, 2017).8
Sampling Design
According to the current and former framework regulations (European Parliament and European Council, 2003, 2019), EU-SILC data must be based on representative probability samples of the population. All private households and all persons aged 16 years or over living in the household are eligible. The sampling probabilities must be specifiable and non-zero for all households and individuals in the population.
The sampling designs used by the participating countries vary (see Table 1). They range from simple random sampling to multistage stratified sampling. Iceland and Malta use single-stage simple random samples. All other countries use stratified random sampling. Most of them use two-stage or multi-stage random sampling, except Cyprus, France, Ireland, Netherlands, Lithuania, Luxembourg, Austria, Slovakia, Sweden, and Switzerland, which use stratified single-stage random sampling. Estonia uses systematic stratified random sampling. Depending on the country, the sampling units can be individuals, households, dwellings, or addresses (see Table 1).
Simplified sampling design by country
| Sampling design (in simplified terms) | Sampling unit | Country |
|---|---|---|
| Without stratification | ||
| Simple random sampling | Individuals | IS |
| Dwellings/addresses | MT | |
| With stratification | ||
| Stratified two-stage sampling | Dwellings/addresses | HR, LV, NL, PT |
| Individuals | SI, DK | |
| Stratified multi-stage sampling | Dwellings/addresses | CZ, EL, ES, PL, RO, UK |
| Households | BE, BG, IT | |
| Stratified single-stage random sampling | Dwellings/addresses | AT, CY, DE, LU, FR |
| Households | CH, SK, IE | |
| Individuals | LT, NO, SE | |
| Stratified sampling according to a different design by rotational group | Households | HU |
| Stratified and systematic sampling | Individuals | EE |
| Stratified two-phase sampling | Individuals | FI |
Source: Eurostat, 2020, own compilation.
Eurostat specifies minimum requirements for data precision. Until and including 2020, a minimum effective sample size was specified for each country based on the precision requirements for the at-risk-of-poverty rate. Since 2021, precision requirements are based on minimum thresholds for variable-specific estimated standard errors at the national and the NUTS-2 levels. The standard error requirement has the advantage of allowing NSIs to adjust their sample sizes to their national circumstances while maintaining the overall objective of statistical precision. The realized sample sizes (households, persons) in 2018 are shown in Table 3.
EU-SILC—types of observation units
| Observation unit | Data source | ||
|---|---|---|---|
| Topics | Survey countries | Register countriesa | |
| Social exclusion, housing | (1) Household (HH) | HH respondentb | Register/HH respondent |
| Basic demographic personal data, childcare | (2) All HH members | HH respondentb | Register/HH respondent |
| Basic personal data on income, education, labour | (3) All HH members aged 16+ years | All HH members aged 16+ years | Register/HH respondent |
| Detailed personal data | (3) All HH members aged 16+ years | All HH members aged 16+ years | Register/All HH members aged 16+ years |
| (4) Selected respondent | Selected respondent: DK, FI, IS, NL, NO, SE, SI | ||
CH, CZ, DK, FI, IE, IS, LT, LV, MT, NL, NO, SE, SI.
Person from whom household-level information is obtained.
Source: Partly adapted from Eurostat (2019: p. 25).
Realised household (HH) response rates and sample size, EU-SILC 2018
| Country | First wave HH response rate (in per cent) | Overall HH response rate (in per cent) | Net HH sample size | Net person sample size |
|---|---|---|---|---|
| LU | 31 | 51 | 3,833 | 10,548 |
| NL | 35 | 53 | 12,493 | 2,761 |
| DK | 36 | 60 | 5,604 | 11,706 |
| BE | 40 | 64 | 5,946 | 13,726 |
| UK | 40 | 43 | 17,113 | 38,705 |
| IE | 44 | 56 | 4,382 | 11,131 |
| CH | 46 | 60 | 668 | 152 |
| CZ | 55 | 79 | 8,634 | 18,944 |
| AT | 57 | 76 | 6,103 | 12,749 |
| FI | 58 | 76 | 9,832 | 23,879 |
| LV | 58 | 79 | 5,833 | 12,843 |
| NO | 59 | 64 | 5,981 | 14,315 |
| HR | 60 | 79 | 8,383 | 21,282 |
| SE | 61 | 54 | 5,831 | 14,403 |
| SK | 62 | 84 | 5,662 | 15,722 |
| SI | 63 | 74 | 8,669 | 25,843 |
| FR | 65 | 82 | 10,876 | 24,698 |
| BG | 66 | 88 | 7,233 | 17,022 |
| EE | 67 | 82 | 6,072 | 14,888 |
| ES | 69 | 77 | 13,368 | 33,734 |
| IT | 71 | 82 | 21,173 | 45,761 |
| LT | 72 | 88 | 4,905 | 11,151 |
| DE | 73 | 79 | 12,892 | 25,193 |
| EL | 74 | 83 | 24,305 | 5,666 |
| HU | 77 | 85 | 7,524 | 16,841 |
| MT | 77 | 87 | 3,823 | 9,815 |
| CY | 83 | 90 | 4,192 | 11,108 |
| RO | 86 | 95 | 7,278 | 17,125 |
| PL | 87 | 87 | 15,214 | 39,922 |
| PT | 87 | 94 | 13,717 | 33,935 |
| IS | n.a. | n.a. | 2,969 | 8,652 |
| RS | n.a. | n.a. | 5,212 | 16,530 |
| Total | 281,732 | 671,641 |
Note: Household (HH) response rate = ratio of the number of household interviews completed to the number of eligible households at the contacted addresses; Net HH sample size = number of accepted household interviews.
Source: Eurostat (2020), own computation.
Rotating Panel Design
EU-SILC data must meet two goals: first, to provide independent cross-sections that reflect representative national macro trends; second, to measure change at the individual and household level. Although the first goal can be reached by consecutive newly sampled cross-sections, the second goal requires panel data.9 To meet both goals, EU-SILC uses a rotating panel.
More specifically, as displayed by way of illustration in Figure 1, four independent sub-samples are surveyed in Year 1, each making up a quarter of the desired overall sample size. In Year 2, one subsample is dropped, and the other three are followed up. Additionally, a new subsample is surveyed, again constituting a quarter of the desired overall sample size. In Year 3 again, one subsample is dropped, and the remaining subsamples are followed up. Two subsamples are now in their third waves, and the subsample that was added in Year 2 is now in its second wave. In Year 4, the subsample for Rotational Group 3 is dropped after three waves, the subsamples from Rotational Groups 4–6 are followed up, and a new subsample from Rotational Group 7 is added. In Year 5, all initial subsamples have been replaced, and Rotational Group 1 is reassigned. From Year 4 onwards, there is a rotational group with four consecutive waves, a rotational group with three consecutive waves, a rotational group with two consecutive waves, and a rotational group with only one wave in the panel. From this rotating panel data, the cross-sectional data are constructed from each column in Figure 1, and the longitudinal data are constructed from each row in Figure 1.
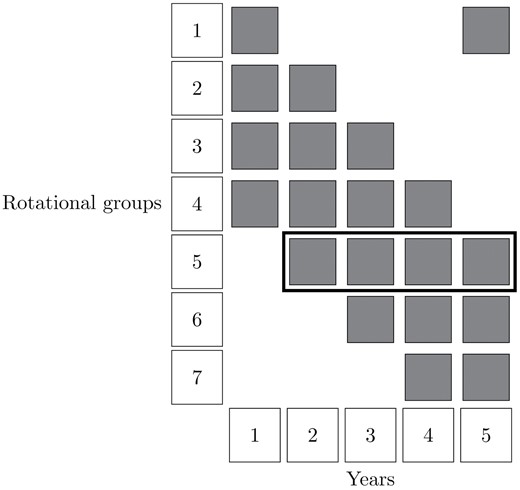
EU-SILC rotational panel design up to 2021
Although panel data were initially given lower priority, it became apparent that four waves did not do justice to the analytical potential of EU-SILC. As from 2021, the panel design was extended on a voluntary basis to a 6-year rotational panel design (European Parliament and European Council, 2019: p. 30). In the case of a 6-year rotation scheme, the system outlined above remains the same, except that two additional waves are added.
From a methodological perspective, ‘the limited membership in a rotating panel acts to reduce the problems of panel conditioning and panel loss in comparison with a nonrotating panel survey, and the continual introduction of new sample helps to maintain an up-to-date sample of a changing population’ (Duncan and Kalton, 1987: p. 103). From a substantive perspective, however, a long-term panel offers greater analytical potential. It is therefore hoped that as many countries as possible will survey a 6-year panel in the future.
Observation Units
Depending on the topic, the data collected in EU-SILC refer to different observation units, namely: (i) the household; (ii) all household members; (iii) all household members aged 16 years and over; and (iv) in the case of the ‘traditional’ register countries, the selected respondent (see Table 2).
Data measured at the household level (i) include general information, housing information, deprivation items, and household-related transfers. Basic demographic data are collected for all household members regardless of age (ii). Basic personal data on income etc. are collected only for household members aged 16 years and over (iii).
In addition, there are so-called detailed personal data, e.g. on health status and well-being. Depending on the type of country, there is an essential difference in the observation unit, of which researchers are sometimes unaware. In the survey countries and ‘new’ register countries, the detailed personal data are recorded for all household members aged 16 years and over (iii). However, in the ‘traditional’ register countries, this set of variables is collected only from the selected respondent (iv) rather than from all adult household members.
The ‘selected respondent’ model10 practised in the ‘traditional’ register countries refers to a person sample. The selected respondent is the sample person; the household to which they belong is the sample household. In this model, only the selected respondent is asked the detailed personal data questions. This type of information is not usually included in the registers and—partly because of its characteristics—cannot be collected by proxy interviews. Restricting the personal interview to the selected respondent is cost-effective for the NSIs. However, it also means that specific data are available only for one person in the household, and any associations in the household context cannot be analysed. On a positive note, it is not expected that the selected respondent model will be extended to further register countries. According to the revised implementing regulation (European Commission, 2019), only those countries that used the selected respondent model before 19 January 2020 will be authorized to continue using it.
Household-level questions should be answered by a ‘household respondent’ aged 16 years or over. This should be a person who is well informed about the household’s economic situation and other issues affecting the household (e.g. childcare, housing). In ‘traditional’ register countries, the selected respondent and the household respondent may be the same person or different persons. For example, if the selected respondent is the 17-year-old daughter, she is unlikely to know about topics such as mortgage payments. In this case, the household interview should be conducted with an adult household member who is better placed to provide the information. Apart from the information collected from the household respondent, all other information should be collected directly from the target person.
Fieldwork
EU-SILC data can be collected through surveys, from registers or both. The actual survey operation is left to the NSIs and should be conducted in accordance with their ‘best practices’ in order to ‘maximise the response rates achieved’ (European Commission, 2003: p. 26). However, there are specifications with regard to the fieldwork. For interviews, there is a mandatory minimum of three call-back attempts. During the fieldwork, a database must be set up that records the final disposition codes for each unit. With respect to personal interviews, proxy interviews should be avoided if possible.11 For the initial samples, controlled unit substitutions are allowed for cases where the response rates fall below 60 per cent and addresses cannot be located or accessed, the household declines interview participation, is temporary absent, or unable to respond. Depending on the data source (survey or register), the specifications for the fieldwork period are between 4 and 12 months.12
For the panel survey operation, the between-wave spacing is mandated to be as close to 12 months as possible, and tracing rules are defined. Households that decline to participate in the interview, or for which the addresses cannot be located in 1 year, and households in which no person was encountered in the first wave or in two consecutive waves are dropped. Sample persons and all persons living with a sample person are followed up if they move household within the national territory (see Note 5), if they move to an institution or collective household, or if they move out of the covered territory only temporarily.
Until and including 2020, the survey modes could be face-to-face, computer-assisted and paper-and-pencil personal or telephone interviews, self-administered questionnaires, or computer-assisted web interviews. As from 2021, surveys should be based on computer-assisted methods. If NSIs deviate from this rule, they must provide justification.
In 2018, the national fieldwork measures resulted in the response rates shown in Table 3. The second column shows the country-specific response rates for the first wave, which reflect the initial recruitment success, while the overall response rates (third column) reflect response rates for all households in all rotation groups combined. We see a large variance for the first waves ranging from 31 per cent in Luxembourg to 87 per cent in Poland and Portugal, indicating varying success in recruitment procedures. However, in the vast majority of countries, response rates were well above 50 per cent in the first wave and also in subsequent waves. The fourth and fifth columns show the realized total number of households and persons in the 2018 cross-sectional data.
Data Structure
In the following, we outline the structure of the EU-SILC data. As both household and personal data are collected, EU-SILC has a hierarchical structure: persons (lower level) are nested within households (higher level). Due to the complexity, these two levels are stored in separate datasets. Within these two levels, a further distinction is made between so-called ‘register’ data and substantive data, which are also stored in separate datasets. In sum, EU-SILC is therefore composed of four different datasets (per country): (i) Household register (D-file); (ii) Household data (H-file); (iii) Person register (R-file); and (iv) Person data (P-file) (see Table 4).
Data structure
| Household level | Person level |
|---|---|
| Household Register (D-file): | Personal Register (R-file): |
| All selected households (incl. households where address could not be contacted or that could not be interviewed) | All current household members of any age |
| Longitudinal component: also household members registered in the R-file of the previous year or living at least 3 months in the HH during the income reference period | |
| Household Data (H-file): | Personal Data (P-file): |
| Only households that have been contacted and completed a household interview, and at least one household member has complete data in the personal data file (P) | Only household members aged 16+ years and only if the information could be completed from interview and/or registers |
The register files differ from the substantive data files in terms of population and content. In terms of population, the household register file (D) corresponds to the gross sample—i.e. the D-file sent to Eurostat contains all sample households, including those that could not be contacted or interviewed. The household data file (H) contains the net sample, i.e. households that were contacted and for which a household interview was conducted and at least one member has complete data in the personal data file (P). The person register file (R) contains all members of the household included in the H-file. The person data file (P) contains only household members aged 16 years and over.
In terms of content, the household register file contains basic information such as sampling design and household weights. Similarly, the personal register file contains methodological information (e.g. interview type, proxy) and demographic information for all household members. The household data files and the person data files, in turn, contain the substantive information, i.e. the core variables and ad-hoc variables.
All four files (D, H, R, P) can be linked to each other. However, in contrast to most academic panel surveys, the cross-sectional and longitudinal EU-SILC data collected before 2021 are available only as separate data files that cannot be linked. The reason for this is that when EU-SILC was established, the NSIs were free to collect the longitudinal data independently of the cross-sectional data. At the same time, some characteristics were collected only cross-sectionally and others only longitudinally. This distinction between cross-sectional and longitudinal information is no longer found in the revised implementing regulation (European Commission, 2019). From the 2021 data collection onwards, the household and person identifiers for the longitudinal data are created in the same way as those for the cross-sectional data. Accordingly, it will be possible to link cross-sectional and longitudinal data. However, it cannot be ruled out that due to data confidentiality concerns, some NSIs will not agree to such linking.
Topics Covered by EU-SILC
In this section, we outline the topics covered by EU-SILC data. The information to be collected is specified by the respective EU regulations and described in more detail in the respective user guide (e.g. Eurostat, 2021). NSIs are generally required to provide all variables included in the regulations. However, there are exceptions, e.g. if new variables are introduced or modifications are tested that are not included in the regulations. The NSIs are free to collect this information. EU-SILC comprises a core module, which is surveyed annually, and annually changing ad-hoc modules.
Core Module
The core module covers different topics (Eurostat, 2021: Part II). The main and most detailed topic is income. Income variables include, e.g. cash or near cash employee income, non-cash employee income, and employers’ social insurance contributions; gross cash profits or losses from self-employment and value of goods produced for own consumption; income from capital investment and rental of a property or land; social benefits (family-/children-, housing-, and education-related allowances; unemployment, old-age, survivors’, sickness and disability benefits). This is contrasted with information on expenditures, e.g. mortgage interest payments and transfers paid, e.g. income and wealth taxes, social insurance contributions, and regular cash transfers to other households. Also recorded are contributions to and income from private pension plans. Income from employment and self-employment, most social benefits, and contributions to and receipt of private pensions are measured at person level; all other income variables are collected at the household level.
Besides income, EU-SILC contains at the household level variables on household structure, housing situation, housing costs, household amenities, material housing deprivation, and basic regional information. At the person level, there are basic demographic variables for all household members and several variables covering schooling and childcare for children under 12 years.
As mentioned above, EU-SILC refers to private households, defined by the criterion of shared dwelling and housekeeping. However, researchers are also interested in family relationships within the household. Until and including 2020, the family context within the household was captured by parent–child relationships as well as couple relationships, with no distinction between biological and social parenthood.
This lack of differentiation has been criticized by family researchers as it does not adequately reflect internal household relationships. This concern was taken into account with the revision of EU-SILC from 2021 onwards, insofar as a household grid is collected that captures family relationships in a more differentiated manner. Here, too, Eurostat proves to be very flexible: the NSIs can choose the level of detail on which they transmit the household grid to Eurostat. For the category ‘child’, e.g. the information ‘son/daughter’ would be a low level of detail. In the case of a high level of detail, a distinction would be made between natural/adopted child and step-child (European Commission, 2019).
A number of other socio-demographic variables, e.g. marital status, consensual union, and country of birth, are collected for household members aged 16 years and over. As from 2021, country of birth, citizenship, duration of stay in the country of residence, and parents’ country of birth have been added for all household members. Current participation in education and training and the highest level of education are measured according to ISCED. Work- and employment-related variables include current economic status, weekly working hours, and economic activity of the firm. Employment status and occupation are recorded for the current or last main job13; type of contract and supervisory responsibility are recorded only for the current job. Activity status during the reference period, a monthly activity calendar for the reference year, employment experience and—since 2021—unemployment experience are also collected. On health, information is collected on self-perceived general health, long-standing health problems, health-related activity limitations, and access to health care. In 2021, variables for overall life satisfaction and trust in others were added.
As mentioned above, before the revision, not all information was included in the longitudinal component. This concerns migration background, education, childcare, housing costs, housing problems and problematic neighbourhoods, most indicators on work and employment, and access to health care. Starting with the 2021 data collection, this gap is being closed, as the explicit separation of cross-sectional and longitudinal variables has been removed.
In addition to the substantive variables, EU-SILC uses a systematic set of flag variables for simplified data use. Most flag variables indicate why the substantive variables contain no information—i.e. they explain cases where no answer is given, information is missing due to filtering, or the country does not deliver the variable. Moreover, for the income variables, the flag variables contain an elaborate coding scheme to indicate whether the variables were collected as gross or net income variables, and whether and how imputation was used for the respective variable. With this information, data users can decide whether the imputation schemes fit their analysis goals. From 2021 onwards, the flag variables also contain information on the data source (survey or register).
As in other surveys, EU-SILC uses concept-specific reference periods. The two main reference periods used are the income reference period, which applies to income data, and the current reference period (date of interview), which applies to most other data. In addition, there are further reference periods, such as the last 12 months, since last year, since last interview, and the childcare reference period14 (Eurostat, 2021: p. 34f).
With regard to income, a fixed 12-month period is used as a reference period. This is a compromise between short-term measures (e.g. current income) and long-term measures (e.g. lifetime income) to avoid problems of seasonal variation or measurement errors due to problems of recall. In most countries, the income reference period is the previous calendar year. Exceptions are Ireland, where the income reference period is the previous 12 months, and the United Kingdom, where income is measured for the current year.
The substantive breadth of the core module provides analytical potential for research on inequality (e.g. Marrero and Rodriguez, 2012; Albertini, Ballarino and De Luca, 2020), gendered labour market topics (e.g. Bredtmann, Otten and Rulff, 2018; Bertogg, Strauß and Vandecasteele, 2021), home ownership (e.g. Lennartz, Arundel and Ronald, 2016), migration (Boeri, 2010), fertility (Vignoli, Drefahl and De Santis, 2012; Klesment et al., 2014), as well as more exotic topics like mortgage defaults risks (Magri and Pico, 2011), energy or fuel poverty (e.g. Thomson and Snell, 2013), and forced car ownership (Mattioli, 2017).
Ad-Hoc Modules
Ad-hoc modules have been included every year since 2005 in order to supplement the core variables collected annually in EU-SILC with additional information on less explored aspects of social exclusion. Like the core variables, the ad-hoc modules are governed by EU regulations and are mostly mandatory for NSIs. The regulations regarding ad-hoc modules specify the respective target variables, the observation units, the mode of data collection, the reference period, and whether the variables are mandatory or optional.
In the ad-hoc modules—as in the core module—household variables are collected from the household respondent, and individual-level variables are collected by interviewing household members aged 16 years and over (in the case of children under 16: household respondent) or, in the register countries, by interviewing the selected respondent.
As can be seen from the list of previous ad-hoc modules in Table 5, the topics recur over time. However, the variables are often not completely identical, as new characteristics are added and others are dropped. It is very helpful for research that the ad-hoc modules are subjected to quality analysis by Eurostat. These ad-hoc quality reports provide an overview of whether the differences between countries are more likely to be of substantive or methodological nature.
EU-SILC ad-hoc modules 2005–2020
| Year | Ad-hoc module topics |
|---|---|
| 2020 | Over-indebtedness, consumption, and wealth as well as labour |
| 2019 | Intergenerational transmission of disadvantages, household composition, and evolution of income |
| 2018 | Material deprivation, well-being, and housing difficulties |
| 2017 | Health and children’s health |
| 2016 | Access to services |
| 2015 | Social/cultural participation and material deprivation |
| 2014 | Material deprivation |
| 2013 | Wellbeing |
| 2012 | Housing conditions |
| 2011 | Intergenerational transmission of disadvantages |
| 2010 | Intra-household sharing of resources |
| 2009 | Material deprivation |
| 2008 | Over-indebtedness and financial exclusion |
| 2007 | Housing conditions |
| 2006 | Social participation |
| 2005 | Intergenerational transmission of poverty |
The previous ad-hoc modules have been used by researchers to investigate selected topics in depth, e.g. intergenerational mobility (Esping-Andersen and Wagner, 2012; Pintelon et al., 2013; Palomino, Marrero and Rodríguez, 2019), material deprivation (Chzhen et al., 2016), and social participation (Dieckhoff and Gash, 2015).
With the revision of EU-SILC, the ad-hoc modules have also been revised. Not only has the content been changed but also the survey frequency. As from 2021, the modules are to be surveyed regularly every 3 or 6 years (Table 6). Each module will consist of about 20 variables; the topic is fixed but the list of variables is not. The advantage is obvious. If the list of variables were defined several years before the actual data collection, it would be difficult to take current developments into account because the variables would already be fixed in the regulations. Changes in the regulations are time-consuming and sometimes difficult, whereas a list of variables defined close to the time of the survey gives greater flexibility in picking up on new developments.
Ad-hoc modules EU-SILC 2021–2026
| Year | Survey year | Three-year modules | Six-year and specific policy needs modules |
|---|---|---|---|
| 1 | 2021 (Voluntary module on impact of COVID-19 in EU-SILC 2021 data collection) | Children (material deprivation, care needs, health) | Specific policy needs: Living arrangements and conditions of children in separated and blended families |
| 2 | 2022 | Health | Quality of life |
| 3 | 2023 | Labour market and housing | Intergenerational transmission of disadvantages and housing difficulties |
| Specific policy needs: Household energy efficiency | |||
| 4 | 2024 | Children | Access to services |
| 5 | 2025 | Health | Specific policy needs: |
| 6 | 2026 | Labour market and housing | Over-indebtedness, consumption, and wealth |
Source: Commission Delegated Regulation (EU) 2020/2175.
The 3-year modules comprise variables that are of high policy relevance but do not have to be surveyed annually. The topics covered between 2021 and 2026 are children, labour market and housing, and health. The focal points of the module on children are material deprivation, care needs, and health. In developing the variables for children, care was taken to make them consistent with the variables for adults. The module on labour market and housing includes employment status, previous work experience, characteristics of current job and working conditions, housing costs, housing conditions, and housing environment. The module on health includes health status, health care (e.g. financial burden of health care), and health indicators (body mass index, physical activity, etc.).
In the 6-year modules (2021–2026), the topics are over-indebtedness, consumption, and wealth; access to services; intergenerational transmission of deprivation, housing difficulties; and quality of life (well-being, social, and cultural participation). Moreover, there are three flexible slots for new policy needs (a recent example is the COVID-19 pandemic).
The sequence and timing of the 3- and 6-year modules are based on the core content of SILC. The aim is to combine overlapping topics wherever possible. For example, to benefit from data complementarity, the 3-year health module is implemented in the same year as the 6-year SILC module on quality of life and the European Health Interview Survey.
Accordingly, care was taken to schedule the 3-year module on children and the 6-year module on access to services (including childcare) for the same year. Finally, the ad-hoc module on income, wealth, etc. takes into account the timing of the EU Household Budget Survey and the Eurosystem Household Financial Position and Consumption Survey conducted by the European Central Bank.
Data Access
As with academic surveys, EU-SILC distinguishes between a production database (PDB), i.e. raw data delivered to Eurostat, and a user database (UDB), which corresponds to a scientific use file and is accessible for research purposes.
The UDB differs from the PDB first in the scope of countries. Some non-EU countries (Turkey, Serbia, Albania, Northern Macedonia, Montenegro) are currently not included in the UDB. The second distinction relates to the variables. For reasons of data confidentiality, some variables (e.g. detailed regional data) are not included in the UDB, and other variables (e.g. citizenship, country of birth) are coarsened. In addition to these cross-country confidentiality measures, there are some country-specific measures that meet the confidentiality needs of these countries. The respective user guide (DocSILC065; e.g. Eurostat, 2021) provides comprehensive information on all variables included in the PDB; the differences between the PDB and UDB are documented in specific documents (Eurostat, 2021).
EU-SILC is an exceptionally well-documented survey. Most documents are published by Eurostat on its website. In addition, information is provided by the GESIS15 website and the GESIS MISSY database.16 MISSY holds metadata prepared for research on EU-SILC, other European microdata (EU-LFS, AES, CIS, SES), and the German Microcensus. The information contains metadata on the studies, year- and country-specific data availability, codebooks and variable distributions, useful tools for data management and analysis.
In the following, we will very briefly address the issue of data access.
Microdata Access
To access EU-SILC microdata, a research organization must be a ‘recognised research entity’ as defined by Eurostat. A list of recognized research entities, as well as an application form for recognition can be found on the Eurostat website.17 Researchers employed by or formally linked to a recognized research entity apply for data access by submitting a research proposal. The research proposal is reviewed by the NSIs to determine whether the ‘research question can be addressed with the data’. The NSIs have 4 weeks to respond to the request. If a NSI objects to the data release, the data for that country will not be released.
Data access is free of charge for researchers, and applications are processed quickly once the first hurdle—recognition as a research entity—has been overcome. The data are delivered as CSV files, which can be imported into Stata or SPSS with scripts provided by GESIS.18
As with all voluntary surveys, EU-SILC depends inter alia on respondents’ confidence in the protection of their privacy. This assumes that researchers are familiar and comply with basic data protection rules. Researchers who are unfamiliar with these rules or who wish to refresh their knowledge are recommended to read the Eurostat document ‘How to use microdata properly’,19 which is also a useful teaching resource.
Aggregated Statistics Published by Eurostat
Besides microdata, Eurostat provides a wide range of aggregate statistics through its Income and Living Conditions database20 (e.g. indicators of poverty risk, material deprivation, labour intensity, income inequality, household composition, housing conditions, childcare facilities). These aggregate data are very useful in providing an overview of country-specific distributions as contextual data or as reference for comparison and weighting for academic European surveys. The fact that indicators for Turkey, Serbia, Albania, Northern Macedonia, and Montenegro are also available in this database is particularly noteworthy, as microdata for these countries are not currently included in the UDB. Figures 2–4 show examples of selected key statistics for European countries for 2018 (e.g. percentage of population at risk of poverty before and after social transfers, average share of housing costs, percentage of people unable to keep dwelling adequately warm), as well as the time trend in poverty risk and the Gini coefficient from 2004 to 2020.
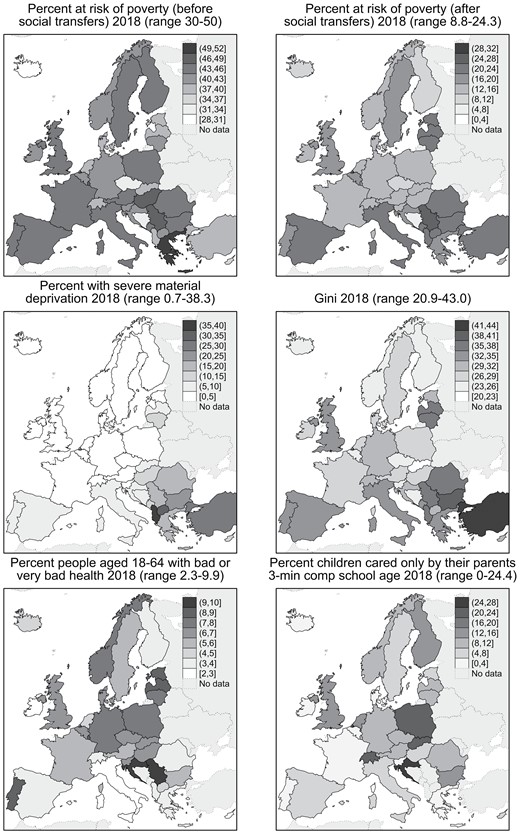
Selected examples of aggregate statistics from EU-SILC for 2018
©EuroGeographics for the administrative boundaries
Source: https://ec.europa.eu/eurostat/web/income-and-living-conditions/data/database
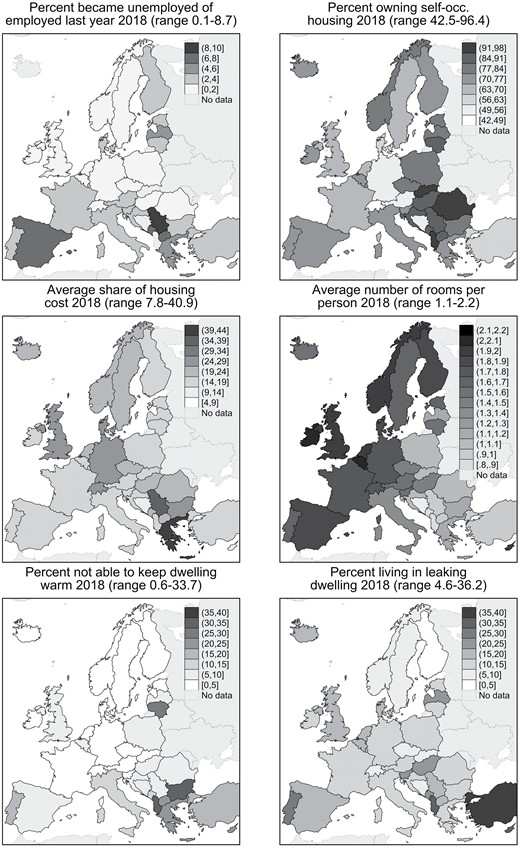
Selected examples of aggregate statistics from EU-SILC for 2018 (contd.)
©EuroGeographics for the administrative boundaries
Source:https://ec.europa.eu/eurostat/web/income-and-living-conditions/data/database
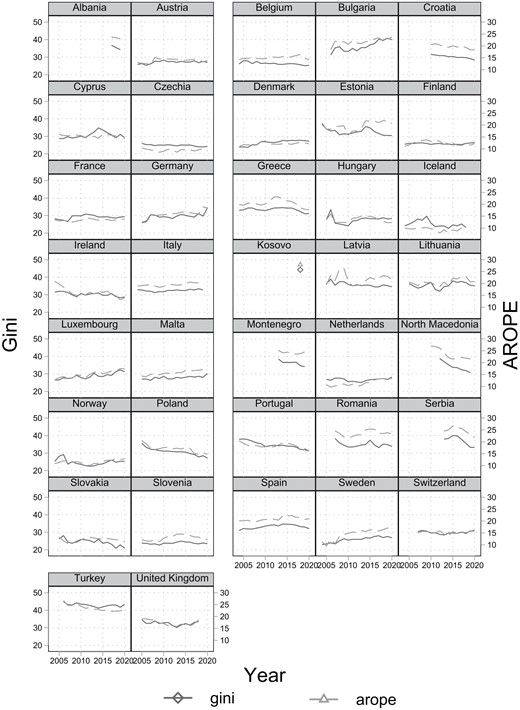
Time trend of poverty risk and Gini 2004–2020
Source:https://ec.europa.eu/eurostat/web/income-and-living-conditions/data/database
Concluding Remarks
In sum, since its launch in 2003, EU-SILC has become a valuable data source for empirical social research on income and poverty. With the variety of substantive topics and the depth provided by ad-hoc modules, coverage of the entire household, and the longitudinal component, the data allow for a variety of research options that go well beyond social policy issues.
By combining register data with survey data, EU-SILC is a very progressive data collection instrument. It is also of great methodological interest, as register data are a central data source for research in some countries, whereas in other countries, this data source is still largely untapped or almost inaccessible for research purposes.
As mentioned in the Introduction, flexibility is a key feature of EU-SILC. This manifests itself not only in the handling of NSIs but also in the effort to continuously improve data and data access for research. The major revision of EU-SILC in 2021 is the result of continuous collaboration between Eurostat, the NSIs, and the research community. For researchers, it is particularly encouraging that, in addition, the time between data collection and data provision has been continuously reduced and is currently 1 year. The premise here is timeliness before completeness. This means that the data are published at a certain point in time, regardless of whether all countries have already delivered or whether the variables are complete. The data are updated every 6 months (in spring and autumn). The advantage of this concept is that researchers can work with the current data relatively quickly, provided the countries or variables of interest are included in the first release. Of course, this also means that the data must be reprocessed each time a new release is made in order to be up to date.
EU-SILC can be evaluated very easily at both the household and the individual level, as the respective data are stored in separate data files. However, the considerable analytical potential of the data is realized primarily when household and personal data are linked and analysed together.
Footnotes
At this point, reference should also be made to the Luxembourg Income Study (LIS), which provides harmonized data on income for a large number of countries. For a comparison of EU-SILC and LIS, see Jäntti (2007).
The European Community Household Panel was conducted in 14 EU countries from 1994 to 2001 (Wirtz and Mejer, 2002).
Norway, Iceland, Turkey, Switzerland, North Macedonia, Montenegro, Serbia, Albania, Kosovo, Bosnia and Herzegovina, and the United Kingdom.
The challenges that ex-ante output harmonization poses for the comparability of EU-SILC data are discussed by Verma (2007).
Exceptions are small parts of the national territory, representing no more than 2 per cent of the national population. These exceptions refer to France, the Netherlands, and Ireland (before Brexit also the United Kingdom).
A person is defined as usually resident in the household if they spent most nights there in the past 6 months.
For the exact criteria, see the EU-SILC user guide (Eurostat, 2021: p. 35f).
Substantial knowledge gains could be expected if EU-SILC data could be linked to national mortality registers. According to Klotz and Göllner (2017), this would currently be possible in 19 of the 27 EU Member States.
For example, the indicator ‘persistent-risk-of poverty rate’, which is defined as the percentage of households that are poor in the current year and in at least 2 of the preceding 3 years, can be constructed only if 4 consecutive years are available.
For detailed information on register countries, see Jäntti, Törmälehto and Marlier (2013).
Proxy interviews are flagged in EU-SILC. In addition, it is known which household member provides the proxy information, which is of particular interest for methodological analyses.
In the new implementing regulation (European Commission, 2019), the requirement to record final disposition codes has been relaxed, so that now only specifically defined response rates must be delivered. Controlled substitutions are no longer explicitly allowed for the cross-sectional data; however, a household can now be substituted with units at the same address. The specifications for field time and wave spacing have been simplified.
Since 2021, only the activity of the current or last main job is collected. For previously active respondents, the economic activity of the firm is recorded for the last main job. Occupation is coded according to ISCO (two digits).
A typical week around the time of the interview outside of the summer school holidays.
References
Heike Wirth is head of the German Microdata Lab at GESIS, Mannheim. Her current research interests include social inequality within household and families, time use within families, the linking of administrative and survey generated data, and challenges of data access to official microdata. She is a member of the German Data Forum (RatSWD). Her work has been published in Sociological Methods & Research, Zeitschrift für Soziologie, and Kölner Zeitschrift für Soziologie und Sozialpsychologie.
Klaus Pforr received his doctoral degree from the University of Mannheim in 2013. Currently he is a researcher at the GESIS Leibniz-Institute for the Social Sciences. Current research interests comprise social implications of wealth inequality, survey methodology, and econometrics. His work has been published in journals such as Soziale Welt, Public Opinion Quarterly, The Stata Journal, and Survey Research Methods.
