


Abstract
The left superior temporal sulcus (STS) plays an important role in integrating audiovisual information and is functionally connected to disparate regions of the brain. For the integration of gesture information in an abstract sentence context (metaphoric gestures), intact connectivity between the left STS and the inferior frontal gyrus (IFG) should be important. Patients with schizophrenia have problems with the processing of metaphors (concretism) and show aberrant structural connectivity of long fiber bundles. Thus, we tested the hypothesis that patients with schizophrenia differ in the functional connectivity of the left STS to the IFG for the processing of metaphoric gestures. During functional magnetic resonance imaging data acquisition, 16 patients with schizophrenia (P) and a healthy control group (C) were shown videos of an actor performing gestures in a concrete (iconic, IC) and abstract (metaphoric, MP) sentence context. A psychophysiological interaction analysis based on the seed region from a previous analysis in the left STS was performed. In both groups we found common positive connectivity for IC and MP of the STS seed region to the left middle temporal gyrus (MTG) and left ventral IFG. The interaction of group (C>P) and gesture condition (MP>IC) revealed effects in the connectivity to the bilateral IFG and the left MTG with patients exhibiting lower connectivity for the MP condition. In schizophrenia the left STS is misconnected to the IFG, particularly during the processing of MP gestures. Dysfunctional integration of gestures in an abstract sentence context might be the basis of certain interpersonal communication problems in the patients.
Introduction
Gestures are an important component of interpersonal communication1 and have a large impact on speech perception,2,3 memory,4,5 and social functioning.6–8 Patients with schizophrenia, however, show impairments in the perception and production of arm and hand gestures.7,9–15
The processing of speech-related gestures involves different modalities, ie, the combination of auditory and visual input. The ability to combine information from multiple sensory modalities into a single, unified percept is essential for a person interacting with the external world16 and necessary for the processing of multimodal communication. However, multimodal integration requires a transfer of information, ie, functional connectivity, between disparate regions of the brain.17–19 It has been shown that the area around the left posterior superior temporal sulcus (STS; including parts of the middle and superior temporal gyrus; MTG/STG) plays an important role in integrating audiovisual information, eg, from speech and gestures.20–23
Patients with schizophrenia have difficulties in the multimodal integration of sensory input,24–29 which we hypothesize to be based on a dysfunctional connectivity of the left posterior temporal lobe. Patients with schizophrenia show impaired structural30–33 and functional brain connectivity,34–42 specifically between superior temporal and frontal brain regions (see Wolf et al43 for a review). However, up to now the functional neural connectivity of the left STS during speech and gesture integration in schizophrenia has not received attention.
Different types of gestures vary in their relation to language,1 and consequently differ with regard to integration effort and the involvement of different regions of the brain in their processing.22,23,44 Iconic gestures refer to the concrete content of sentences, whereas metaphoric gestures illustrate abstract information. For example, in the sentence “The politician builds a bridge to the next topic” (depicting an arch with the hand) abstract content is illustrated by a metaphoric gesture. However, the same gesture (depicting an arch with the hand) can be iconic when paired with the sentence “There is a bridge over the river,” as iconic gestures illustrate concrete physical features of the world.22 The processing of iconic and metaphoric gestures in healthy subjects has been related to the left STS (including MTG and STG),20,21 with the left IFG being additionally activated during metaphoric gesture processing.44
Patients with schizophrenia show difficulties in the understanding of figurative aspects of speech such as metaphors, proverbs, humor or abstract concepts,45,46 clinically termed concretism. It has been shown that severity of concretism in patients with schizophrenia is negatively correlated with activation in the left IFG during processing of metaphors.46 Previously the processing of concrete and abstract sentences accompanied by gestures has been compared in patients with schizophrenia.47 Intact integration processes were found for gestures in a concrete sentence context (iconic gestures), reflected by activation around the left STS. By contrast, patients demonstrated no activation increase for the integration of gesture meaning into an abstract sentence context (metaphoric gestures) in contrast to control conditions, a process that activated the left STS and the left IFG in healthy subjects.4,22,44 Thus, besides the assumption of a general dysfunction in gesture production and comprehension in patients with schizophrenia,7,13–15,48 these data suggest that integration processes related to abstract utterances accompanied by gestures are specifically impaired in schizophrenia.
Because disconnectivity of the left posterior STS might be the basis of dysfunctional processing of gestures in an abstract sentence context, we tested the hypothesis that patients with schizophrenia demonstrate a reduced functional connectivity of the left STS to the IFG for the processing of metaphoric gestures. A psychophysiological interaction (PPI) analysis based on a seed region identified in a previous analysis (located in an area around the left posterior STS)47 has been performed. A similar region of the temporal lobe has been previously reported to be structurally49 and functionally disconnected in schizophrenia42 or high risk populations50 and relevant for integration of speech and gesture.20,21 With this PPI analysis differences in connectivity between groups (patients vs controls) and conditions (gestures in a concrete [iconic, IC] vs abstract [metaphoric, MP] sentence context) have been disentangled.
Methods
Participants
Patients.
Sixteen patients (6 female) diagnosed with schizophrenia (F20; mean age = 38 years, range: 19–53 years) participated in this and in a previous study.47 Patients were recruited from and diagnosed by independent clinicians according to the Diagnostic and Statistical Manual of Mental Disorders, Fourth Edition (DSM-IV) criteria at the Department of Psychiatry, Psychotherapy and Psychosomatics, Medical School, RWTH Aachen University, Germany.
All participants were free of visual and auditory deficits, additional neurological and medical impairments as well as any cerebral abnormality, as assessed by a T1-weighted MRI. All patients reported that they were right handed,51 and German was their primary language. Symptom ratings in patients were recorded using the Positive and Negative Syndrome Scale (PANSS).52
Clinical Characteristics.
Patients were moderately ill with an average total PANSS score of 64 (SD = 19), with positive subscore of 16 (SD = 8), negative subscore of 16 (SD = 7) and general subscore of 32 (SD = 9). All patients were on stable doses of atypical antipsychotic medication (mean dose in Haloperidol equivalents = 9.62mg/day, SD = 4.26).53
Healthy Control Group.
Sixteen right-handed healthy male controls participated in this and previous studies,22,47 all native German speakers (mean age = 27.9 years, range: 19–47 years) with no impairments of vision or hearing. None of the participants had any medical, neurological or psychiatric illness, past or present.
The study was approved by the Ethics Committee of the RWTH Aachen University. All participants gave written informed consent and were paid 20 Euro for participation.
Stimulus Construction
The stimulus material consisted of video clips (each with a duration of 5 s) that presented a male actor performing different combinations of speech and gestures (for detailed description, see Straube et al22,47 and figure 1). The gestures in the iconic condition (IC) illustrated the form, size or movement of something concrete that was mentioned in the accompanying speech,1 whereas those in the metaphoric condition (MP) illustrated the form, size or movement of something abstract that was mentioned in the associated speech.1 An isolated gesture (G) and isolated sentence condition (S, visible speaking actor) were included to explore unimodal from bimodal speech/gesture effects at the neural level. Sentences used in this paradigm were easy to understand and conventional to ensure that comprehension is feasible in patients with schizophrenia.47
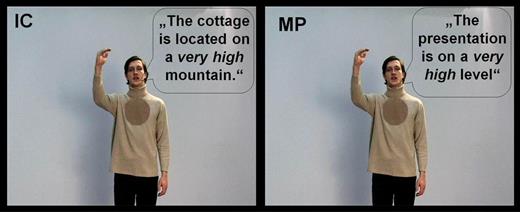
Examples of the experimental conditions.22,47
The stimulus material consisted of videos of an actor performing iconic (IC) and metaphoric (MP) coverbal gestures and corresponding concrete and abstract sentences, respectively. For illustrative purposes the spoken German sentences were translated into English and written in speech bubbles. Concrete sentences without gesture (S, visible speaking actor) and gestures without speech (G) were additionally presented.
Experimental Design
Thirty stimuli from each of the experimental conditions (see figure 1) were presented in a block design.22,47 Each block consisted of 5 videos of the same condition and was 25 seconds in length (5 videos × 5 s). In total, 6 blocks of each condition were presented in a pseudorandomized order and separated by a baseline condition (gray background with a fixation cross) with a duration of 15 seconds, during which the fixation cross shortly disappeared 2 times (about every 5 s). In total, each participant saw 120 video clips that lasted 17 minutes.
Subjects were instructed to watch the videos and to respond each time they saw a new picture appear (either the video or baseline fixation cross) by pressing a button with the left index finger (see Straube et al22,47). This was done to ensure that they paid attention during all conditions and baseline. This implicit encoding task was chosen to focus participants’ attention on the middle of the screen and it enabled us to investigate implicit speech and gesture processing. Presentation software (Version 9.2, 2005) was used for stimulus presentation and response measurement in the functional magnetic resonance imaging (fMRI) experiment.
fMRI Data Acquisition
MRI was performed on a 1.5T Philips scanner (Philips MRT Achieva series). Functional data were acquired with echo planar images in 31 transversal slices (repetition time [TR] = 2800ms; echo time [TE] = 50ms; flip angle = 90°; slice thickness = 3.5mm; interslice gap = 0.35mm; field of view = 240mm; voxel resolution = 3.75 × 3.75mm). Slices were positioned to achieve whole brain coverage. Three hundred and sixty volumes were acquired during the functional run. The experimental setup including the paradigm, scanner, and scanning parameters used in the current study was identical to the one previously published.22,47
Data Analysis
MR images were analyzed using standard routines for first and second level analyses in Statistical Parametric Mapping 8 (SPM8; www.fil.ion.ucl.ac.uk, accessed July 28, 2013) implemented in MATLAB 7 (Mathworks Inc). The first 5 volumes of each functional run were discarded from the analysis in order to minimize T1-saturation effects. To correct for different acquisition times, the signal measured in each slice was shifted relative to the acquisition time of the middle slice using a slice interpolation in time. All images of one session were realigned to the first image of a run to correct for head movement and normalized into standard stereotactic anatomical Montreal Neurological Institute (MNI) brain space by using the transformation matrix calculated from the first echo planar imaging (EPI) scan of each subject and the EPI template. Afterwards, the normalized data with a resliced voxel size of 4×4 × 4mm were smoothed with a 10mm full width at the half maximum isotropic Gaussian kernel to accommodate for intersubject variation in brain anatomy. A high-pass filter (128 s cut of period) was applied to remove low frequency fluctuations in the blood-oxygen-level-dependent (BOLD) signal.
For the regular analyses (see Straube et al47) the expected hemodynamic response at the onset of each block was modeled with a duration of 22 seconds by a canonical hemodynamic response function.47 The function was convolved with the block sequence in a general linear model, which also included the 6 movement nuisance regressors to account for movement during the scan interval. These previous analyses were used as basis to extract individual activation time courses of the left posterior STS and to build up the PPI analyses.
PPI Analyses of the Left STS Cluster
A PPI analysis was conducted to assess differences in neural connectivity of the area around the left STS (including parts of the MTG and STG) for groups and conditions. Standard routines of SPM8 as described in the corresponding manual were used to set up the PPI analysis. For this analysis we specified as seed region of interest (ROI) the STS cluster of 14 voxels resulting from the common activation for patients and control subjects for the processing of iconic coverbal gestures (see Straube et al47 and below). For the PPI analysis the block design described above and used previously to assess group differences in activation amplitude47 was employed on first level including the 2 conditions of interest (IC and MP) and the 2 isolated conditions (S and G). BOLD responses over time of all voxels within the ROI were extracted for each subject as cluster-eigenvariates. The volumes of interest created this way included each subject’s beta values in the STS over time. In the next step, those time courses were used to create the PPIs. For each condition, 1 PPI was calculated, resulting in 4 PPIs for each single subject. The new first-level model was then specified implementing the general activation change within the area around the STS over time and each PPI as regressors for the respective condition. To control for condition specific differences in amplitude and movement, the conditions and regressors of the previously defined block design (see above) were additionally included in the model. Baseline t-contrasts set up on the respective regressors (PPIs) were performed for each single condition to assess correlations in neural response with activity in the STS with respect to each single condition. On the group level, a random effects analysis (full factorial analysis) was conducted, using the corresponding contrast images from each participant and patient, in order to assess effects of condition and group on STS connectivity. Age, medication, intelligence quotient (IQ), and STS activation amplitude had no significant effect on the connectivity results (see Supplementary Data).
Seed Region
As seed region, we used the overlap in activation for patients and controls in response to the iconic gesture conditions (IC) contrasted to unimodal control conditions (speech, S; gesture, G; ([(P-IC>P-S ∩ P-IC>P-G) inclusively masked by P-S ∩ P-G] ∩ [(C-IC>C-S ∩ C-IC>C-G) inclusively masked by C-S ∩ C-G]; see Straube et al47); note that reaction times have not been used as covariate in the current analysis because it had only a minimal effect on t values and cluster sizes). Using this contrast (reflecting integration of the IC conditions), we found an overlap of conjunctional activation for patients and control subjects in a cluster located around the left posterior STS with 3 submaxima (MTG: MNIx,y,z = [−60, −56, 12], t = 1.96; MTG: MNIx,y,z = [−52, −56, 12], t = 1.97; STG: MNIx,y,z = [−56, −48, 16], t = 1.76; number of voxels = 14; P < .05).
To correct the fMRI results for multiple comparisons we employed a Monte-Carlo simulation of the brain volume to establish an appropriate voxel contiguity threshold.22,54 Assuming an individual voxel type I error of P < .05, a cluster extent of 17 contiguous resembled voxels was indicated as necessary to correct for multiple voxel comparisons at P < .05. We applied this cluster threshold to all reported analyses (this is the same procedure and threshold as previously applied to the identical paradigm in healthy subjects22 and patients with schizophrenia).47
The reported voxel coordinates of activation peaks are located in MNI space. The functional data were referenced to probabilistic cytoarchitectonic maps for the anatomical localization.55
Statistical analyses of data other than fMRI were performed using SPSS version 15.0 for Windows (SPSS Inc).
Contrasts of Interest
We computed particular contrasts of interest in order to test our hypotheses. First, we analysed common connectivity patterns across groups and conditions (C-IC ∩ C-MP ∩ P-IC ∩ P-MP) to detect similarities in functional connectivity between groups and conditions.
In a second step we performed interaction analyses of group by condition to test our hypothesis that patients and controls would differ in STS connectivity predominantly in the metaphoric gesture condition. Interaction analyses were calculated in both directions ([C-MP>C-IC]>[P-MP>P-IC] and [P-MP>P-IC]>[C-MP>C-IC]).
For additionally exploratory analyses and illustrations of the individual connectivity patterns for each group and condition see Supplementary Data.
Results
For the processing of iconic as well as metaphoric gestures in both patients and control subjects ([C-IC ∩ C-MP ∩ P-IC ∩ P-MP]; seefigure 2) we found the left IFG (p. Orbitalis; MNIx,y,z = [−48, 24, −4], t = 2.59, number of voxels = 32; P < .05 corrected) and MTG (MNIx,y,z = [−56, −56, 12], t = 4.66, number of voxels = 52; P < .05 corrected) commonly connected to the seed region (STS). Connectivity to the left IFG was negatively correlated to positive symptoms (PANSS pos. scale; Spearmans’ rho = −0.487, P < .032, 1-tailed), suggesting increasing STS-IFG connectivity in patients goes along with a reduction in positive symptom scores. We did not find connectivity correlations for PANSS negative or general subscores.
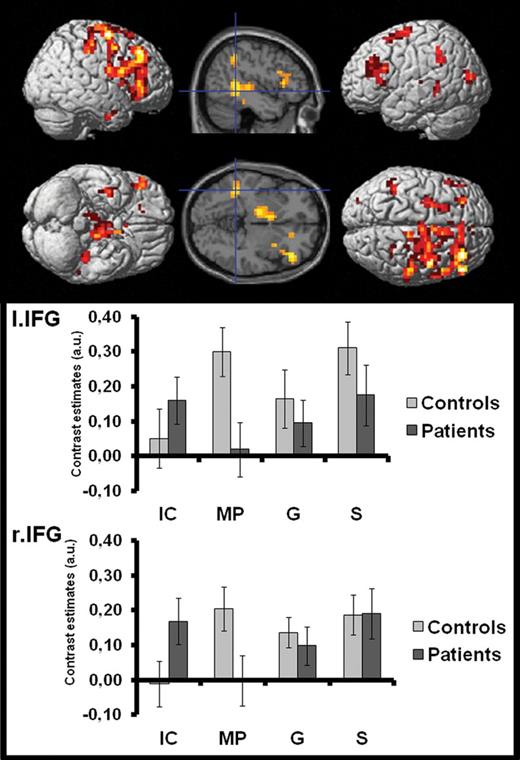
For the interaction of group and condition ((C-MP>C-IC)>(P-MP>P-IC)) we obtained a widespread network of regions including the bilateral frontal, parietal, and left temporal structures as well as the anterior cingulate cortex and subcortical regions (see figure 3 and table 1). Bar graphs in figure 3 indicate that healthy controls but not patients demonstrate an increased connectivity to the left STS in these regions for the processing of metaphoric in contrast to iconic gestures. The opposite interaction contrast ((P-MP>P-IC)>(C-MP>C-IC)) revealed activity in the bilateral lingual gyrus (MNIx,y,z = [−8, −60, −4], t = 3.12, 77 voxels) the right hippocampus (MNIx,y,z = [16, −12, −16], t = 3.21, 52 voxels), the right inferior temporal gyrus (MNIx,y,z = [36, 0, −12], t = 2.30, 20 voxels), the left middle orbitofrontal gyrus (MNIx,y,z = [−32, 44, −12], t = 3.26, 17 voxels), and the left precuneus (MNIx,y,z = [0, −56, 32], t = 2.55, 60 voxels; all P < .05 corrected), indicating increased connectivity in these regions for patients for the processing of metaphoric gestures.
Interaction of Group (C>P) and Gesture Condition (MP>IC)
| Anatomical Region | Cluster Extent | Coordinates | t Value | P Value | Number of Voxels | ||
|---|---|---|---|---|---|---|---|
| x | y | z | |||||
| Right MFG | Right SFG, IFG pars Tri. | 36 | 36 | 40 | 3.77 | <.001 | 691 |
| Right precentral gyrus, SFG, MFG | 36 | −8 | 64 | 3.19 | .001 | ||
| Right SFG, MCC | 12 | 32 | 44 | 3.19 | .001 | ||
| Left parahippocampal gyrus | Left cerebellum, HC | −8 | −20 | −28 | 3.62 | <.001 | 339 |
| Right cerebellum, lingual gyrus | 12 | −36 | −16 | 3.13 | .001 | ||
| Left MTG, STS, HC | −40 | −44 | 4 | 3.01 | .002 | ||
| Right ACC | Left ACC; right nucleus caudatus | 8 | 24 | 20 | 3.72 | <.001 | 221 |
| Left thalamus, pallidum, HC | −12 | −12 | 0 | 3.30 | .001 | ||
| Bilateral nucleus caudatus; left pallidum | 0 | 4 | 8 | 2.62 | .005 | ||
| Left MFG | Left IFG pars Tri., SFG | −28 | 32 | 28 | 2.93 | .002 | 122 |
| Left IFG pars Oper./Tri., precentral gyrus | −32 | 8 | 24 | 2.72 | .004 | ||
| Left IFG pars Tri./Oper., insula | −44 | 24 | 8 | 2.59 | .005 | ||
| Left middle occipital gyrus | Left calcarine gyrus, MTG | −32 | −80 | 12 | 3.13 | .001 | 58 |
| Left middle Occ. gyr., angular gyr., MTG | −32 | −64 | 20 | 2.69 | .004 | ||
| Right thalamus | Right insula, Heschls gyrus | 28 | −24 | 12 | 2.78 | .003 | 50 |
| Right precuneus, PCC, HC | 20 | −40 | 16 | 2.60 | .005 | ||
| Left SFG | Left MFG, precentral gyrus | −28 | −4 | 68 | 2.44 | .008 | 45 |
| Left MFG, SFG, SMA | −24 | 12 | 60 | 2.22 | .014 | ||
| Left IPL | Left postcentral gyrus, angular gyrus | −40 | −44 | 44 | 2.33 | .011 | 35 |
| Left IPL, supramarginal gyrus, angular gyrus | −52 | −48 | 36 | 2.24 | .014 | ||
| Right precuneus | Right postcentral gyrus, IPL | 20 | −48 | 48 | 2.63 | .005 | 26 |
| Right postcentral/precentral gyrus, SMA | 24 | −32 | 56 | 1.99 | .024 | ||
| Right MCC, paracentral lobe, precuneus | 12 | −40 | 48 | 1.77 | .039 | ||
| Left SFG | Left SFG; Right ACC | −4 | 48 | 28 | 2.11 | .018 | 24 |
| Right ACC, MCC, SFG | 8 | 44 | 28 | 2.07 | .020 | ||
| Left MFG, SFG | −20 | 40 | 20 | 1.82 | .035 | ||
| Right paracentral lobe | Right postcentral/precentral gyrus | 12 | −28 | 64 | 2.80 | .003 | 21 |
| Left HC | Left thalamus, PCC | −20 | −36 | 12 | 2.39 | .009 | 20 |
| Right ITG | Right fusiform gyrus, temporal pole | 40 | −4 | −36 | 3.80 | <.001 | 19 |
Note: ACC, anterior cingulate cortex; HC, hippocampus; IFG, inferior frontal gyrus; IPL, superior parietal lobe; ITG, inferior temporal gyrus; MCC, middle cingulate cortex; MFG, middle frontal gyrus; MTG, middle temporal gyrus; Pars Orb., Pars orbitalis; Pars Tri., Pars triangularis; PCC, posterior cingulate gyrus; Rol. OP, Rolandic operculum; SMA, supplemental motor area; SFG, superior frontal gyrus; SPL, superior parietal lobe; STG, superior temporal gyrus.
Coordinates (in Montreal Neurological Institute (MNI) space), cluster extent and t values of the interaction of group by condition.
Cluster level corrected at P < .05.
Discussion
Interpersonal communication and especially speech-gesture interactions have been increasingly investigated in patients with schizophrenia.9–13,15,48,56–58 Despite the available data suggesting that patients have deficits in the comprehension of communicative gestures7,9,15 as well as in the understanding of abstract sentences (“concretism”),46,59,60 the neural mechanisms underlying these dysfunctions are yet unknown. Here we showed that patients demonstrate a specific functional disconnectivity of the left STS and the IFG bilaterally during the processing of metaphoric gestures. This disconnectivity might be the basis of dysfunctional integration of gesture information into an abstract sentence context and thus an underlying reason for interpersonal communication problems in patients.
The left posterior STS is an important multimodal integration site61,62 relevant for the integration of speech and gesture information.20–23,44,63 Dysfunctional visual64 and multisensory integration in patients with schizophrenia has already been reported.24,25 Previously however, we found that the area around the left STS in patients with schizophrenia was activated to the same extent as in healthy control subjects when iconic coverbal gestures were contrasted to unimodal control conditions (speech only, gesture only).47 For the integration of metaphoric gestures it is important to build an abstract relation between concrete visual and abstract verbal information. For building this relation, additional online integration or unification processes in distantly located regions of the brain seem to be relevant.22,44,47 In line with the disconnectivity hypotheses of schizophrenia, we found a functional disconnectivity of the left posterior STS to the prefrontal cortex as potential basis for the aberrant processing of gestures in an abstract sentence context.
Considering the reported dysfunctions in gesture production and gesture imitation (eg, Matthews et al10 and Park et al12), it is justified to assume a common basis/etiology of impairments in gesture perception and production. This assumption is also in line with the “mirror neuron theory”65 that assumes the same neural basis for action execution and action perception/understanding. Thus, dysfunctional processing and understanding of gestures might be related to a gesture production deficit in general or could even be a direct result of impaired imitation learning in patients during development.10
In our study we found a positive connectivity of the left STS to the left IFG and left MTG for both groups and for gestures accompanying concrete as well as abstract utterances (see figure 2), indicating basically intact connectivity in patients with schizophrenia between the most relevant language regions. This is in line with the finding that patients generally understood the verbal utterances (for behavioral data see Straube et al47 and Supplementary Data), but differentially processed the gestures in abstract sentence context.47
However, despite these communalities we found a decrease of connectivity for the processing of metaphoric gestures in a widespread network of regions including bilateral frontal, parietal, and left temporal structures in patients compared with controls (see figure 3). The data of the healthy control group suggest that a high connectivity between these regions and the left STS is important for the integration of gestures in an abstract sentence context. In particular, the left STS is part of Wernicke’s and the left IFG part of Broca’s language areas, which are predominantly connected through the arcuate fasciculus (eg, Abdul-Rahman et al30, Bernal et al66, and Douaud et al67). In schizophrenia abnormalities in these structural connections have been reported,30,31,33,67–70 which might be the basis of impairments in functional connectivity between frontal and temporal brain regions.37,71 Thus, patients with schizophrenia fail to use these distributed brain resources appropriately for the processing of metaphoric coverbal gestures. In addition to the hypothesized disconnectivity between left STS and IFG regions, we found the most prominent group differences in connectivity between the left STS and regions of the right frontal cortex. Activity of the right IFG in healthy subjects has been reported for the processing of unrelated speech and gesture information.4 Thus, in healthy subjects the right hemisphere might contribute to the integration processes of the left STS by helping to interpret concrete gesture information in an abstract way. Therefore, our finding of a reduced connectivity between the left STS and the right frontal cortex is in line with the hypothesis that the core deficit in psychosis is a failure in an adequate utilization of right and left hemispheric functions72 in a context dependent manner.
In addition to these findings, we also observed increased connectivity between the STS and the bilateral lingual gyrus, the right hippocampus, the right inferior temporal gyrus, the left middle orbitofrontal gyrus, and the precuneus in patients for the processing of metaphoric gestures. Whereas most studies have found reduced connectivity in schizophrenia,73,74 other demonstrated increased connectivity75,76 or a rather mixed pattern of increased and decreased connections.77 Increased connectivity in our study might suggest compensation mechanisms or the application of different processing strategies (eg, memory retrieval reflected in hippocampal activity). However, further research is necessary to understand task and region specific aberrant connectivity of patients with schizophrenia.
This study has to be interpreted in light of some limitations. First, the sample of patients was relatively ill and findings might not be generalizable to a more remitted sample. Second, the study was focused on specific gesture types suitable for the current research question. However, other gesture types such as deictic or beat gestures might also be impaired in patients with schizophrenia. Third, due to our specific paradigm it is difficult to infer whether patients have in fact problems with gesture integration or rather with the processing of an abstract context itself. However, results of the gesture only condition indicate already a reduced connectivity for the processing of gestures alone (see bar graphs figures 2 and 3). This disconnectivity seems to be increased for the processing of gestures in the abstract sentence context and reduced for the processing of gestures in the concrete sentence context (Supplementary Data), supporting the interaction of speech and gesture processing in the current experiment. Finally, several other factors, such as negative symptoms,10 age,78 IQ or working memory,10 might influence gesture perception and production. Therefore future studies should investigate more specifically the role of those other sources of variance relevant for speech-gesture integration performance and STS connectivity in patients with schizophrenia.
Common positive connectivity for patients and controls across gesture conditions. Commonalties in STS connectivity between patients and controls across gesture conditions (C-IC ∩ C-MP ∩ P-IC ∩ P-MP). IC, iconic gesture condition; MP, metaphoric gesture condition; G, gesture only; S, speech only (no gesture, but visible speaking actor).
For the first time, this study investigated the connectivity of the posterior STS in patients with schizophrenia while processing illustrative and elaborative gestures that differed in their relation to speech. Our data indicate a reduced connectivity in patients, between brain regions normally involved in the processing of gestures in an abstract sentence context. It seems that processes (such as in perceptual matching)47 that require the connection of brain regions in close proximity are intact in patients, whereas processes relying on the interplay of more distant regions (as here observed for understanding higher order relations)47 are disturbed most dramatically. Thus, the disconnectivity between STS and IFG might be the basis of dysfunctional integration of metaphoric coverbal gestures and related interpersonal communication problems in patients with schizophrenia.
Funding
Interdisciplinary Center for Clinical Research “IZKF BIOMAT,” Aachen, Germany (IZKF VV N68); the German Research Foundation (DFG: Ki 588/6-1); von Behring-Röntgen-Stiftung (project no. 59-0002). B.S. is supported by the German Federal Ministry of Education and Research (BMBF; project no. 01GV0615).
Acknowledgments
The data were collected in Aachen (K.S., A.G., and B.S.), and data analyses and manuscript writing were performed in Marburg (T.K. and B.S.). The authors have declared that there are no conflicts of interest in relation to the subject of this study.
References
