


Background: Studies on adult population indicate shorter sleep duration in ethnic minority groups than host populations. We examined ethnic differences in sleep duration and its relationship with overweight and blood pressure (BP) among children living in Amsterdam. Methods: Participants include 2384 children (aged 5 years) and their mothers from the Amsterdam-based longitudinal study. Sleep was categorised into short sleep (<10 h/night) and normal sleep (10–11 h/night). Linear regressions (β) were used to study association between sleep duration and systolic BP (SBP) and diastolic BP (DBP). Prevalence ratios (PRs) were used to study ethnic differences in sleep duration and its association with overweight and raised BP. Results: Minority groups reported shorter sleep duration compared to native Dutch, with prevalence ranging from 11.3% in Dutch to 53.1% in Ghanaians. Age-adjusted PRs ranged from 3.38 (95%CI 2.63–4.34) in Moroccans to 4.78 (95%CI 3.36–6.82) in Ghanaian compared with Dutch children. Increased prevalence of overweight was observed among children with short sleep in Dutch and Moroccans only, but this risk was no longer statistically significant after further adjustment for socioeconomic status. Short sleep was not related to SBP and DBP in all groups. No relationship was observed between short sleep and raised BP except for African Surinamese (3.65, 95% CI 1.23–10.8). Conclusion: Like adults, children from ethnic minority populations sleep less hours than Dutch children. Efforts to improve ethnic inequalities in sleep hygiene should also include children at younger age. Associations as reported in adults with overweight and BP could not consistently be replicated in children, however.
Introduction
A wide range of studies on sleep duration among adults from various ethnic minority groups have been conducted in many countries with results showing that ethnic minority groups have short sleep duration compared to their host populations.1–3 Studies on sleep duration among children of various ethnic groups show mixed results, however. For instance, it has been reported that ethnic minority children (African American, Asian, Native American, Hispanic and biracial) sleep less than nonminority children (White or European American),4 whereas, Biggs et al.5 reported there was no significant difference in sleep duration between Southeast Asian and Europeans in a study conducted in Australia. Another cross-country comparative study,6,7 alongside other studies, indicated that children from Asia have shorter sleep duration than their American and European counterparts.8–15 A recent study in Netherlands showed that migrant children sleep less than their Dutch counterparts.16 Unfortunately, this study did not clearly take into account the children with African background (such as African Surinamese and Ghanaians), and did not explore the association of sleep with blood pressure (BP) among the ethnic groups probably due to lack of data.
Sleep duration may contribute to increase in the prevalence of chronic health conditions in both children and adult populations.17–19 Previous studies have shown that short sleep duration was independently associated with increased overweight/obesity in children and adolescents.20–23 A recent study also indicated that short sleep duration was associated with overweight and obesity in migrant children, compared with European Dutch.24 However, this study did not clearly explore observations among children with African background such as the African Surinamese and Ghanaians. Studies in children have demonstrated that sleep duration was related to BP, but these studies also show inconsistent results, e.g. whereas some studies reported that short sleep duration was related to high BP,25 another study found that short and long sleep durations were related with high BP.19 However, one study found no significance difference in the relationship between sleep duration and BP.26
The purpose of this study was to examine self-reported sleep duration among 5 years old children in a multi-ethnic population in the Netherlands, using the Amsterdam Born Child and their Development study (ABCD), a Dutch-population-based study. In addition, we assessed the relationship between sleep duration and overweight, and BP among these children.
Study population and methods
Study population
The main goal of the ABCD study is to examine and determine factors in early life (during pregnancy and infancy) that might explain the later health of the child with specific attention paid to ethnic inequalities. Approval was obtained from the Academic Medical Center Medical Ethical Committee, the Vrije Universiteit Medical Center Medical Committee and the Registration Committee of Amsterdam. All participating mothers gave written informed consent for themselves and their children.
The design and rationale of the ABCD study have been described previously.27 In brief, between January 2003 and March 2004, 8266 pregnant women were included in the study after their first antenatal visit to an obstetric caregiver (phase 1). Of these respondents, 7863 women gave birth to a viable singleton infant and 6575 women gave permission to collect information obtained from the Youth Health Care (phase 2). Phase 3 of the study started in the summer of 2008. Around 2 weeks after their ABCD-child’s fifth birthday, 6161 mothers who initially gave permission for follow-up (93.7% of 6575) were sent a questionnaire (in Dutch, English or Turkish) in which they were also asked for permission on participation of their child in the physical examination. The questionnaire, returned by 4488 mothers, provided information on their child’s health, development and behaviour. Various physical measurements, including height, bodyweight and BP, were made in 3321 children. Reasons for lack of follow-up included withdrawal from the study, infant or maternal death, and loss to follow-up due to unknown address or emigration.
This study includes 2986 participants who completed the questionnaire, including singleton children (aged 5 years) from the main ethnic groups living in the Netherlands: Dutch, Turkish, Moroccan, African Surinamese and Ghanaian, in which the 5-year questionnaire and physical examination were completed. Ethnicity of the child was based on the country of birth of the child’s mother and her mother (self-reported). Because of heterogeneity among the Western and non-Western minority groups, they were excluded from the study (n = 602), leaving a total of 2384 participants (2025 Dutch, 142 Moroccans, 92 Turkish, 93 African Surinamese and 32 Ghanaians).
Measurements
Sleep
The mothers were asked to estimate their children's average night sleep duration on school days and during weekends. Sleep duration was assessed using the item: ‘How many hours does the child sleep on average per night on school days and during weekends?’ Although sleep duration did not differ significantly between school days or during the weekend, we calculated the average sleep duration by taking five times the average school day sleep duration plus two times the weekend sleep duration and then divided by seven. Sleep duration was categorised using the most recent sleep guide from National Sleep Foundation.28 For children 3–5 years, 10–11 h sleep per night is recommended as normal. Short sleep was defined as having <10 h of sleep per night.
BP and overweight
BP (systolic and diastolic) was measured with Omron 705 IT (Omron Healthcare Inc, Bannockburn, IL, USA) with its appropriate cuff size (arm circumference 17–22 cm). First, a test measure was made (to comfort/relax) the child followed by a 10-min rest period. Then, BP was measured twice on the right arm in sitting position, with the arm supported at heart level. These two measurements were considered valid if they did not differ by more than 10 mmHg, otherwise a third measurement was made. Systolic BP (SBP) and diastolic BP (DBP) were calculated by taking the mean value of the two valid measures. Raised BP (hypertension and prehypertension: SBP or DBP > 90th percentile or both) was based on sex, age and height specific-percentiles.29 To calculate body mass index (BMI), height was measured to the nearest millimetre using a Leicester portable height measure (Seca), and weight to the nearest 100 g using a Marsden weighing scale, (model MS-4102). Overweight was defined based on pooled international data for BMI and linked to the widely used adult obesity cut off of 30 kg/m2 as proposed by Cole et al.30
Information on educational level of the mothers—years of education after primary school (continuous)—was obtained from the pregnancy questionnaire. Sedentary time (computer and television) hours per day was obtained from the 5-year questionnaire.
Data analysis
Baseline data were calculated in percentages and means with their 95% confidence interval. Chi-square test and ANOVA were used to calculate differences in categorical and continuous variables. Comparisons of differences in sleep duration among ethnic groups and the association between sleep duration and overweight and raised BP were made using prevalence ratios (PRs). Linear regressions (β) were used to examine the association between sleep duration and BP, respectively, adjusting for potential confounders known to influence sleep duration, overweight and BP including age, gender, socioeconomic status (education) and height.19 All analyses were performed using STATA 11.0 (Stata Corp, Station, TX). A P values of <0.05 was considered as statistically significant.
Results
Characteristics of study population
Table 1 shows the characteristics of study population by ethnicity. Dutch children were on average, younger, weigh more at birth and have lower BMI, SBP and DBP, and were less frequently overweight than the children of the ethnic minority groups. Turkish and Moroccan mothers were youngest, and Turkish had the lowest level of education compared to the other ethnic groups. Ethnic minority groups spent more hours on sedentary activities compared to the Dutch.
Characteristics of study population by ethnicity
| Dutch | Turkish | Moroccan | African-Surinamese | Ghanaian | |
|---|---|---|---|---|---|
| Child | n = 2025 | n = 92 | n = 142 | n = 93 | n = 32 |
| Age (years) | 5.7 (5.6–5.7) | 5.8 (5.7–5.9) | 5.9 (5.9–6.0) | 5.8 (5.7–5.9) | 5.9 (5.7–6.1) |
| Height (cm) | 116.5 (116.3–116.8) | 116.2 (115.3–117.2) | 117.3 (116.2–118.3) | 118.8 (117.6–120.0) | 120.3 (118.3–122.4) |
| Birth weight (kg) | 3.5 (3.4–3.5) | 3.4 (3.3–3.4) | 3.3 (3.3–3.4) | 3.3 (3.2–3.4) | 3.4 (3.1–3.5) |
| Child weight (kg) | 20.9 (20.8–21.0) | 22.2 (21.4–22.9) | 22.7 (22.1–23.4) | 22.6 (21.8–23.4) | 24.4 (22.6–26.3) |
| Mean sleep duration (hrs) | 10.7 (10.6–10.7) | 10.0 (9.82–10.2) | 10.1 (9.87–10.3) | 10.0 (9.78–10.3) | 9.8 (9.45–10.1) |
| Short sleep <10 hrs/night | 11.3 (9.93–12.7) | 38.0 (28.1–48.0) | 37.3 (29.3–45.3) | 37.6 (27.7–47.5) | 53.1 (35.5–70.7) |
| BMI (kg/m2) | 15.3 (15.3–15.4) | 16.3 (15.9–16.8) | 16.4 (16.1–16.7) | 15.9 (15.6–16.3) | 16.7 (15.8-17.6) |
| Overweight (kg/m2) | 6.37 (5.31–7.43) | 25.00 (16.1–33.9) | 24.7 (17.5–31.8) | 18.3 (10.4–26.2) | 31.3 (14.9–47.6) |
| SBP mm/Hg | 98.9 (98.6–99.2) | 101.5 (99.7–103.2) | 100.9 (99.5–102.5) | 100.0 (98.7–101.4) | 104.3 (101.3–107.3) |
| DBP m/Hg | 56.6 (56.3–56.8) | 58.8 (57.4–60.2) | 59.3 (57.9–60.6) | 59.7 (58.2–61.1) | 63.1 (60.8–65.4) |
| Hypertension (%) | 5.46 (4.46–6.46) | 11.4 (4.69–18.0) | 12.9 (7.35–18.6) | 5.56 (1.00–10.3) | 12.5 (1.00–24.2) |
| Raised BP (%) | 10.9 (9.59–12.4) | 16.9 (9.03–24.7) | 18.0 (11.6–24.4) | 13.3 (6.27–20.4) | 25.0 (9.75–40.3) |
| Sedentary time (hours) | 1.2 (1.1–1.2) | 2.4 (2.1–2.6) | 2.4 (2.3–2.6) | 2.6 (2.3–2.9) | 2.7 (2.2–3.2) |
| Sedendary categories | |||||
| >2 h/day | 12.7 (11.2–14.1) | 52.2 (41.9–62.4) | 59.2 (51.0–67.3) | 60.2 (50.2–70.2) | 62.5 (45.5–79.6) |
| 1-2 h/day | 44.5 (42.4–46.7) | 40.2 (30.1–50.3) | 35.2 (27.3–43.1) | 26.9 (17.8–35.9) | 34.4 (17.7–51.1) |
| <1 h/day | 42.8 (40.6–44.9) | 7.61 (2.16–13.1) | 5.63 (1.83–9.44) | 12.9 (6.05–19.8) | 3.13 (3.00–9.25) |
| Maternal age (yrs) | 32.8 (32.6–32.9) | 27.2 (25.9–28.5) | 27.8 (26.9–28.6) | 29.6 (28.3–30.9) | 29.2 (27.3–31.1) |
| Education (yrs) | 10.7 (10.6–10.9) | 4.6 (3.9–5.3) | 5.4 (4.8–6.1) | 7.9 (7.2–8.6) | 5.1 (3.9–6.2) |
BMI, body mass index; BP, Blood pressure. Data are presented as mean and percentages with 95% confidence interval (CI).
Sleep duration
All ethnic minority groups had significantly lower mean sleep duration compared to the Dutch, with the Ghanaians having the lowest mean sleep duration (9.8 h) compared with (10.7 h) in Dutch (Table 1).
Short sleep
The prevalence of short sleep was lower in the Dutch compared to all ethnic minority groups. Table 2 shows that these ethnic differences were significant after adjusting for age, gender, and education with PRs ranging from 2.37 (95% CI, 1.68–3.35) in Turkish to 3.56 (95% CI, 2.44–5.19) in Ghanaian compared with Dutch children.
Prevalence ratio(s) for short sleep among children at 5 years compared with the Dutch
| Dutch | Turkey | Moroccan | African Surinamese | Ghanaian | |
|---|---|---|---|---|---|
| PR (95%CI) | PR (95%CI) | PR (95%CI) | PR (95%CI) | PR (95%CI) | |
| n = 2025 | n = 92 | n = 142 | n = 93 | n = 32 | |
| Short sleep (<10 h/night)a | |||||
| Crude | 1.00 | 3.36 (2.52–4.49)* | 3.30 (2.58–4.22)* | 3.33 (2.49–4.44)* | 4.69 (3.32–6.65)* |
| Model 1 | 1.00 | 3.40 (2.55–4.54)* | 3.38 (2.63–4.34)* | 3.37 (2.52–4.51)* | 4.78 (3.36–6.82)* |
| Model 2 | 1.00 | 3.39 (2.54–4.55)* | 3.37 (2.62–4.33)* | 3.38 (2.53–4.52)* | 4.81 (3.37–6.85)* |
| Model 3 | 1.00 | 2.37 (1.68–3.35)* | 2.47 (1.82–3.34)* | 2.79 (2.05–3.81)* | 3.56 (2.44–5.19)* |
PR, prevalence ratio(s); *, P values (p)
a: Model 1: Adjusted for age, model 2: adjusted for age and gender, model 3: adjusted for age, gender and education.
P < 0.001.
P < 0.05.
Association between sleep duration and BP, and overweight
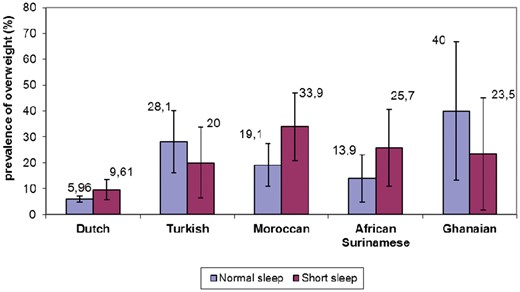
Association between sleep duration and overweight amoung ethnic groups at 5 years in Amsterdam
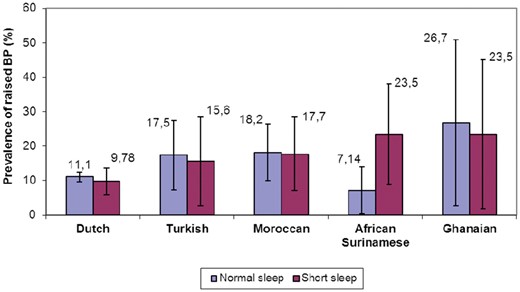
Association between between sleep duration and raised BP amoung children at 5 years in Amsterdam
Relationship between sleep duration and SBP and DBP, raised BP and overweight among children at 5 years
| Dutch | Turkey | Moroccan | African Surinamese | Ghanaian | |
|---|---|---|---|---|---|
| β (95%CI) | β (95%CI) | β (95%CI) | β (95%CI) | β (95%CI) | |
| n = 2025 | n = 92 | n = 142 | n = 93 | n = 32 | |
| SBP | |||||
| Short sleep (<10 h/night) | |||||
| Model 1 | 0.162 (−0.808, 1.132) | −0.395 (−4.036, 3.247) | 0.736 (−2.439, 3.911) | 1.801 (−0.985, 4.588) | 0.889 (−5.822, 7.600) |
| Model 2 | 0.074 (−0.897, 1.045) | −0.348 (−4.083, 3.388) | 0.429 (−2.776, 3.633) | 1.956 (−0.874, 4.786) | −0.100 (−7.186, 6.985) |
| DBP | |||||
| Short sleep (<10 h/night) | |||||
| Model 1 | −0.160 (−0.947, 0.626) | −0.913 (−3.894, 2.068) | −1.505 (−4.188, 1.179) | 0.619, (−2.301, 3.540) | 1.665 (−3.465, 6.795) |
| Model 2 | −0.292 (−1.077, 0.494) | −0.813 (−3.870, 2.244) | −1.593 (−4.313, 1.128) | 0.772 (−2.210, 3.754) | 0.360 (−4.597, 5.318) |
| Raised BP | PR (95%CI) | PR (95%CI) | PR (95%CI) | PR (95%CI) | PR (95%CI) |
| Short sleep (<10 h/night) | |||||
| Unadjusted | 0.88 (0.58–1.34) | 0.89 (0.33–2.39) | 0.97 (0.46–2.04) | 3.29 (1.07–10.2)** | 0.88 (0.26–2.99) |
| Model 1 | 0.87 (0.57–1.32) | 0.90 (0.33–2.48) | 0.98 (0.46–2.09) | 3.65 (1.23–10.8)** | 0.63 (0.17–2.35) |
| Overweight | |||||
| Short sleep (<10 h/night) | |||||
| Crude | 1.61 (1.04–2.49)** | 0.71 (0.33–1.56) | 1.78 (1.01–3.15)** | 1.86 (0.79–4.40) | 0.59 (0.20–1.72) |
| Model 1 | 1.49 (0.97–2.29) | 0.72 (0.31–1.66) | 1.69 (0.95–3.05) | 1.89 (0.79–4.53) | 0.47 (0.14–1.98) |
β, regression coefficient, PR: prevalence ratio(s), CI: confidence interval. For SBP and DBP, Model 1: adjusted for age and gender, Model 2: adjusted for age, gender, height, and education. For raised BP, Model 1: adjusted for education; *, P values (p).
P < 0.05.
Although the focus of our study was on the various ethnic groups, however, when all ethnic minority groups were combined as one group, the results of the analysis essentially remain the same with ethnic minority children having a higher odds of shorter sleep duration than native Dutch even after adjustment for potential confounders (PR 2.64, 2.08–3.35). There was no significant relationship between sleep duration and mean BP and raised BP, and overweight in all groups.
Discussion
Key findings
The current study examined ethnic differences in sleep duration and its relationship with overweight and BP among children from various ethnic groups living in Amsterdam. The result of our study showed that ethnic minority children were more likely than Dutch children to report short sleep. With a few exceptions, short sleep was not associated with overweight or BP in any of the ethnic groups.
Discussion of key findings
The result of our study demonstrated that ethnic minority children sleep less than their Dutch counterparts. Our finding is consistent with a recent study in Netherlands that showed that migrant children sleep less than their Dutch counterparts.16 Our finding is also in line with other previous studies, which showed that ethnic minority children from African American, Asian, Native American, Hispanic and biracial origins sleep less than White American children.4,8–15,31 The reason for the higher prevalence of short sleep observed in ethnic minority children is less clear, but may be due to socio-cultural and environmental factors that may differ among various ethnic groups. Culture, beliefs and attitudes of adult parents towards sleep may be transferred to their children and this can affect attitudes and practices surrounding their sleep behaviour.31,32 Factors such as bedtime routines, co-habitation (number of older children sleeping in the same room) and sedentary activities before bedtime may influence ethnic differences in sleep duration in children. For instance, previous study has shown that communal sleeping habits are more common among African Surinamese, and higher rates of bed sharing has been reported among Turkish and Moroccans.33,34 Previous studies indicated that increased sedentary activities (TV and computer screen time) predict short sleep duration.35 Our data show that a higher proportion of the ethnic minority groups spent more than 2 h on sedentary activities and this may contribute to their higher prevalence of short sleep compared to the Dutch. In addition, other studies suggest that ethnic minority parents were more likely to be short sleepers because they usually do shift work, and sometimes, multiple jobs, with little time left to sleep.1,8 It is likely that parents were not able to enforce early bedtime schedules in their children because they arrive late from work. On the other hand, in a Dutch-based study that compares sleep habits of children from the USA and China, Dutch children had lower scores for bedtime resistance, sleep anxiety, night awakening and sleep disordered breathing.7 This indicate a favourable sleep patterns, which may differ from ethnic minority children, and may explain the observed longer sleep duration in the Dutch. Another possible explanation for the observed longer sleep duration in the Dutch can be attributed to the Dutch tradition of the three ‘R's’ concept: Rust (rest), Reinheid (cleanliness) and Regelmaat (regularity).36 These basic concepts lay much emphasis on rest and regularity and seem to drive a healthy sleep pattern in young Dutch children.
Short sleep has been shown to be related to overweight in children.20–24 The potential mechanisms linking short sleep and overweight has been proposed in several studies including energy balance,37 time available to eat/timing of meals38 and increased intake of high-calorie foods,39 which could eventually induce overweight. In our present study, short sleep was associated with overweight, but only in Dutch and Moroccan children. The differences in our study, however, were mainly due to SES differences suggesting SES may influence the aforementioned mechanisms. By contrast, we observed no associations in Turkish, African Surinamese and Ghanaian children. The lack of association in other ethnic groups is unclear, but might be due to inadequate sample size to attain statistical power. Further studies should explore possible factors that may be responsible for lack of association between short sleep and overweight in ethnic minority groups.
With respect to potential relationship between sleep duration and BP, in general, we did not find a significant association between sleep duration and BP in any of the ethnic groups. Our finding is consistent with a previous study which showed no significant association between sleep duration and BP in Gujarati Indian adolescents.26 On the other hand, our finding is in contrast with a previous study which focused on children aged 6–11 years.25 Our finding also contrasts well with another Japanese study, which demonstrated that short and long sleep duration were associated with higher levels of BP.19 Though our study population's age was similar to the Japanese study, demographic, environmental, genetic and other unmeasured factors may account for the differences in obtained results in both studies. The reason for a lack of association between sleep duration and BP in our study is not fully understood. It may be due to the fact that we observed no association between sleep duration and overweight. It may also be due to differences in study population (previous study focused on older children (6–11 years),25 whereas the children in our study were younger (5 years), probably it may be too early for the effect of high BMI and short sleep duration to clearly manifest on BP.
The results of our study need to be interpreted in light of a few limitations. Information on sleep duration was based on self-report, and therefore prone to reporting bias; hence parents may have underestimated or overestimated sleep duration. Also the measurement of BP in children is often difficult and may give unexpected false readings as children often find it difficult to relax during measurement. Due to small numbers, we were not able to stratify the analysis by gender.
In conclusion, like adults, also children from ethnic minority populations sleep less hours than children from Dutch origin. Measures to improve ethnic inequalities in sleep hygiene should therefore also include children at younger age. Associations as reported in adults with overweight and BP could not consistently be replicated in these young children, however.
Acknowledgements
The authors thank all participating mothers and their children for their time and involvement, and are grateful to all obstetric care providers, Youth Health Care (YHC) centres and primary schools for assisting in the implementation of the ABCD study. This study was financially supported by the Netherlands Organization for Health Research and Development (ZonMW, TOP grant:40-00812-98-11010). The funders had no role in study design, data collection and analysis, decision to publish, or preparation of the manuscript.
Funding
This work was supported by the Netherlands Organization for Health Research and Development (ZonMW, TOP grant:40-00812-98-11010).
Conflicts of interest: None declared.
Key points
Ethnic minority children were more likely than Dutch children to report short sleep.
With a few exceptions, short sleep was not associated with overweight or BP in any of the ethnic groups.
Socioeconomic status (education) mediates the association between short sleep and overweight in Dutch and Moroccans
Measures to improve ethnic inequalities in sleep hygiene should therefore also include children at younger age.
Supplementary data
Supplementary data are available at EURPUB online.
References

Comments