


Abstract
Longitudinal surveys provide valuable data for tracking change in a cohort of individuals over time. Respondents are often asked to provide similar, if not the same, data at multiple time points. One could argue that this unnecessarily increases respondent burden, especially for information that does not change frequently. One way to reduce burden while still capturing up-to-date information may be to implement dependent interviewing (DI), where the respondent is provided information from the last data collection to aid in answering the current survey. If the information is still correct, then no change is needed, but if incorrect, the respondent has the option to change the response. To test this, we implemented two different versions of DI in a self-administered web survey and compared these against a traditional version of the web survey. We examined respondent burden by analyzing timing data and respondent enjoyment by analyzing debriefing questions. To assess the success of the implementation, we looked at timing data and undesirable behavior (missing data and backtracking). Finally, to evaluate measurement error, we looked at the number of meaningful changes. We found that DI is faster, more enjoyable, easily executed by the respondent (more so in one of our experimental formats), and significant measurement error was not introduced. In addition, DI provided consistency in the data, minimizing the noise introduced by nonmeaningful changes. The findings have significant implications for implementing DI in self-administered modes without an interviewer present.
Dependent interviewing (DI) is typically implemented in longitudinal studies using an interviewer-administered mode to reduce measurement errors like seam effects and telescoping. However, this technique could be useful in self-administered modes as well to reduce both measurement error and respondent burden. Our experiment and analysis are intended to study the operational success of DI to reduce burden, increase enjoyment, and maintain or reduce the measurement error. The findings have significant implications for employing DI, especially a two-screen version, in self-administered modes without an interviewer present.
1. INTRODUCTION
Longitudinal surveys are a valuable resource for collecting data over time for a cohort of individuals. These individuals are asked at multiple time points to provide data on a variety of subjects as well as restate responses on certain subjects, such as health status, employment, and education. As a result, unnecessary burden may be placed on the respondents as they provide the same response to questions they answered in a previous wave of the survey. A solution to address this respondent burden may be dependent interviewing (DI) where previous wave responses to questions are presented to respondents and they state whether that information has changed or not. While DI is likely to reduce the survey administration time, respondents’ perceived administration time and ease of participation are better measures of a positive experience. In this article, we test DI on a survey mode that does not commonly implement this technique—a self-administered web survey. Our concerns are both real and perceived burden reduction, respondent enjoyment, and ease of execution in a self-administered mode. Since improving respondents’ experience may come at a price if respondents further reduce their burden by not updating information that has changed (Mathiowetz and McGonagle 2000), we also examine indicators of measurement error. These analyses will conclude if DI in a self-administered mode provides an improved experience without introducing additional error.
1.1 Survey Burden
Survey burden is often measured by length (of both questionnaire and time to complete) and complexity of the task (Sharp and Frankel 1983; Schuman 1986; Hoogendoorn 2004; Peytchev 2009; Schaeffer 2020; Yan et al. 2020). Both of these survey features have been shown to lead to undesirable outcomes, namely break-off (Peytchev 2009) and increased measurement error (Backor et al. 2007; Peytchev and Peytcheva 2017). In self-administered modes, burden is a greater concern because there is not an interviewer to help engage respondents and clear up issues resulting from task complexity (Sharp and Frankel 1983; Peytchev 2009). In addition, for longitudinal surveys, a burdensome or negative experience could lead to attrition (Hoogendoorn and Sikkel 1998). Consequently, interviewer consistency is often employed to try to build rapport and curb attrition (Schräpler 2004; Lynn et al. 2014). So, one could argue that burden is of utmost concern for a self-administered longitudinal survey, particularly if long or complicated.
Alongside this motivation to reduce burden to encourage lower nonresponse and higher quality data, a survey designer carries the responsibility to be considerate to the respondent. As detailed in the 2020 AAPOR Presidential address, too often decisions made by survey practitioners are not made with the respondent’s experience in mind (Schaeffer 2020). Driven to collect more detailed information, questionnaires have become more complex, involving confusing, indirect, tedious, or poorly written survey questions that are cognitively taxing on the respondent. While innovations are available to reduce burden, they are often not implemented due to limitations of time, money, staff, and the absence of methodological research (Schaeffer 2020).
Taking this charge seriously, DI is an innovation that could make a positive impact on the respondent’s experience in a self-administered longitudinal survey. DI has been shown to reduce respondent burden by routing respondents around questions that could be redundant, difficult to answer, or involve multiple follow-up questions without risking data quality or efficiency in the data collection (Weinberg 2002; Jäckle 2008; Sala, Uhrig, and Lynn 2011). In addition, when respondents are presented with DI, they seem to not only approve of the technique (Pascale and Mayer 2004) but also want and expect DI to be used for their own data in longitudinal data collections (Pascale and Mayer 2004).
1.2 Risks of Implementing DI
DI has been shown to reduce measurement error in several ways. First, seam effects, a form of measurement error “defined by small changes in responses between adjacent months within a reference period relative to large changes between adjacent months across reference periods” (Conrad et al. 2009), are reduced by DI (Murray et al. 1990; Rips et al. 2003). Second, DI reduces forward telescoping (Holt 1979), which is reporting an event more recently than it happened (Tourangeau et al. 2000). Third, DI has been shown to reduce underreporting of events, including social benefits (Lynn et al. 2012) and other income-based questions (Lynn et al. 2006; Jäckle 2009).
Despite these successes, a possible source of measurement error introduced by DI is acquiescence with the DI-provided information, resulting in the underreporting of change. Acquiescence, described as blind agreement regardless of the context of the survey or question, is a form of satisficing (Krosnick 1991). Initially, DI was thought to increase acquiescent behaviors (Mathiowetz and McGonagle 2000). However, recent studies have found no evidence to suggest that DI increases these behaviors (Jäckle 2009; Eggs and Jäckle 2015) and, instead, appears to provide more accurate answers (Jäckle and Eckman 2020).
1.3 Designing DI for the Respondent’s Experience
DI has been used in surveys in one of two forms. In proactive DI, the respondent is given responses to questions from previous interviews for validation. In reactive DI, the respondent answers a cross-sectional style question and if the responses differ from prior responses, follow-up questions are triggered (Mathiowetz and McGonagle 2000; Jäckle et al. 2005). Examples of proactive DI in practice include the Current Population Survey (U.S. Census Bureau 2019) and the Survey of Income and Program Participation (Moore 2008). Reactive DI is less common but applied in the Canadian Survey of Labour and Income Dynamics (Sauvé et al. 2000). Previous work (on interviewer-administered surveys) has found that both reactive and proactive DI reduce burden (Hoogendoorn 2004; Lynn et al. 2012), but preference has been given to proactive DI to increase data quality, irrespective of survey mode (Hoogendoorn 2004; Al Baghal 2017).
Support for DI specifically to reduce respondent burden is demonstrated in only two studies. Hoogendoorn (2004) tested DI in the CentER Savings Survey and found respondents complained less, compared to prior years of implementation. While there was no reduction in response time, reduction of burden was not the focus of this research and the experimental design included numerous follow-up questions. Lynn et al. (2012) tested DI in a sample of panel respondents and found that it reduced the length of the interview. Taken together, DI appears to be a useful method when the goal is burden reduction, but more research is needed.
Even with the rise of computer-administered modes, examples in the literature of DI for self-administered surveys are scarce. The aforementioned Hoogendoorn (2004) study, which used proactive DI in a web survey, is one example. A second web-based example was an experiment comparing proactive and reactive DI to a control among a panel of first year psychology students. Applying DI for income and questions on money matters, the researchers found no difference in measurement error between the methods (Lugtig and Lensvelt-Mulders 2014). A final example tested two forms of follow-up questions for proactive DI against a control and DI resulted in fewer changes. However, the data collection was mixed mode, and the web-based results were not reported separately from the face-to-face mode (Al Baghal 2017). These examples of DI experiments were focused on reducing measurement error and not respondent burden or their enjoyment. It seems that not only is more testing of DI for web important but specifically understanding respondent burden and enjoyment of DI in web modes is a critical research gap.
A nuance of proactive DI is the approach using “remind, still …” versus “remind, change… .” In both, the respondents are reminded of their previous answers and then asked a follow-up question. For “remind, still …,” the follow-up asks, “Is this still the case.” In “remind, change …,” the follow-up asks, “Has this changed.” Jäckle and Eckman (2020) found that the “remind, still …” format provides the best data quality by reducing the number of overreports and was less confusing than the “remind, change …” format.
While DI, either proactive or reactive, is classically implemented in two steps (remind the respondent of past information and then issue a follow-up question), there may be a more streamlined method to achieve the same purpose. The general public is accustomed to filling out online forms and often those forms are prefilled with information the respondent or customer provided in the past. Iftikhar et al. (2021) conducted a usability study comparing a single screen to a multipage screen. They found that a single-page web form outperformed the multipage form in the usability evaluation and reduction of completion time (Iftikhar et al. 2021). With this shred of evidence, there is justification to further reduce burden and possibly increase enjoyment and ease of use by implementing DI in a single step.
Given previous research results, this study tests “remind, still …” proactive DI against a control to explore improvement of the respondent experience for a self-administered application (web) in terms of burden reduction and increased enjoyment. It is also important to evaluate the respondents’ ease of use to justify an implementation of DI that is just as or easier to use than a standard web instrument. We test these three outcome measures (burden reduction, enjoyment, and ease of use) through timing data, respondent debriefing questions, and analysis of undesirable behaviors. An additional layer to this work is the implementation of two forms of the “remind, still …” proactive DI to see if a single screen approach, similar to a web-based form, would further enhance the respondent’s experience compared to the classic two-step approach, based on our three outcome measures.
2. DATA
Data for this study come from a 2020 self-administered web pilot study of a sample of respondents from the Survey of Doctorate Recipients (SDR) [National Center for Science and Engineering Statistics (NCSES) 2020]. Conducted by the National Center for Science and Engineering Statistics (NCSES) within the National Science Foundation, the SDR is a biennial longitudinal survey that follows individuals who have earned a research doctorate degree in science, engineering, or health [National Center for Science and Engineering Statistics (NCSES) 2021]. The SDR covers current and past employment, and related experiences such as training and education. The 2019 SDR had a response rate of 67.4 percent (AAPOR RR3) with a notable trend toward completion via the web (84 percent in 2017 and 93 percent in 2019). The average survey length for respondents who completed the full 2019 SDR web survey was 20.18 minutes (provided by NCSES Survey Manager).
For the 2020 pilot, a stratified random sample consisted of respondents from the 2019 SDR (n = 3,600), as well as a smaller sample of 2015 (n = 100) and 2017 SDR respondents (n = 200) who did not respond in 2019. Respondents were selected for the overall sample if they reported working and living in the United States in the last cycle and if they responded to most of the questions about educational attainment, workplace type, and workplace duties providing the information needed for the DI. The weighted AAPOR response rate 1 was 61.7 percent, resulting in an overall analysis sample of 2,574 respondents.
The 2020 pilot consisted of a three-way split ballot experiment that tested two forms of DI against not receiving any DI: DI1, DI2, and traditional web administration (the control). DI1 designates the one-screen approach. This format used a layout reminiscent of a prefilled online form, showing an answered survey question with editable response options (e.g., selecting a different radio button or editing the open-ended text). There was a check box at the bottom of the screen where the respondent could indicate that the prefilled DI information is correct (and therefore no changes were necessary). DI2 is a more traditional two-step method and hence uses two screens to update information. This format presented the question with static (not editable) prefilled responses and a Yes–No question at the bottom of the screen asking if the information is still correct. If not, a second screen displayed a control version of the question where new information could be entered. This was true for open- and closed-end questions. The conditions had a weighted AAPOR response rate 1 of 60.5 percent (DI1, n = 830), 61.4 percent (DI2, n = 861), and 63.2 percent (control, n = 878). There were no significant differences in the response rates between the three conditions. Screenshots of survey questions for each condition can be found in appendix A in the supplementary data online.
Not including the verification questions, the main survey questions asked 28 questions about the respondent’s principal employer, sector of employment, whether the respondent is employed within an educational institution, and a description of their work activities in the last year. Within the main survey, 13 questions (46 percent) implemented DI with 32 possible changes to prior responses. At the end of the survey, all respondents were asked 13 respondent experience questions (REQs) with those in the DI treatment groups receiving an additional 7 questions only relevant to them. The REQs measured a respondent’s enjoyment of the survey, perceived survey burden, speed of survey completion, question sensitivity, and accuracy of responses. There were no demographic questions asked during the pilot study as the sponsor had demographics available in the sampling frame. However, these data were not made available to us. More information on the questions used in the analysis and their wording can be found in appendix B in the supplementary data online.
3. METHODS
All analyses considered the complex sample design features (probability weights adjusted for nonresponse and stratification) used in the 2020 SDR pilot study when calculating standard errors, variance estimates, and survey estimates, using Taylor series linearization for variance estimation as described in Heeringa et al. (2018). All comparisons of means and proportions were done using a design-adjusted Wald F-test testing for pairwise differences, and a second-order-corrected Rao-Scott F-test for overall tests of an effect.
3.1 Burden Reduction and Enjoyment
We assessed burden reduction and enjoyment by analyzing the time to completion, the respondent’s perceived time to complete the survey (REQ 1 in appendix B in the supplementary data online), and respondents' self-reports about their perceived survey burden (REQ 2 in appendix B in the supplementary data online) and survey enjoyment (REQ 3 in appendix B in the supplementary data online). All time data were converted to seconds and trimmed at the 1st and 99th percentiles as described by Yan and Tourangeau (2008). For the perceived time question, we looked at distributions and tested differences between group proportions of responses across conditions. For burden and enjoyment, we used bivariate comparisons of percent distributions of responses from the burden and enjoyment REQs across the DI conditions. These questions asked if the respondent enjoyed the survey and their point of view about prefilling questions with previous responses to make the survey easier. We also compared the time to complete the survey by device by DI condition. To understand if there is a difference between the device used to complete a survey by DI condition, we predicted marginal time of survey completion by interacting the DI condition and device using weighted linear regression.
3.2 Success of DI Implementation
To understand if respondents struggled with DI in the web format, we analyzed the timing data, missing data, and the number of backtracks. We split the survey roughly in half to account for all respondents, especially DI respondents, getting accustomed to the web survey format in the first half. The split was the approximate halfway point in the survey defined by the number of questions in the survey. Results generated from the stratified results were analyzed separately and any conclusions drawn from these analyses viewed holistically. We used the same methods as described earlier for the time difference analysis. For the analysis of backtracks, we used the mean number of backtracks and compared these across experimental conditions. For item missing data, we looked at each question that implemented DI and how many responses were missing by DI condition. We conducted a bivariate analysis comparing which type of web-enabled device was used by DI condition to ensure that the respondent distribution of the device type used to complete the pilot study within each DI condition was balanced.
3.3 Risk of Measurement Error
To assess the introduction of measurement error, we analyzed the number of changes made to prefilled data or compared to last wave, categorized the open-ended responses into meaningful or nonmeaningful changes, and compared the total number of changes within each DI group. We calculated the total number of changes by summing the number of changes made in each DI condition. Then, we calculated the mean number of changes per individual by averaging the number of changes made over the total number of individuals per DI condition. We also looked at respondents’ self-reports of not making changes when they could have.
We continue our examination of changes made by running a weighted negative binomial regression using pseudo-maximum likelihood estimation (PMLE) to model the count of how many changes were made by DI condition with controls. We modeled the number of changes overall, the number of changes made in the first half of the survey, the number of changes made in the second half, and the number of meaningful changes made to open-ended questions. These outcomes were modeled as a function of the experimental condition and the following covariates: device type used for data collection, perceived data protection, perceived question sensitivity, and currently employed (for overall number of changes and changes in the first half of the survey only since unemployed people did not get questions in the second half of the survey). We used negative binomial regression as opposed to linear regression as this form of regression is better suited to model count data. We also used the negative binomial regression as opposed to a PMLE-adjusted weighted Poisson regression as the alpha values (an indicator for dispersion) were significantly different from 0 across all models, suggesting that the negative binomial regression variance of the counts differs from the mean of the count by a significant amount (Heeringa et al. 2018). We controlled for device type in case small screens resulted in fewer changes. We expected the perceived data protection (REQ 4 in appendix B in the supplementary data online) and question sensitivity (REQ 5 in appendix B in the supplementary data online) to be indicators of unwillingness to share data and people high on these measures may report fewer changes. People who were unemployed received far fewer questions (and therefore could make fewer changes) than employed people.
We compared the proportion of open-ended changes that were meaningful to all open-ended changes. A meaningful change was defined as one more significant than correcting spelling errors from the previous response or adding or subtracting nonsubstantive details for the same job (e.g., classifying the type of “consultant” for job title, compared to “consultant” in the previous wave). An example of a meaningful change would be changing the workplace from the National Science Foundation to the U.S. Census Bureau. An example of a nonmeaningful change would be changing the workplace from the University of Michigan to the University of Michigan–Ann Arbor. Coding of meaningful changes was done by two independent parties and a third person was used to adjudicate any differences between codes. If necessary, additional data about the respondent (e.g., if any other open-ended fields had meaningful changes) were evaluated to determine if there had been real change in the respondent’s career.
One meaningful change to a respondent’s career or workplace could cascade into many other changes related to career or workplace. To see if that is the case, we modeled the number of open-ended changes by the number of closed-ended changes and stratified by DI using a negative binomial regression model to see if the number of changes in each question type is related.
We also analyzed the proportion of respondents who “confessed” in the REQs to intentionally not updating information because the previous response was either accurate enough (REQ 6 in appendix B in the supplementary data online), or they knew it was no longer accurate (REQ 7 in appendix B in the supplementary data online). These questions were only offered to the DI respondents as they were the only respondents who were shown previous responses. We compared the distribution of the responses to these questions by experimental condition.
4. RESULTS
4.1 Burden Reduction and Enjoyment
Table 1 presents the overall average time to complete the main survey (not the REQs) in seconds. For the timing analysis, partial completions were not included, resulting in excluding 17 respondents. DI2, the two-screen approach, had the shortest average time to completion compared to DI1, the one-screen approach, and the control (p < .05 for both comparisons). DI1 was significantly different from the control, suggesting a faster time to completion and lower burden for any DI condition compared to a traditional web survey.
Effects of Dependent Interviewing on Survey Burden, Weighted Results
| Dependent interviewing one-screen approach (DI1) | Dependent interviewing two-screen approach (DI2) | Control | |
|---|---|---|---|
| Mean survey response time, N = 2,545 | 553.5 (528.2, 578.8) | 506.4 (475.7, 537.1)a | 628.2 (598.4, 658.1)a,b |
| Mean survey response time first half, N = 2,545 | 281.1 (265.4, 296.8) | 251.0 (235.1, 266.8)a | 351.0 (334.8, 367.2)a,b |
| Mean survey response time second half, N = 2,258 | 271.2 (257.3, 285.1) | 254.1 (236.1, 272.0) | 275.5 (255.1, 295.8) |
| Perceived survey completion time, N = 2,569 | |||
| Very/somewhat slow | 8.0% (4.6, 11.3) | 9.0% (6.3, 11.7) | 16.7% (12.9, 20.6)a,b |
| Somewhat fast | 62.8% (57.9, 67.7) | 59.3% (54.4, 64.2) | 56.7% (51.8, 61.6)a,† |
| Very fast | 29.2% (24.8, 33.7) | 31.7% (27.1, 36.2) | 26.6% (21.9, 31.2) |
| Rao-Scott-adjusted F-value | F(3.90, 9,987.65) = 4.30** | ||
| Perceived survey enjoyment, N = 2,540 | |||
| Did not enjoy at all (%) | 12.4 | 12.6 | 16.6 |
| Enjoyed a little (%) | 33.8 | 35.9 | 35.1 |
| Somewhat enjoyed (%) | 43.6 | 41.1 | 41.8 |
| Enjoyed a great deal (%) | 10.2 | 10.3 | 6.6 |
| Rao-Scott-adjusted F-value | F(5.79, 14,631.01) = 1.37 | ||
| Perceived survey burden, N = 2,540 | |||
| Much more/a little more burdensome (%) | 1.8 | 1.2 | 6.8 |
| Neither more/less burdensome (%) | 10.9 | 11.2 | 21.8 |
| A little less burdensome (%) | 24.3 | 26.0 | 42.1 |
| Much less burdensome (%) | 63.1 | 61.6 | 29.3 |
| Rao-Scott-adjusted F-value | F(5.48, 13,857.29) = 22.01*** | ||
Note.—
p < .05,
p < .01,
p < .001.
Significant difference (p < .05) from DI1 based upon the adjusted Wald F-test.
Significant difference (p < .05) from DI2 based upon the adjusted Wald F-test.
Alongside a letter, is a marginal significant difference (.05 < p < .1) based on the adjusted Wald F-test.
Table 1 also shows the percentage distributions of perceived survey length for each experimental condition. In general, respondents who received either DI condition perceived the survey to be faster, having significantly lower probabilities of reporting the perceived survey time as being slow or very slow, compared to the respondents who received the control. However, there was no difference in those who perceived the survey to be very fast across all conditions. Table 1 also presents the distribution of self-reported survey enjoyment by DI condition. While there are no statistical differences between the DI conditions and survey enjoyment, we can see a noticeable difference at the extremes. The control group is more negative about the survey experience: 17 percent versus 12 percent for the DI groups reporting did not enjoy at all and 7 percent versus 10 percent for both DI groups reporting enjoyed a great deal.
Table 1 also presents the weighted percent distribution of perceived burden if survey responses were prefilled with previous responses, by DI condition. Overall, we see a strong relationship that respondents who had the DI conditions saw the benefit of prefilling answers as a reduction of burden compared to respondents who were in the control group (p < .001). While a supportive finding, Kaderabek and Sinibaldi (2022) suggest that this may be due to hypothetical bias, meaning that respondents in the control were consistently less positive for all questions that presented a hypothetical scenario about prefilling responses.
4.2 Success of DI Implementation
When we split the timings by progress of the survey, as shown in table 1, DI2 was significantly faster than both DI1 and the control for the first half of the survey. The trend is evident for the second half as well, but the differences are not significant indicating that DI1 and control respondents sped up in the second half of the survey. The slower speed found for the control in the first half of the survey was likely due to the high number of open-ended questions found in the first half of the survey, which include descriptions of job duties, employer name, and job title, to name a few. Intuitively, this would result in a longer time for the control as these responses would be prefilled for the DI conditions. However, DI1 and DI2 with the prefilled information should have been comparable. Therefore, DI1 respondents may have needed time to learn how to efficiently respond to the one-screen DI format. Along with the overall timing data, this seems to indicate that DI2 is faster partially due to a learning curve for DI1.
To further our analysis of ease of use, table 2 presents the mean number of backtracks on question screens by condition. In general, there were minimal backtracks in the survey and there was no difference in the number of backtracks per condition. This suggests that respondents did not find the DI formats more confusing than the control.
Bivariate Measures of Data Quality, Weighted Results
| Dependent interviewing one-screen approach (DI1) | Dependent interviewing two-screen approach (DI2) | Control | |
|---|---|---|---|
| Mean number of backtracks, N = 2,574 | 1.1 (0.9, 1.3) | 1.1 (0.9, 1.3) | 1.0 (0.8, 1.1) |
| Mean number of changes, N = 2,574 | 2.1 (1.8, 2.3) | 2.0 (1.6, 2.4) | 10.6 (9.9, 11.3)a,b |
| Rao-Scott F-value for independence | F(27.52, 70,357.55) = 18.14*** | ||
| Mean number of closed-ended question changes, N = 2,470 | 0.9 (0.8, 1.1) | 1.2 (0.8, 1.5) | 6.7 (6.1, 7.3)a,b |
| Rao-Scott F-value for independence | F(21.75, 53,479.07) = 17.86*** | ||
| Mean number of open-ended question changes, N = 2,470 | 0.4 (0.3, 0.5) | 0.3 (0.2, 0.4)a | 1.7 (1.6, 1.8)a,b |
| Rao-Scott F-value for independence | F(4.47, 10,987.13) = 50.92*** | ||
| % of open-ended changes that are meaningfulc | 87.2% (83.6, 90.7) | 88.6% (85.5, 97.1) | 48.3% (45.2, 51.4)a,b |
| N = 81 | N = 103 | N = 348 | |
Note.—
p < .05,
p < .01,
p < .001.
Significant difference (p < .05) from DI1 based on the adjusted Wald F-test for comparing means.
Significant difference (p < .05) from DI2 based on the adjusted Wald F-test for comparing means.
Ns in this row represent total number of changes made in open-ended questions.
Furthermore, item nonresponse was very low (∼1–2 percent) across all main survey questions. However, when item nonresponse did occur, DI1 respondents accounted for almost all of the item nonresponse. There were only two instances of survey breakoff where the respondent left the survey in the middle of implementation. Of these two instances, both were within the control condition. While these numbers are very small, there is light support that respondents were more receptive to DI2.
Figure 1 presents the marginal predicted survey completion time by device used and DI condition. In general, there are no differences in completion times by device between the DI conditions. There is a significant difference in competition time when a desktop computer is used with the DI groups taking significantly less time compared to the control.
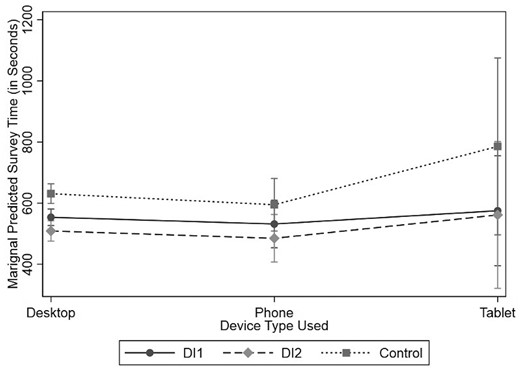
Marginal Predicted Survey Completion Time by Device Used to Complete 2020 SDR Pilot and DI Condition, with 95 Percent Confidence Intervals.
Lastly, we compared the distributions of how many respondents within each group completed the pilot by device type and found no differences, suggesting balanced distributions of device type used to complete the survey by group.
4.3 Risk of Measurement Error
Table 2 also presents the mean number of changes made by condition for all questions and then split by open-ended and closed-ended questions. The results show that respondents in DI1 and DI2 make substantially fewer changes compared to the control condition, but there is no difference between the DI conditions.
However, as shown in table 2, once the open-ended changes are coded into “meaningful” and not, we see that majority of the changes in the DI condition are meaningful (88–89 percent) under our coding scheme. While fewer changes to open-ended questions for the DI conditions may introduce concerns about satisficing, this analysis of meaningful change seems to support an argument of appropriate consistency in the DI conditions. The inconsistency between waves in the control is adding unnecessary “noise” to the data. Combining the open- and closed-ended results suggests that respondents who had the DI condition were more likely to make a change to their prior response when the change is significant, such as taking a new job. Figures 1–4 in the supplementary data online visually present the counts of open-ended changes.
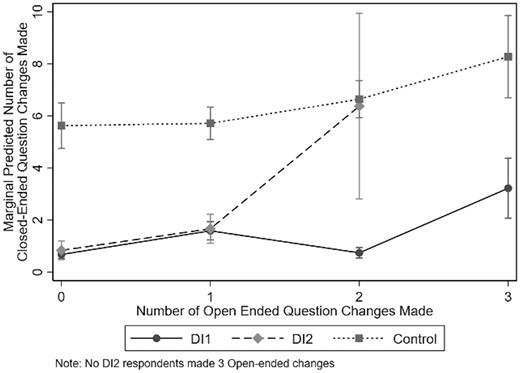
Marginal Predicted Number of Closed-Ended Response Changes by the Number of Open-Ended Response Changes, Across Experimental Conditions.
Figure 2 presents the marginal predicted number of changes made in the closed-ended questions by the interaction of experimental condition and the number of changes made in the open-ended questions. We expect an upward trend in the number of closed-ended changes as the number of open-ended changes increases and see this in all three conditions but especially among the DI2 respondents. DI1 respondents made few changes to the closed-ended questions except for those that made three open-ended changes. Changing all three open-ended questions is indicative to a complete job change in the employer, department, and job title. Table 6 in the supplementary data online presents the model used to generate figure 2.
For DI2, the data show a more notable trend that as respondents made more changes to the open-ended questions, they were more likely to make changes to the closed-ended questions. This relationship suggests that DI2 respondents may have been more thorough in responding to questions than DI1 respondents.
DI1 respondents only made changes to more than two closed-ended questions when all three open-ended questions were changed. If this is indicative of a job change as we suspect, we should see more changes to the closed-ended questions. Even for changes to two open-ended questions, we would expect more closed-ended changes, more aligned with the levels for DI2 and the control. Therefore, this seems to indicate satisficing among the DI1 respondents. Whether this is due to difficulty with the one-screen format or that the format lends itself to “laziness,” we cannot say.
Table 3 presents the incident rate ratios (IRR) based on a negative binomial regression model for the number of changes made overall, and tables 3–5 in the supplementary data online present the IRR based on a negative binomial regression model for the number of changes made in the first half and the second half of the survey, as well as the number of meaningful open-ended changes. Across all comparisons, the control had a significantly and substantially higher rate of changes compared to the reference group, DI2.
Negative Binomial Regression of the Number of Changes Made between Survey Waves
| Incident rate ratio (95% CI) | ||||
|---|---|---|---|---|
| n = 2,574 | n = 2,574 | n = 2,561 | n = 2,550 | |
| Experiment condition | ||||
| DI1 | 1.0 (0.8, 1.3) | 1.0 (0.8, 1.3) | 1.0 (0.8, 1.3) | 1.0 (0.8, 1.3) |
| DI2 | REF | REF | REF | REF |
| Control | 5.3 (4.3, 6.7)*** | 5.3 (4.3, 6.7)*** | 5.3 (4.3, 6.6)*** | 5.3 (4.3, 6.6)*** |
| Data collection device | ||||
| Computer | REF | REF | REF | |
| Tablet/cellphone | 0.8 (0.7, 0.9)* | 0.8 (0.7, 1.0)* | 0.8 (0.7, 0.9)* | |
| Perceived data protection confidence | ||||
| None | REF | REF | ||
| A little | 1.1 (0.6, 1.8) | 1.1 (0.6, 1.8) | ||
| Somewhat | 1.1 (0.7, 1.7) | 1.1 (0.7, 1.7) | ||
| Very | 1.1 (0.8, 1.7) | 1.1 (0.8, 1.7) | ||
| Perceived question sensitivity | ||||
| None | REF | |||
| A little | 1.0 (0.8, 1.1) | |||
| Somewhat | 1.1 (0.8, 1.4) | |||
| Very | 1.2 (0.9, 1.5) | |||
| Alpha value | 0.8 (0.6, 0.9) | 0.8 (0.6, 0.9) | 0.8 (0.6, 0.9) | 0.8 (0.6, 0.9) |
Note.— REF: Reference Category.
p < .05,
p < .01,
p < .001.
While there was no difference in the overall number of changes between the DI conditions, lower rates of change for DI1 respondents in the second half of the survey suggested respondents’ enthusiasm for making changes diminished as the 15-minute survey proceeded. This is supported in the REQ where DI1 respondents “confessed” to not changing responses that are no longer true more frequently than DI2 respondents (as shown in table 4).
Percentage of Respondents by Experimental Condition Who Report Not Changing Previous Answers for One or Two or More Questions
| DI1, % (95% CI) | DI2, % (95% CI) | |
|---|---|---|
| Not changing responses when… | ||
| Past responses accurate enough | n = 1,682 | |
| 1 question | 11.4% (8.3, 15.4) | 13.0% (10.8, 15.4) |
| 2+ questions | 21.8% (17.9, 26.4) | 21.9% (17.8, 26.8) |
| Rao-Scott F-value for independence | F(1.90, 3,144.53) = 2.91ǂ | |
| Past responses no longer true | n = 1,682 | |
| 1 question | 3.8% (2.7, 5.4) | 5.2% (2.8, 9.7) |
| 2+ questions | 3.3% (1.6, 6.7) | 1.0% (0.5, 1.8)a,† |
| Rao-Scott F-value for independence | F(1.97, 3,286.82) = 0.24 | |
Note.—ǂp < .1,
p < .05,
p < .01,
p < .001.
Significant difference (p < .05) from DI1 based upon the adjusted Wald F-test for comparing percentages.
Alongside a letter, denotes a marginal significant difference (.05 < p < .1) based on the adjusted Wald F-test.
5. DISCUSSION
Our aim was to examine the potential benefits of burden reduction and respondent enjoyment when implementing DI in a self-administered mode by comparing it to a traditional web administration. We tested a one-screen editable DI format (DI1) and a traditional two-screen format where edits are made on the second (follow-up) screen (D2), against a traditional web administration (control). Our analyses looked at measures of completion time, perceived survey completion time, perceived survey enjoyment and burden, number of response changes made between survey waves, and self-reported reasons for not making changes to inaccurate responses. Our three-condition design found that both DI conditions reduced burden but DI2, the two-screen approach, was fastest (real and perceived) compared to DI1, the one-screen approach, and the control condition. There was no difference in enjoyment between the two DI conditions, but the timing data showed that DI2 was easier for respondents to execute. As far as indications of measurement error, the number of changes analysis found no significant concerns of satisficing and less evidence of it for DI2 compared to DI1. In addition, DI resulted in fewer unnecessary changes, reducing noise in the data. Across all results, we conclude that not only is DI beneficial for burden reduction and enjoyment in a self-administered mode but DI2, using the more traditional two-part format, is the better format. Compared to DI1, DI2 had shorter response times, less evidence of satisficing, and a lower number of unnecessary changes made.
While the timing analysis indicated that DI was faster, we note that there were few changes made in any of the conditions (see figures 1–4 in the supplementary data online). It would be interesting to study situations where numerous changes to previous information were required. It could be that when there are a lot of changes, DI is actually more time consuming (and therefore more burdensome) than the control because it requires the extra step of evaluating the accuracy of the response from the last wave before entering the new information. Additional burden could be added for responses that are partially accurate because this evaluation would involve further cognitive deliberation to judge both the accuracy of the previous answer and how to edit it to make it (more) accurate. Deciding how to edit information that changed somewhat or was poorly recorded in a previous wave is likely to add extra time. If more time is required for more changes than we saw in our data, this would indicate a limit to DI’s burden improvement and provide a caution as to the best situations in which to implement DI.
The judgment step in the cognitive process was captured in the “confessional question” that asked if the answer was “accurate enough.” Respondents who replied that they did not change information that was accurate enough were given the opportunity to explain why. These open ends noted sentiments such as: the information was “close enough” or “good enough,” it was easier to leave it than make it more accurate, “I didn’t think I had significantly better data,” and while the number wasn’t accurate today, it fluctuated over time and would likely be correct in the near future. While we feel confident that, all things considered, DI is a positive improvement for self-administered longitudinal data collections, we believe that further study of this specific step in the cognitive process for surveys implementing DI could better illuminate the threshold of when DI is helpful for burden and data quality and when the control version may be a better choice.
The main limitation of this experiment is the study population which is highly educated (PhDs) and includes the “best behaved” respondents who not only responded previously but also provided complete data for the previous wave of the SDR. This may limit the applicability of these results to the general population or, given the importance of judgment when answering DI questions, populations with cognitive limitations. In addition, we had very low response from the nonrespondents in the 2019 SDR who completed this pilot study, not allowing us to specifically examine DI in cases where the time between data collection points is lengthy. Future steps to build upon this work could involve implementing a more complex and lengthier instrument, with a more diverse population, to better explore the potential for “bad behavior” like satisficing and backtracking to avoid follow-up questions. In addition, administrative data could be used to test the accuracy of the information in both the previous and current data collection waves, to evaluate measurement error and noise more thoroughly in the data.
Supplementary Materials
Supplementary materials are available online at academic.oup.com/jssam.
The authors would like to thank Jen Beck, Rebecca Morrison, Darby Steiger, James Wagner, and Brady West for their contributions to this project. This analysis was supported and funded by the NCSES Broad Agency Announcement research program [Contract # 49100420C0020]. The study design and analysis were not preregistered. Data for this project can be requested through the National Center for Science and Engineering Statistics within the National Science Foundation and code can be obtained through a request to the authors.
The views expressed in this document are those of the authors and do not necessarily reflect the views of the National Center for Science and Engineering Statistics within the National Science Foundation.
