


cognitive deterioration and reductions of bone health coincide with increasing age. We examine the relationship between bone composition and plasma markers of bone remodelling with measures of cognitive performance in healthy adults.
this cross-sectional study included 225 old (52% women, mean age: 74.4 ± 3.3 years) and 134 young (52% women, mean age: 23.4 ± 2.7 years) adult participants from the MyoAge project. Whole body bone mineral density was measured by dual-energy X-ray absorptiometry. Blood analyses included a panel of bone-related peptides (dickkopf-1, osteoprotegerin, osteocalcin (OC), osteopontin, sclerostin, parathyroid hormone and fibroblast growth factor 23), as well as serum calcium and 25-hydroxy vitamin D assays. A selection of cognitive domains (working memory capacity, episodic memory, executive functioning and global cognition) was assessed with a standardised neuropsychological test battery.
adjusting for covariates and multiple testing revealed that plasma OC levels were positively associated with measures of executive functioning (β = 0.444, P < 0.001) and global cognition (β = 0.381, P = 0.001) in the older women.
these correlative results demonstrate a positive association between OC, a factor known to regulate bone remodelling, with cognitive performance in older non-demented women. Further work should address possible mechanistic interpretations in humans.
Introduction
Cognitive deterioration, including the consequence of neurodegenerative diseases, and reductions of bone health are increasingly evident in older age. Studies have shown relationships between measures of overall bone mineral density (BMD) and the risks of Alzheimer's disease and cognitive decline especially in older women [1, 2]. This raises the possibility that factors related to bone regulation and function may influence cognitive performance.
Bone is a metabolically active tissue and is constantly being remodelled throughout life mainly through the activity of opposing specialised osteoclast and osteoblast cells via secretory peptides and metabolites [3]. For example, differentiated osteoblasts modify and deposit the non-collagenous protein osteocalcin (OC) which, together with minerals, establishes the bone matrix. Conversely, the activation of Dickkopf-1 (DKK1) can instigate osteoclast activation resulting in bone resorption [4].
Since many of these bone-related peptides are secreted into the circulation, there has been growing interest into their influences on the central nervous system [5]. For example, Wnt signalling transduction regulates bone formation, which is prevented through DKK1. This action has been associated with neurodegeneration in Alzheimer's disease [6], whereas the loss of DKK1 has been shown to enhance neurogenesis in mice [7]. Remarkably, bone-derived OC has been shown to cross the blood–brain barrier and influence brain development, cognition and behaviour in mice [8]. A recent human study found a link between lower serum OC levels with microstructural changes and lower cognitive performance, which suggests that these potential neuromodulator mechanisms may also be present in humans [9]. Collectively, these findings suggest that there may be a convergence in mechanisms underlying bone with neurodegeneration and that bone may possess endocrine properties which aid in maintaining cognitive wellbeing.
The majority of observational studies have focussed on BMD measures to characterise bone health [1, 10] and questionnaires for cognitive analysis [10], which provide little mechanistic insight and, in the case of questionnaires, lack sensitivity. Studying biochemical markers of bone remodelling may be a more sensitive analytical approach than radiological BMD measurements to detect subtle preclinical alterations of bone metabolism. For example, Kahl et al. [11], investigated various types of depression in women and found elevations of serum markers of bone turnover associated with a relatively mild form of depression, whereas only those with a severe depressed phenotype had reductions in BMD.
Importantly, previous studies have focused on those with clinically-diagnosed neurodegeneration or osteoporosis in the elderly with very few investigating cognitively intact and physiologically healthy subjects. Additionally, since bone remodelling is influenced by ageing and sex, it is also topical to investigate these independently.
This current study evaluated the relationship between BMD and peptides associated with bone remodelling in healthy young and older adults with measures of cognitive performance; specifically working memory capacity, episodic memory, executive functioning and overall performance.
Methods
Participants
MyoAge is a cross-sectional European multi-centre study and the measurements completed in this particular study were collected from centers located in Manchester, UK; Paris, France; Leiden, The Netherlands; Tartu, Estonia and Jyväskylä, Finland. The cohort consisted of young (range: 18–30 years) and relatively healthy older (range: 69–81 years) participants. Those who completed all of the cognitive assessments and had matching plasma samples available (young men, n = 64; young women, n = 70; old men, n = 109; old women, n = 116) were used in this study. A detailed description of the exclusion criteria, designed to ensure the selection of healthy participants and to minimise the confounding effect of comorbidity on sarcopenia, has been reported previously [12]. All measurements were performed according to unified standard operating procedures during visits to the local study laboratories. Education levels and lifestyle factors (smoking status, alcohol intake and supplement use) were self-reported. Excessive alcohol was defined as men >21 units/week and women >14 units/week. Supplement usage includes those who reported the use of bisphosphonates, calcium or vitamin D. The local medical ethical committees of the respective institutions approved the study and written informed consent was obtained from all participants.
Dual-energy X-ray absorptiometry
Whole body scans were performed using dual-energy X-ray absorptiometry (DXA) (The Netherlands: Hologic QDR 4500, version 12.4, Hologic Inc., Bedford, MA, USA; Finland: Lunar Prodigy, version enCore 9.30; Estonia: Lunar Prodigy Advanced, version enCore 10.51.006; France: Lunar Prodigy, version enCore 12.30; United Kingdom: Lunar Prodigy Advance, version enCore 10.50.086) to measure whole body BMD. During the measurements, a light cotton shirt was worn by the participants to reduce effects of clothing absorption.
Cognitive assessments
Participants completed the Geriatric Depression Scale (GDS) [13] and the Mini Mental State Examination (MMSE) [14] questionnaires prior to testing to determine their depressive mood and cognitive dysfunction, respectively. Only those who achieved less than 5 points on the GDS and greater than 23 points on the MMSE were included.
Cognitive domains were assessed using the Cambridge Neuropsychological Test Automated Battery (CANTAB) system (Cambridge Cognition Ltd., UK) in a quiet room free from distractions and overseen by trained experimental staff. The CANTAB system contains standardised assessments that are routinely used in psychological assessment [15]. Each participant performed three tests; Spatial Span, One Touch Stockings of Cambridge and Paired Associate Learning to determine their working memory capacity [16], executive functioning [17] and episodic memory [18] performance, respectively. Each test is discussed in detail in Appendix 1 in the supplementary data on the journal website (http://www.ageing.oxfordjournals.org/).
To standardise performances, each cognitive score was transformed into a Z-score based on the young average. A positive score indicates a higher than average performance, relative to the young. The scale in episodic memory score was inverted so a positive score will indicate a better score and vice versa. Additionally, a global cognition score was determined as the sum of the three individual outcomes to represent a combined performance as utilised previously [19].
Multiplex immunoassays
Peptides frequently associated with bone metabolism were simultaneously quantified from fasted plasma samples via commercial multiplex immunoassays (MILLIPLEX MAP Human Bone Magnetic Bead Panel, Millipore). The magnetic bead panel was able to simultaneously quantify, Dickkopf-1 (DKK1), osteoprotegerin (OPG), osteocalcin (OC), osteopontin (OPN), sclerostin (SOST), parathyroid hormone (PTH) in a 96-well format. The procedure included an overnight incubation in order to improve assay sensitivity. The sensitivity of each analyte was as follows: 1.4 (DKK1), 1.9 (OPG), 68.5 (OC), 37.7 (OPN), 31.1 (SOST), 1.8 (PTH) and 9.2 (FGF-23) pg/ml. A magnetic plate washer was utilised during the plate washing stages. The plate was processed on a Luminex 200 instrument. Protein concentrations were calculated and analysed with the xPONENT software (Luminex, v.3.1.871).
Serum calcium and 25-hydroxy vitamin D
Serum samples were tested for calcium using a calcium CP reagent on a Horiba ABX Pentra 400 Clinical Chemistry analyser. Serum 25-hydroxy vitamin D (25(OH)D) was determined using an enzyme linked immunosorbent assay (Immunodiagnostic Systems Ltd) according to the manufacturer's instructions. Analysis was conducted at Unilever Discover, Colworth Science Park.
Statistics
All statistical analysis was performed using IBM SPSS Statistics software (v.20). Results were deemed significant at the P < 0.05 level, unless otherwise stated. Logarithmic transformation was performed on plasma bone marker data to achieve normality. Continuous data were tested using two-way ANOVA to determine possible age (young or old), sex (men or women) effects and age×sex interactions. Pearson chi-squared tests were performed to determine distribution differences between nominal data. Mann–Whitney U tests were performed to determine differences in cognitive performance between age groups.
To determine plasma bone marker relationship with the measures of cognitive functioning, Spearman correlation analysis was initially performed followed by multivariate regression. Factors identified as being significantly associated with cognitive function were investigated further to account for confounders through separate multivariate regression models. Scores of cognitive functioning were set as the dependent variable and the bone markers, as well as potential confounders, were set as the independent variables. To identify confounders, correlations between cognitive scores and physiological measures (height, body mass, body mass index (BMI), BMD, serum calcium and 25(OH)D) were used. A confounder was identified if a relationship existed at the P < 0.1 level, as used previously [20]. Following this analysis, BMD, BMI, height and 25(OH)D were all selected as possible confounders to be included in first regression model, along with age, education level and participant location. A second model was also used, which contained Model 1 as well as lifestyle factors (current smoking status, excessive alcohol use and supplement use). The residuals of both regression models were normally distributed as assessed by the Durbin-Watson statistic. Due to multiple testing (four tests), a Bonferroni corrected level of significance of P < 0.0125 (0.05/4) was applied for this analysis.
Results
Participant characteristics are presented in Table 1.
Participant characteristics, stratified by physiological, lifestyle and education parameters
| Variables | Young | Old | Effects (P-value) | ||||
|---|---|---|---|---|---|---|---|
| Men | Women | Men | Women | Age | Sex | Age × Sex | |
| Age, years | 23.74 (2.67) | 23.05 (2.77) | 74.75 (3.35) | 74.16 (3.34) | <0.001* | 0.063 | 0.878 |
| Height, m | 1.81 (0.06) | 1.68 (0.06) | 1.74 (0.06) | 1.61 (0.07) | <0.001* | <0.001* | 0.791 |
| Body mass, kg | 75.41 (10.30) | 62.90 (9.04) | 78.26 (11.10) | 65.92 (10.10) | 0.009* | <0.001* | 0.940 |
| BMI, kg/m2 | 23.03 (2.66) | 22.27 (2.85) | 25.71 (2.96) | 25.37 (3.63) | <0.001* | 0.103 | 0.540 |
| BMD, g/cm2 | 1.26 (0.10) | 1.15 (0.07) | 1.19 (0.11) | 1.04 (0.10) | <0.001* | <0.001* | 0.074 |
| Current smoker, n (%) | 6 (9.4) | 8 (11.4) | 7 (6.4) | 4 (3.4) | 0.045* | 0.693 | 0.173 |
| Excessive alcohol use, n (%) | 10 (15.6) | 5 (7.1) | 12 (11) | 7 (6) | 0.389 | 0.043* | 0.160 |
| Supplement intake, n (%) | 4 (6.3) | 1 (1.4) | 14 (12.8) | 36 (31) | <0.001* | 0.013* | <0.001* |
| Education, n (%)a | |||||||
| Basic school | 0 (0) | 0 (0) | 13 (15.3) | 17 (17.9) | <0.001* | 0.083 | <0.001* |
| High school | 9 (16.4) | 5 (8.6) | 22 (25.9) | 45 (47.4) | |||
| University | 46 (83.6) | 53 (91.4) | 50 (58.8) | 33 (34.7) | |||
| MMSE score, median (IQR) | 30 (29–30) | 30 (29–30) | 29 (28–30) | 29 (28–30) | <0.001* | 0.594 | 0.508 |
| GDS score, median (IQR) | 0 (0–1) | 0 (0–1) | 1 (0–2) | 1 (0–2) | 0.002* | 0.544 | 0.356 |
BMI, body mass index; BMD, bone mineral density; MMSE, Mini Mental State Examination; IQR, interquartile range; GDS, Geriatric Depression Scale. Data are shown as mean (standard deviation), unless otherwise stated. * indicates a significant (P < 0.05) effect or interaction.
aData available in: young men n = 55; young women n = 58; old men n = 85; old women n = 95.
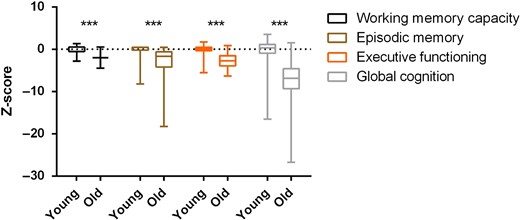
Cognitive performance in the two age groups. Data are shown as median, interquartile range and minimum and maximum. Z scores are relative to the young group's average value for each cognitive output. ***P < 0.001.
Blood concentrations of the bone-related markers, as well as serum calcium and vitamin D, significantly differed by both age and sex groups. Refer to Appendix 2 in the supplementary data on the journal website (http://www.ageing.oxfordjournals.org/) for the full analysis.
There were no significant associations observed between whole body BMD with episodic memory, working memory, executive functioning or global cognition in young women, young men, old women or old men (data not shown). Furthermore, investigations into serum 25(OH)D and calcium were not significantly associated with any of the measures of cognitive functioning (data not shown).
Initial exploratory analysis between the four measures of cognitive scores and seven plasma markers revealed some sex- and age-specific associations (Table 2). There was no relationship found in the men. There was a negative association between overall cognitive scores and DKK1 in the young women. The old women had a positive association between OC and working memory capacity, executive functioning and global cognition scores.
Correlation between cogntive measures and plasma bone markers
| Variable | DKK1 | OPG | OC | OPN | SOST | PTH | FGF-23a |
|---|---|---|---|---|---|---|---|
| Young men | |||||||
| Working memory capacity | −0.069 | −0.139 | 0.115 | −0.127 | 0.061 | 0.027 | −0.063 |
| Episodic memory | 0.065 | 0.237 | 0.078 | 0.050 | 0.078 | 0.181 | −0.118 |
| Executive functioning | −0.026 | −0.012 | −0.018 | −0.068 | −0.092 | 0.069 | −0.011 |
| Global cognition | −0.034 | −0.063 | 0.042 | −0.144 | 0.002 | 0.063 | −0.077 |
| Young women | |||||||
| Working memory capacity | −0.208 | 0.217 | −0.173 | 0.059 | −0.149 | 0.188 | 0.168 |
| Episodic memory | −0.226 | −0.121 | 0.068 | −0.234 | 0.080 | −0.026 | 0.234 |
| Executive functioning | −0.092 | −0.124 | 0.090 | −0.036 | −0.057 | 0.076 | −0.040 |
| Global cognition | −0.287* | 0.049 | −0.069 | −0.067 | −0.144 | 0.163 | 0.095 |
| Old men | |||||||
| Working memory capacity | −0.094 | −0.155 | −0.118 | 0.037 | −0.115 | 0.015 | 0.109 |
| Episodic memory | −0.041 | −0.035 | −0.102 | −0.022 | −0.040 | 0.071 | 0.039 |
| Executive functioning | −0.017 | 0.184 | 0.050 | 0.050 | 0.046 | 0.000 | −0.105 |
| Global cognition | −0.062 | 0.016 | −0.092 | −0.023 | −0.037 | 0.037 | −0.044 |
| Old women | |||||||
| Working memory capacity | 0.085 | 0.053 | 0.256** | 0.178 | 0.117 | 0.150 | −0.145 |
| Episodic memory | −0.101 | −0.150 | 0.147 | 0.114 | −0.030 | 0.008 | −0.021 |
| Executive functioning | −0.127 | −0.077 | 0.252** | 0.111 | −0.041 | −0.002 | 0.097 |
| Global cognition | −0.107 | −0.092 | 0.245** | 0.156 | −0.004 | 0.025 | 0.031 |
DKK1, Dickkopf-1; OPG, osteoprotegerin; OC, osteocalcin; OPN, osteopontin; SOST, sclerostin; PTH, parathyroid hormone. Data are shown as Spearman correlation coefficient (rho). *P < 0.05. **P < 0.01.
aSome samples were below the lower limit of detection for FGF-23. Data available in: young men, n = 46; young women, n = 58; old men, n = 78; old women, n = 87.
Those significant relationships were analysed further to account for potentially confounding effects of other variables. After adjusting for participant age, country, education level the confounding variables previously highlighted in the preliminary analysis (Model 1) the relationship between DKK1 and global cognition in the young women was no longer significant (Table 3). Despite the association of OC with working memory capacity in the old women, this failed to reach the Bonferroni corrected threshold (P > 0.0125). After Model 1 adjustments, significance remained for OC with executive functioning and global cognition in old women even after accounting for multiple comparisons (Table 3). Independently, OC was a significant predictor of executive functioning (F(1,114) = 5.668; P = 0.019; R2 = 0.047) and global cognition (F(1,114) = 4.164; P = 0.044; R2 = 0.035) in older women.
Multivariate regression analysis of bone markers with cognitive functioning
| Relationships | Model 1 | Model 2 | ||
|---|---|---|---|---|
| β | P-value | β | P-value | |
| Young women | ||||
| Global cognition and DKK1 | −0.301 | 0.079 | −0.243 | 0.158 |
| Old women | ||||
| Working memory capacity and OC | 0.291 | 0.014 | 0.274 | 0.018 |
| Executive functioning and OC | 0.433 | <0.001* | 0.444 | <0.001* |
| Global cognition and OC | 0.369 | 0.001* | 0.381 | 0.001* |
β, standardised coefficient; BMI, body mass index; DKK1, Dickkopf-1; OC, osteocalcin. Model 1 included adjustments for age, participant country, education level and those factors which were discovered in the preliminary analysis (whole body BMD, BMI, height, 25(OH)D). Model 2 included Model 1 and lifestyle factors (current smoking status, excessive alcohol use and supplement use).
*Correlation remained significant after accounting for multiple testing via the Bonferroni correction method (P < 0.0125).
A second model (Model 2) was also used, which included the variables in Model 1 as well as supplement intake, current smoking status and excessive alcohol use, which have previously been linked to cognitive decline in the elderly [19]. The relationships between OC with executive functioning and global cognition in old women remained after the adjustment with this model (Table 3).
Discussion
In the present investigation, we identified a relationship between OC and multiple measures of cognitive performance in old women.
Comparing cognitive performances between ages indicated that the old had lower working memory capacity, executive functioning capability and episodic memory compared with the young adults. Reductions of most cognitive domains have been noted including memory (episodic, working and verbal), spatial visualisation, processing speed and reasoning [21]. The cause of this phenomenon is yet to be fully elucidated, however, a multifactorial origin is likely to explain this age-related cognitive decline. Additionally, the finding of men having a higher working memory capacity than women is consistent with previous reports [21], which suggests that sex is a determining factor in certain cognitive performances.
When correlating BMD with cognition in the young and older adults we found no associations. Previous structural analysis of bone health with neuropsychological functioning has suggested that lower BMD is associated with lower cognitive performance, particularly in post-menopausal women [2, 10]. Additionally, incidence of Alzheimer's disease is believed to be higher in those with low BMD [1]. These previous studies that associated clinically-diagnosed poor cognition with low BMD contrast with the present findings in healthy older people and it is possible that the association only becomes evident at the later stages of the physiological declines. Analysis of vitamin D and calcium serum levels with relation to cognitive scores suggested no association in the older adults. Despite vitamin D levels being marginally reduced in the older adults reported here, they were still within the optimal reference range (25–80 ng/ml) [22], which may explain the lack of associations in our elderly groups.
Multiple cognitive measures were positively associated with plasma OC levels in older women even after adjusting for confounders in multivariate regression analysis. OC, secreted by osteoblasts, is often used as a marker of bone formation [23] and has been shown to possess endocrine properties such as glucose metabolism [24]. Interestingly, Oury et al. [8] demonstrated that bone-derived OC can passively cross the blood–brain barrier, as well as the placenta during pregnancy, to influence neurons in various brain regions including the hippocampus. Specifically, these investigators noted that OC enhanced neurotransmitter synthesis, neurogenesis and measures of spatial learning and memory in mice [8].
From a human clinical perspective, mutations in the RUNX2 gene, the main regulator of OC [25], are known to cause Cleidocranial dysplasia that often presents with cognitive impairments [26]. Furthermore, a recent study on obese and control human subjects found that lower OC was associated with higher BMI and lower cognitive performance together with brain microstructural changes [9]. The authors calculated that serum OC independently explained 10% of the variation in cognitive performance [9]. In this study, we found that plasma OC solely predicted global cognition and executive functioning by 3.5 and 4.7%, respectively. These relatively small effect sizes imply that OC is not the sole mediator in cognitive functioning, which is to be expected considering the complex multifactorial nature of cognitive functioning. Nevertheless, the aforementioned mechanisms linking OC with neuro-modulatory functions in mice [8] and the correlations between numerous cognitive measures in humans, as presented here and elsewhere [9], warrant the need to explore this bone-related peptide further to establish a causal relationship with neuromodulation.
The present study has a number of strengths, particularly with respect to the younger and older cohorts carefully selected to ensure they were healthier than average for their age and they undertook detailed cognitive assessments. The study, however, has several limitations. The cross-sectional design limits a definitive conclusion regarding a cause-and-effect relationship between the plasma markers and cognitive decline, instead we found a correlation rather than causation. We also did not account for variations between the older women in their menstrual status, although they were all post-menopausal, and hormonal influences (such as oestrogen levels) in women as well as thyroid function. These factors may contribute to the lack of associations in males in our analysis; however, further work is needed to investigate this potential sexual dimorphic pattern.
Collectively, the fact that we found no associations between whole body BMD and cognition in our population but, instead, relationships with osteocalcin suggest that the alterations in bone remodelling factors might precede changes in BMD with relation to cognition. Further longitudinal studies investigating bone remodelling proteins, particularly OC, as well as BMD with cognitive performance in older women are needed to elucidate the proposed relationship between bone health and neuromodulation.
We find no associations between whole body bone mineral density and cognition in a relatively healthy elderly population.
Plasma levels of osteocalcin associate with measures of executive functioning and cognition in older women.
Plasma levels of bone remodelling peptides associate with measures of executive functioning and cognition in older women.
Supplementary data
Supplementary data mentioned in the text are available to subscribers in Age and Ageing online.
Acknowledgement
The authors wish to thank all of the participants and staff for their involvement throughout the MyoAge project.
Conflicts of interest
None declared.
Funding
The MyoAge project was supported by a research grant from the European Union FP7 (223576).
Abbreviations
Dickkopf-1 (DKK1); Osteoprotegerin (OPG); Osteocalcin (OC); Osteopontin (OPN); Sclerostin (SOST); Parathyroid hormone (PTH); 25-Hydroxy vitamin D (25(OH)D); Bone mineral density (BMD).
References

Comments