


Abstract
Continued efforts are undertaken to develop animal models of schizophrenia with translational value in the quest for much needed novel drugs. Existing models mimic specific neurobiological aspects of schizophrenia, but not its full complexity. Here, we used proton magnetic resonance spectroscopy (1H-MRS) to assess the metabolic profile in the prefrontal cortex (PFC) of two established models, rearing in social isolation and acute N-methyl-d-aspartate receptor (NMDA-R) antagonism and their combination. Rats reared in social isolation or group housed underwent 1H-MRS at baseline and dynamically after ketamine challenge (25mg/kg, intraperitoneal) under isoflurane anesthe sia. A 7 T animal scanner was used to perform spectra acquisition from the anterior cingulate/medial PFC. LCModel was used for metabolite quantification and effects of rearing and ketamine injection were analyzed. Social isolation did not lead to significant differences in the metabolic profile of the PFC at baseline. Ketamine induced a significant increase in glutamine in both groups with significance specifically reached by the group-housed animals alone. Only rats reared in social isolation showed a significant 11% γ-aminobutyric acid (GABA) decrease. This study provides preliminary evidence that social interactions in early life predict the glutamatergic and GABAergic response to acute NMDA-R blockade. The similarity between the prefrontal GABA reduction in patients with schizophrenia and in rats reared as social isolates after challenge with ketamine suggests good potential translational value of this combined animal model for drug development.
Introduction
The complex and probably heterogeneous pathophysiology of schizophrenia remains to be elucidated, while significant therapeutic advances have been achieved based on the discovery and characterization of fundamental neurotransmitter abnormalities and their interaction. To date, all antipsychotics are dopamine D2 receptor antagonists, but there is increasing interest in the therapeutic potential of co-modulation of glutamatergic neurotransmission1,2 in particular to improve treatment of negative and cognitive symptoms. The glutamate (Glu) hypothesis has been postulated about 30 years ago based on findings that N-methyl-d-aspartate receptor (NMDA-R) blockade can induce acute psychosis in man. In healthy human subjects, ketamine produces a wide variety of transient behavioral symptoms and cognitive deficits similar to those observed in schizophrenia.3 Furthermore in patients with schizophrenia, ketamine exacerbates positive, negative, and cognitive symptoms.4 NMDA-R blockade has also been successfully used in rodents to mimic key neurobiological and behavioral aspects of the schizophrenia.5 The noncompetitive NMDA-R antagonists, ketamine and phencyclidine (PCP), induce acute psychosis and to a lesser degree behavioral change akin to negative and cognitive symptoms in rodents.6 Ketamine, in particular, is known to decrease nonaggressive behavior in the social interaction test and to disrupt latent inhibition.7
To better understand the downstream consequence of NMDA-R hypofunction, several groups have investigated acute effects of ketamine or another NMDA-R antagonist, PCP using functional neuroimaging8 or proton magnetic resonance spectroscopy (MRS) in healthy rats and humans. The proton spectroscopic study of metabolic effects of NMDA antagonism is particularly interesting as it allows comparison of ketamine-induced neurochemical changes with the well-known alterations in patients with schizophrenia.9 Such MRS studies suggest that a subanesthetic dose of ketamine leads to an elevation of glutamine (Gln) and Glu in the prefrontal cortex (PFC) in healthy volunteers.10–12 PCP also increases the prefrontal Gln/Glu ratio in rats, but no change has been observed in Gln and Glu alone.13 These first studies support the notion that NMDA antagonism induces a hyperglutamatergic state, as Gln levels are thought to index glutamatergic transmission via the neuronal-astrocytic Glu-Gln shuttle.14 A recent study investigating the PFC found elevated Glu in vivo but reduced Gln ex vivo upon subchronic treatment with subanesthetic dose of ketamine.15 These studies demonstrate that the Gln/Glu ratio may be a useful biomarker to assess acute and subchronic NMDA-R hypofunction in animals and volunteers. There are, however, to the best of our knowledge, no studies investigating the neurotransmitter effects of acute NMDA-R antagonism in patients or behavioral animal models of the disease.
While ketamine models the acute psychosis, it does not reproduce preexisting brain pathology as seen in patients at risk of schizophrenia. The latter has been attempted by several alternative experimental approaches, such as administration of the DNA-alkylating agent methylazoxymethanol acetate on embryonic day 1716 and in particular rearing rats in social isolation from weaning to mimic the known association between exposure to early-life adversity and the development of schizophrenia.17,18 This early environmental intervention not only produces developmental appearance of behaviors resembling the core symptoms seen in schizophrenia but also replicates some of the pathophysiological aspects of the disorder in rodents.18 Rearing rodents in isolation persistently alters behavior toward more withdrawn social interaction, neophobia, reduced cognitive flexibility, and dysfunctional sensorimotor gating that mimic some of the symptoms in patients with schizophrenia.18,19 Prepulse inhibition of the acoustic startle reflex is used to measure sensorimotor gating and has consistently been shown to be impaired in both isolation-reared rats20 and schizophrenic patients.21 Furthermore, isolates show alteration in dopamine D2 receptor function22 and structural changes including volume reduction in the medial prefrontal cortex (mPFC).23
Few studies have examined whether changes in glutamatergic function occur in rats reared in social isolation. Nevertheless, the NR2A NMDA-R subunit24 and NMDA R1A receptor expression25 are altered in isolates. Further, the mGluR2/3 agonist and LY379268, a selective type II metabotropic Glu receptors agonist, seem to reverse the hyperactivity and reduce the impairment seen in this model.26 Of note, a microdialysis study27 also found that prefrontal Glu release in response to type I and II metabotropic Glu receptor antagonist was only seen in animals reared in a complex environment.
NMDA-R antagonism may, however, not only act via a spatially distinct hyperglutamatergic state. In fact, there is a significant direct metabolic link between γ-aminobutyric acid (GABA) and the Glu-Gln cycle: GABA/Gln cycling represents 23% of the total neurotransmitter cycling.28 There are multiple lines of evidence for altered GABAergic transmission in schizophrenia with reduction of uptake and release of GABA,29 decreased density of GABA transporter, decreased level of glutamic acid decarboxylase (GAD), a major enzyme in GABA biosynthesis, and decreased GAD messenger RNA expression in the brain of schizophrenic patients.30,31 In line with the expected reduction of GABA levels in the PFC, spectroscopically determined in vivo GABA levels are reduced in both early stage, untreated, and treated schizophrenic patients.29,32,33
This study undertook a magnetic resonance proton spectroscopic analysis of the Glu, Gln, and GABA metabolic profile in the PFC in group-housed rats and littermates reared in social isolation, both at baseline and in response to an acute subanesthetic dose of ketamine. The hypothesis being that acute NMDA-R antagonism produce a more pronounced prefrontal Gln increase and GABA reduction, and that this effect would be enhanced by rearing in social isolation.
Materials and Methods
See online supplementary material for more details.
Results
Typical in vivo localized spectra acquired in isolates before (figure 1B) and 30minutes after the bolus of ketamine (figure 1C) are shown. For quantitative assessment, absolute concentrations of metabolites were obtained for each spectrum with the LCModel, and time courses of these concentrations were taken into consideration. Although the expected changes were hypothesized to be limited to Gln, GABA, N-acetyl-aspartate (NAA), and Glu, time courses from the other metabolites were visually inspected to determine whether obvious changes were visible; the changes seen are described in more detail below. For quality control, Cramer–Rao lower bounds (CRLB) as provided by LCModel were taken into account. Apart from postketamine injection GABA estimates, CRLB were required to be <25% for all metabolites. The rounded CRLB mean values (mean ± SD) and the values of signal-to-noise ratios (SNRs) are reported in table 1.
Cramer–Rao Lower Bounds (CRLB) and Signal-to-Noise Ratio (SNR) Values Are Reported for Isolates and Not-isolates, for Pre- and Postketamine Challenge. The First Row Reports the Numbers of Animals Belonging to Each Group
| Isolates (n = 7) | Not-isolates (n = 6) | |||
|---|---|---|---|---|
| Pre (%) (SNR = 10±0) | Post (%) (SNR = 8±1) | Pre (%) (SNR = 10±1) | Post (%) (SNR = 8±1) | |
| Gln | 11±3 | 9±2 | 11±3 | 8±3 |
| Glu | 6±2 | 6±2 | 5±2 | 6±2 |
| GABA | 19±6 | 27±5 | 19±5 | 24±6 |
| NAA | 3±0 | 3±1 | 3±0 | 3±0 |
Note: Gln, glutamine; Glu, glutamate; GABA, γ-aminobutyric acid; NAA, N-acetyl-aspartate.
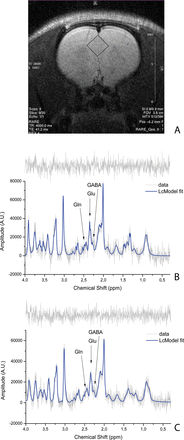
Voxel localization on rat anterior cingulate cortex (ACC) (A). Example of a correspondent baseline spectrum for isolated rat with time effect (TE) = 8ms, NSA = 128 (B). Example of a correspondent spectrum at time point KET9 with TE = 8ms, number of signal averages = 128 (C). On the top of each spectrum, the spectrum residue is shown.
No significant differences in the baseline values were observed in the neurotransmitter or other visible metabolic pool between isolation-reared and group-housed rats. The baseline mean ± SD for isolates and not- isolates are reported along with the other results for each metabolite.
γ-Aminobutyric Acid
The GABA signal was fitted in all individual rats at each time point for both housing groups. After ketamine administration, however, the GABA CRLB increased over 25%, thus implying that the GABA levels were approaching the threshold of detection.
The baseline values were not significantly different (not-isolates: 0.36±0.03; isolates: 0.36±0.03).
Figures 2A and 2B show the time courses for GABA/Cr + PCr after ketamine and saline administration. A 11% decrease in GABA levels is observed in isolated rats after ketamine challenge (time effect [TE]: F(9,108) = 1.861, P = .065; time-housing [TH] interaction: F(9,108) = 2.456, P = .013), and no effect due to the saline order was seen (time injection [TI] order interaction: F(9,108) = 0.441, P = .9). No changes were detected after saline administration (TE: F(5,60) = 0.398, P = .93; TH: F(5,60) = 0.238, P = .98; TI: F(5,60) = 0.337, P = .96;). Post hoc analysis between isolates and not-isolates revealed significant differences (Ket6: P < .05; Ket7: P < .01; Ket8 < 0.01; Ket9: P < .001).
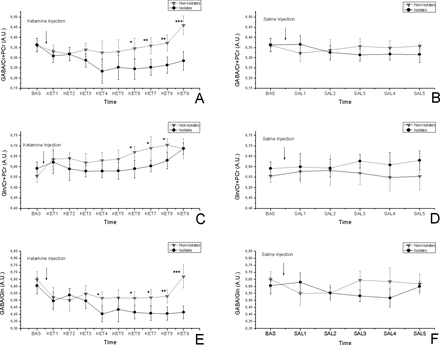
Time-resolved anterior cingulate cortex (ACC) GABA/Cr + PCr changes in isolated and group-housed rats in response to 25-mg/kg ketamine injection (A) and in response to saline (B). Time-resolved ACC Gln/Cr + PCr concentrations in isolated and group-housed rats in response to 25-mg/kg ketamine injection (C) and in response to saline (D). Time-resolved ACC GABA/Gln changes in isolated and group-housed rats in response to 25-mg/kg ketamine injection (E) and in response to saline (F). No significant changes were visible after saline injection. The asterisks indicate significant difference between the isolates and not-isolates (*P < .05, **P < .01, ***P < .001); All data are mean ± SD in both groups. The following short names are used to identify the time course points: baseline, BAS (−20 to 0 min), ketamine 1, KET1 (0–10min), KET2 (2.5–12.5min), KET3 (5–15min), KET4 (7.5–17.5min), KET5 (10–20min), KET6 (12.5–22.5min), KET7 (15–25min), KET8 (17.5–27.5min), and KET9 (20–30min). The saline (SAL) time points will follow the same timing: SAL1 (0–10min), SAL2 (2.5–12.5min), SAL3 (5–15min), SAL4 (7.5–17.5min), and SAL5 (10–20 min).
Glutamine
The baseline values were not significantly different (not-isolates: 0.55±0.03; isolates: 0.59±0.03). Figures 2C and 2D show the time courses for Gln/Cr + PCr after ketamine and saline administration. A 20% increase in Gln levels was observed in both isolate and not-isolate groups after ketamine challenge (TE: F(9,108) = 2.214, P = .026; TH: F(9, 108) = 1.899, P = .051) with no effect due to the saline order (TI: F(9,108) = 0.667, P = .737). Investigation of time-dependent variations after saline administration brought up no significant change (TE: F(5,60) = 0.453, P = .80; TH: F(5,60) = 0.774, P = .57; TI: F(5,60) = 0.659, P = .65). Post hoc analysis between isolates and not-isolates revealed significant differences (Ket6: P < .05; Ket7: P < .05; Ket8: P < .05).
GABA/Gln
Figures 2E and 2F show the time courses for GABA/Gln after ketamine and saline administration. A 20% increase in GABA/Gln ratio was detected in isolates after ketamine injection (TE: F(9,108) = 1.891, P = .06; TH: F(9,108) = 2.391, P = .016) with no effect due to the saline order (TI: F(9,108) = 0.870, P = .37). Investigation of time-dependent variations after saline administration did not show any significant changes (TE: F(5,60) = 0.321, P = .89; TH: F(5,60) = 0.723, P = .60; TI: F(5,60) = 0.559, P = .73;). Post hoc analysis between isolates and not-isolates revealed significant differences (Ket4: P < .05; Ket6: P < .05; Ket7: P < .05; Ket8: P < .01; Ket9: P < .001).
Glu and NAA
The baseline values were not significantly different both for Glu (not-isolates: 1.50±0.07; isolates: 1.62±0.08) and for NAA (not-isolates: 0.99±0.06; isolates: 0.98±0.06).
The time courses for NAA and Glu are shown in figures 3A and 3B, and time courses after ketamine and saline administration are shown in figures 3C and 3D. No change was observed in NAA after ketamine challenge, and no effect of saline was significant. On the other hand, Glu did not vary through the time after the ketamine challenge (TE: F(9,108) = 0.492, P = .876; TH: F(9, 108) = 1.071, P = .393; TI: F(9,108) = 0.795, P = .622), but it did show an increase in isolates (TE: F(5,60) = 1.862, P = .116; TH: F(5,60) = 2.629, P = .033; TI: F(5,60) = 0.532, P = .75). The post hoc analysis in the saline data revealed statistical significance between isolates and not-isolates (SAL3: P < .05; SAL4: P < .01; SAL5: P < .01).
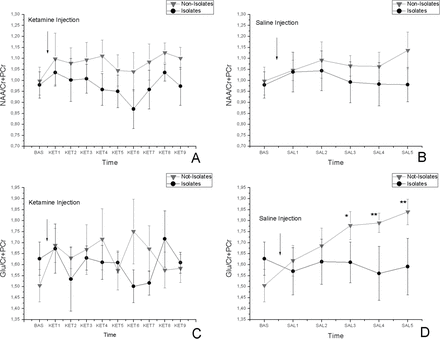
Time-resolved ACC NAA/Cr + PCr concentrations in isolated and group-housed rats in response to 25-mg/kg ketamine injection (A) and in response to saline (B). Time-resolved ACC Glu/Cr + PCr concentrations in isolated and group-housed rats in response to 25-mg/kg ketamine injection (C) and in response to saline (D). The asterisks indicate significant difference between the isolates and not-isolates (*P < .05, **P < .01, ***P < .001). All data are mean ± SD in both groups. See previous figure for the label naming.
Discussion
The main finding of this in vivo MRS study is the rearing condition–specific amino acid neurotransmitter effect of ketamine-induced NMDA hypofunction: we observed a significant increase in Gln/Cr + PCr in group-housed animals, while rats reared in social isolation showed a significant reduction in GABA/Cr + PCr.
Ketamine-Induced Prefrontal Gln Increase (in Group-Reared Rats)
Our findings of prefrontal Gln/Cr + PCr increase about 30 minutes after injection of 25mg/kg of ketamine is well in line with previous reports in rats13 and humans.10 The findings also comply well with the expected neurotransmitter pool changes in NMDA hypofunctional state that should result in glutamatergic hyperactivity. Specifically, ketamine as NMDA-R antagonist can be expected to cause NMDA-R blockade on GABAergic interneurons, which will reduce their inhibitory activity and lead to a downstream hyperglutamatergic state.34 This hyperactivity in turn is expected to result in an increased Glu transmitter pool, which is, however, masked by the larger unchanged metabolic Glu pool.35,36 Moreover, presynaptic neurotransmitter Glu is packed in vesicles further reducing its visibility by MRS. An indirect detection window comes from the fast removal of toxic Glu from the synaptic space by astrocytes where Glu is converted to Gln, a major mechanism to protect the cell from excitotoxicity. Gln is then shuttled back to the neuron and converted back to Glu thus completing the Glu-Gln shuttle. This shuttle is closely regulated in physiological conditions and, hence, spectroscopically detected Gln levels are thought to reflect the glutamatergic synaptic activity. There is good experimental evidence that Gln indeed is a good index of the turnover of the synaptic Glu involved in neurotransmission.37,38 That might also explain the conflict with the findings with another study on rats using a prolonged ketamine challenge and observing elevated levels of Glu in vivo and ex vivo.15 In fact, an increase in Gln may be the first indication of increased Glu release, whereby the latter becomes detectable as Gln is converted back to Glu.
Further indirect support for the interpretation that Gln increase reflects elevated glutamatergic transmission comes from several functional magnetic resonance imaging studies showing hemodynamic signs of increased neural activity after ketamine (BOLD signal increase)39–42 or PCP (increased cerebral blood volume).8 Importantly, also in human positron emission tomography studies, ketamine was shown to lead to frontal lobe activation indexed by increased regional blood flow and higher cerebral metabolic rate for glucose.43,44 Taken together and against the background that 80% of neuronal activity is glutamatergic in nature, these studies provide further evidence that NMDA hypofunction leads to hyperglutamatergic transmission. Interestingly, our study showed no influence of ketamine on GABA concentrations when administered to group-housed animals; similarly, an early in vivo microdialysis study using halothane as anesthetic reported unaffected GABA levels in PFC of rats after both single and repeated ketamine administration.45
Ketamine-Induced Prefrontal GABA Reduction (in Socially Isolated Rats)
In rats reared in social isolation, we found that ketamine reduced prefrontal GABA levels and also decreased the GABA/Gln ratio. GABA is the major inhibitory neurotransmitter in the central nervous system, and it is synthesized predominantly by inhibitory interneurons. These findings are well in line with a study showing that inhibition of NMDA-Rs first decreases the activity of GABA interneurons and increases the firing rate of pyramidal neurons.46 It is noteworthy that our findings on GABA changes seem to be exclusive for isolates, thus confirming in the socially isolated rats, a study on healthy volunteers in which no significant GABA change was reported after ketamine administration.12 The data are also consistent with previous reports that isolation-reared mice show an enhanced sensitivity to seizures induced by the GABA antagonist, picrotoxin,47 and developmental decreases in reelin-positive and parvalbumin-containing GABA interneurons in the PFC.48,49
The observed neurotransmitter profile of prefrontal GABA decrease resulting from acute ketamine challenge in rats reared in social isolation shows close similarity with postmortem findings in brain tissue from schizophrenic patients: a high-resolution magic spinning angle metabolomic study at 16 T on postmortem brain tissues demonstrated a significant decrease in GABA concentration in the prefrontal white and gray matter in samples from 10 patients with schizophrenia compared with a similar number of control individuals.50
The fact that we did not see GABA changes at baseline, ie, in a tonic state, but only after NMDA antagonism is also in line with the expected interaction of social isolation with other neurotransmitter systems.51 Intriguingly, GABA is known to play a key role in neural synchronization, and dysfunctional task-induced oscillatory brain activity is a hallmark of schizophrenia.52 In addition, GABA levels appear to be directly linked to brain oscillatory activity as shown in a combined electroencephalography (EEG)/MRS study in healthy volunteers.53 This may offer a molecular explanation for the recently observed differential effect of NMDA antagonism on γEEG oscillatory activity in a neurodevelopmental model of schizophrenia.54
Due to their coupled interaction, the GABA/Gln ratio as an index of GABAergic inhibition vs glutamatergic hyperactivity arguably may be more meaningful than focusing on each single metabolite separately. Despite the limitations of the temporal resolution of the dynamic spectroscopy imposed by SNR, the GABA/Gln ratio in this study suggests differential time courses occur between the rearing conditions. In fact, only in rats reared in social isolation, GABA/Gln progressively decreased probably reflecting increasing misbalance between the two metabolites after the ketamine challenge. While speculative, our findings might be explained by the deficits seen in parvalbumin-positive interneurons55,56 as well as an increased number of NMDA-R subunits24 as observed in the social isolation model. In particular, that could lead to a shift in glutamatergic and GABAergic tone compared with control animals when challenged. It is worth mentioning that, although a 13C enrichment study on mPFC of rats showed a GABA increase only in those animals subjected to low-dose ketamine administration,57 the GABA last point rise in group-housed rats remains to be elucidated.
Ketamine Induce Significantly Less Prefrontal Gln Increase in Socially Isolated Rats
Not in complete agreement to our hypothesis, we did observe a significant difference in the Gln/Cr + PCr time course between group-housed and socially isolated rats. The findings may thus suggest reduced rather than increased glutamatergic hyperactivity in social isolates after NMDA-R blockade. Similarities can be found in a microdialysis study on rearing rats in impoverished and enriched environmental condition27: Glu was reported not to change after administration of a metabotropic Glu receptor antagonist to rats reared in an impoverished environment in contrast to a significant increase in the PFC of rats reared in an enriched environment. Reduced hyperglutamatergic downstream effects after NMDA hypofunction may result from structural changes in glutamatergic neurons, such as decreased density of dendritic spines in the pyramidal cells of the mPFC, seen in postweaning isolation rats.58 Alternatively, it is conceivable that the Glu-Gln shuttle itself may be impaired due to social isolation resulting in dissociation of Gln levels and glutamatergic activity. Impaired Gln synthetase (GS) activity has in fact been found in the anterior cingulate cortex in patients with schizophrenia. Reduced GS activity will lead to decreased Glu to Gln conversion in the glia cell, and hence Gln levels may no longer index glutamatergic transmission.59 Consistently, the large body of studies on early-life stress model would support the idea of a neuroprotective response to stress-induced elevation of Glu, which reflects a downregulation of vesicular Glu transporter 1 and 2 (VGlut1 and VGlut2) along with an increased expression of excitatory amino acid transporter 2.60 Although there are differences between the two models, this neuroprotective effect might be speculated to be the cause of a mildly reduced and slower response to the ketamine administration. It might also be the reason of an absence of Glu rise due to saline injection stress in isolates and visible in our data from group-housed rats. This increase is well in line to what has been also found in other similar studies34,61 as effect of stress occurring after a saline administration.
Limitations
We did not observe prefrontal metabolite changes at baseline in rats reared in social isolation unlike findings in patients with schizophrenia. This discrepancy further highlights the challenges and limitations of current experimental approaches to model schizophrenia. While rearing in social isolation models important aspects of the disease and underlying neurodevelopmental pathology, it may not cause overt NMDA hypofunction, at least in the mPFC. Nevertheless, juvenile social isolation in conjunction with acute NMDA hypofunction induced by subanesthetic dose of ketamine produced similar GABA changes as recently identified in man.32,33,62
Two main limitations of this study certainly lies in the small sample size, and, despite the use of moving average, in the limited sampling time after ketamine challenge as related to our chosen study design. This cautions against overinterpreting the differences in the findings on Gln change in social isolates vs group-housed rats. Possible confounds in interpreting the data might also arise from the use of total Cr rather than water as internal reference, and from exploiting analytic functions to model macromolecules and lipids rather than more rigorous methods,63 ie, these signals may be separately acquired using a metabolite nulling inversion-recovery sequence. The latter is indeed less prone to overfitting issues occurring when using analytic functions. However, both of these limitations are widely accepted in many studies making use of proton in vivo spectroscopy. Furthermore, although no effect has been seen as dependent on the crossover design grouping, the usual concern about the anesthesia effects in animal imaging studies may still be considered as plausible.
Conclusions
This dynamic proton spectroscopic study shows differential effects of ketamine-induced NMDA hypofunction on prefrontal amino acid neurotransmitters in group-housed or isolated rats. Importantly, social isolates demonstrated a prefrontal GABA decrease that was not found in group-housed animals. On the other hand, the socially isolated rats showed a less and possibly slower Gln increase after ketamine challenge. This supports the concept that social isolation sensitizes animals to acute psychotic states induced by NMDA antagonism and suggests a key role for neurodevelopment dysfunction of the GABAergic/glutamatergic interplay underpinning predisposition to psychosis. In addition, the findings highlight the added translational value of a complex mechanistic animal model in conjunction with noninvasive metabolic profiling affording a unique test assay for efficacy studies in drug development for schizophrenia.
Acknowledgment
The authors have declared that there are no conflicts of interest in relation to the subject of this study.
References
