


Abstract
Low- and middle-income countries (LMICs) have been searching for effective strategies to reform their inefficient and wasteful public hospitals. Recently, China developed a model of systemic reforms called the Sanming model to address the inefficiency and waste at public hospitals. In this article, we explain and evaluate how the Sanming model reformed its 22 public hospitals in 2013 by simultaneously restructuring the hospital governance structure, altering the payment system to hospitals, and realigning physicians’ incentives. By employing the difference-in-difference (DID) method and using the hospital-level data from 187 public hospitals in Fujian province, we find that the Sanming model has reduced medical costs significantly without measurably sacrificing clinical quality and productive efficiency. The systemic reform, on average, has reduced the medical care cost per outpatient visit and per inpatient admission by 6.1% (P-value = 0.0445) and 15.4% (P-value < 0.001), respectively. It is largely accomplished through a decrease in drug expenditures per outpatient visit and per inpatient admission of about 29% (P-value < 0.001) and 53% (P-value < 0.001). These results show that the Sanming model has achieved at least a short-term success in improving the performance of the public hospitals. These findings suggest that such a systemic transformation of public hospitals, where the governance structure, payment system and physician compensation methods are aligned, are crucial to improving their performance; it holds critical lessons for China and other LMICs.
Key Messages
The Sanming model in China systemically reformed public hospitals by simultaneously restructuring the hospital governance structure, altering the payment system to hospitals and realigning physicians’ incentives.
Using the difference-in-difference method, this article finds robust evidence that the Sanming model has reduced medical costs significantly without measurably sacrificing clinical quality and productive efficiency.
The Sanming model demonstrates that a systemic reform, where the governance structure, payment system and physician compensation methods are aligned, can significantly improve the performance of public hospitals.
Introduction
Restructuring public hospitals has been put high on the agenda of many low- and middle-income countries (LMICs) since the 1980s (Preker and Harding 2003). Authors have documented that public hospitals in many LMICs are inefficient and wasteful because of the rigid bureaucratic structure and the absence of incentives to improve efficiency and quality (Jakab et al. 2002; Ramesh 2008). In the past decades, many nations introduced reform measures to improve the performance of public hospitals. Those reforms, however, were often not systemic and led to mixed consequences. For example, to address the slow responsiveness to patients’ demands, some LMICs such as China, Viet Nam, Indonesia and Ghana, implemented public hospital autonomization or corporatization policy. These reforms exacerbated the problem of affordability of hospital services because autonomous or corporatized hospitals deviated from social objectives and engaged in high-profit-margin services (Govindraj and Chawla 1996; Yip and Mahal 2008; Wagstaff and Bales 2012; London 2013). Those piecemeal reforms reflect our limited understanding of what actions can be taken to restructure the public hospitals effectively.
In 2009, China launched a comprehensive healthcare reform plan to fulfill its commitment to achieving universal health coverage by 2020 with affordable and equitable access to basic health services (Central Committee of the Communist Party and State Council 2009). Extensive positive progress has been made1 (Li 2011; Yip et al. 2012). However, China is still confronted with major challenges in reforming wasteful and inefficient public hospitals, which deliver >80% of outpatient and inpatient services in China. Like many other LMICs, China’s public hospitals suffer from distorted provider incentives and poor governance structure (Eggleston et al. 2008; Yip et al. 2012). As a result, Chinese public hospitals are impeding China’s movement toward affordable universal health coverage commitment by delivering inappropriate and less cost-effective hospital services (Yip and Hsiao 2014). Although China has experimented with dozens of pilot hospital reforms during the past 5 years, few have produced significant positive results (Zhang et al. 2016). The slow progress in reforming public hospitals is one of the least successful parts of China’s health system reform (Barber et al. 2014).Among dozens of pilot public hospital reforms, the model developed by Sanming city stood out. The Sanming model took a systemic approach by simultaneously reforming the governance structure, payment system, and physician compensation methods at all its 22 public hospitals. The positive results of the Sanming model caught the attention of the top Chinese leaders. In February 2016, Chinese President Xi Jinping gave his endorsement by commenting that Sanming had achieved demonstrable progress in reforming the public hospital system. China’s State Council immediately issued a policy that the Sanming model would be replicated nationwide (State Council 2016).
This article explicates the Sanming model and provides a rigorous evaluation of the impacts of the systemic reform. We use the difference-in-difference (DID) method to evaluate the impacts of the Sanming model by comparing the performance of public hospitals in Sanming city with that of public hospitals in other cities of the same province that have not adopted these measures. We find robust evidence that the systemic reform in Sanming has reduced medical costs substantially without measurably sacrificing clinical quality and productive efficiency. These results show that Sanming’s transformation has at least achieved a short-term success in improving the performance of public hospitals. Our finding implies that a systemic reform where the governance structure, payment system, and physician compensation methods are aligned can significantly improve the performance of public hospitals.
Context: China’s public hospitals and systemic reforms in Sanming
The Chinese government vastly underfunded the public hospitals when it embarked on its economic reform in 1978. Government subsidies for public hospitals fell from 40 to 50% of the facilities’ total expenditures before the economic reform to a mere 10% in the early 1990s (Blumenthal and Hsiao 2005). However, under the fee-for-service payment system, the government wanted to make the services affordable to patients, so it continued to set service charges below actual costs. Meanwhile, public hospitals had to survive financially. The government adopted a strategy to allow hospitals to make profits from prescribing/dispensing drugs and providing high-technology tests. Consequently, hospital directors managed their hospitals by tying physicians’ and staff’s compensation to the profits they generated, leading to widespread over-prescription of drugs and overuse of diagnostic tests (Blumenthal and Hsiao 2015). Currently, the normal compensation (basic salary) to physicians in public hospitals only makes up one-third of their total compensation, and the other two-thirds comes from bonuses derived from profits (Li et al. 2015).
Meanwhile, Chinese public hospitals suffer from poor governance structure. Public hospitals face as many as sixteen administrative agencies that govern the hospitals. Particularly, the Department of Health has the power to determine the supply of health services and control clinical quality; the Finance Department has the power to set financial rule that governs hospitals; the Department of Social Insurance has the power to set payment policies for hospital services; the Development and Reform Commission has the power to set prices for drugs and health services; and the Organization Department has the power to hire and appoint hospital directors. The governing rules issued by various departments are often contradictory in purposes and goals (Yip et al. 2012). For example, the Ministry of Health wants public hospitals to be strong and to expand, but the Department of Social Insurance implements different payment policies to contain hospital expenditures.2 The Finance Department pushes hospitals to reduce waste and improve efficiency, but distorted prices set by the Development and Reform Commission encourage physicians to overprescribe tests and drugs. The Health Department desires to improve the management by employing professional hospital directors, but the Organization Department gives most priority to political loyalty. Consequently, what objectives the public hospitals should pursue are unclear, other than hospitals are self-motivated to survive and thrive. The government cannot hold public hospitals to be accountable for efficiency and effective treatment of patients.
Moreover, the hospitals are given little autonomy to manage its human resources. For instance, civil service rules do not give hospital directors the power to hire and fire personnel. It inevitably results in the inability of hospital directors to optimize the skill mix of hospital staff. Under these circumstances, the government cannot establish any meaningful criteria for good performance and hold the directors accountable.
Since 2012, the Chinese government has given priority to reforming its inefficient and wasteful public hospitals through various approaches, but the early appraisals of these approaches are not very encouraging. For example, removing the 15% markup on drugs, the core strategy to reform Chinese county-level hospitals, has not reduced the total medical expenditures because it has led to rising diagnostic test costs and longer hospital stays (Xiao et al. 2013; Yi et al. 2015). The result suggests that when policies to reform public hospitals are piecemeal and uncoordinated, physicians and hospitals can circumvent the regulations and continue to generate profits to compensate themselves.
Sanming, a prefecture-level city in Fujian province with 22 public hospitals in total in its jurisdiction, launched its systemic reforms at all public hospitals in January 2013. The Gross Domestic Product (GDP) per capita for Sanming in 2012 was about ∼$8500, which was economically middling by Chinese standards and ranked the fifth among the nine cities of Fujian province. It was faced with the challenge of rapid aging as young workers moved to more prosperous cities in Fujian and beyond, which led to significant deficits of the medical insurance fund. Encouraged by the central government to conduct the policy experimentation in the health sector, the Sanming government initiated its systemic reform to control health expenditure growth, and ensure affordability of health care services.
Sanming developed a systemic reform plan that covered three crucial areas of public hospitals: the governance structure, payment system to hospitals and physician compensation methods. Almost all the reform measures in the three areas were implemented simultaneously. Moreover, unlike other reforms in China that were implemented gradually, all public hospitals were covered at the same time, and they were exposed to the same measures. In short, there was no variation in the implementation among the hospitals in Sanming for 2 years, until the end of 2014. Table 1 describes the details of these reforms.
The details of reform strategies in Sanming
| Reform strategies in Sanming | |
|---|---|
| Governance structure | |
| The Dispersion of Power among Government Departments | A commission chaired by the deputy mayor was established to address the dispersion of power between government departments. This commission took charge of overall healthcare reform in Sanming. Specifically, the commission held responsibility for issuing the guidelines of infrastructure construction, equipment and drug procurement, hospital management, and physician compensation. It was also responsible for the operation of three social insurance schemes. |
| The Role of Hospital Directors | (a) Directors became more autonomous in human resource management. They had more freedom to hire new staffs, fire unqualified employees, and even appoint vice-directors of hospitals. |
| (b) The salaries of hospital directors were no longer based on individual hospital revenue. A performance measurement system was introduced to rate the performance of directors based on four categories of indicators, including operation safety, clinical quality, facility development, and cost control. Indicators reflecting cost control were given the greatest weight. After the reform, the annual payment to a director was based solely on hospital performance relative to targets set in advance. | |
| Financial incentives | |
| Payment to Hospitals | (a) The prices for basic medical services were adjusted upward on the basis of cost. The prices for high-tech diagnostic tests and drugs were reduced. For example, the price of CT scanning declined by 15%. |
| (b) The purchasing prices of drugs were reduced significantly, largely through negotiation between insurance plans and pharmaceutical companies. In addition, ‘two invoice system’ was introduced to streamline drug supply chains (see footnotes for more details). | |
| (c) The previously allowed 15% profit margin on drugs was removed so that the official linkage between drug sales and hospital surplus was disconnected. | |
| (d) A case-based payment method involving about 30 selected diseases was introduced to assure medical quality and to control cost growth. | |
| Physician Compensation Methods | Physicians’ income was unlinked from ‘profit’ that they produced. Physicians were paid a basic salary plus a bonus based on performance. The bonus is based on seniority, the quantity of services provided, the quality of medical services, and the achievement of strategic targets such as controlling cost inflation. Specifically, ‘Annual income = physician’s annual standardized workload points × the value of each standardized workload point’. Each work item was assigned with various standardized points based on the workload or difficulty and the seniority of a physician. ‘The value of each standardized workload point = the revenue of basic medical services × wage factor × director’s assessment score× 1.4 ÷ the sum of physicians’ standardized workload points per hospital’. Based on this plan, physicians’ income was not only determined by individual workload, but also was tied to the results of strategic targets. |
First, Sanming reformed the governance structure to address the weak and fragmented leadership. It consolidated the dispersion of power to set health policies and govern public hospitals among various departments into one commission. The commission was chaired by the deputy mayor. It enabled the government to develop a set of coherent social objectives for public hospitals and hold hospital directors to be accountable for their performance. The commission also took charge of the strategic planning and strategic purchasing. For example, the new commission held the responsibility for issuing the guidelines of infrastructure construction, equipment and drug procurement, compensation methods for physicians at hospitals etc. This consolidation laid a foundation for implementing complex reforms more smoothly.
Equally important, hospital directors were given greater autonomy to run their hospitals, especially in managing human resources. Specifically, they had more freedom to hire new staff, fire unqualified employees, and even appoint vice-directors of hospitals. At the same time, to hold directors accountable for the performance of public hospitals, the commission introduced a new performance measurement and reward system. This system no longer linked the salaries of directors to the individual hospital revenue. Instead, the performance measurement system rated the performance of directors based on four categories of indicators with cost control given the greatest weight. The annual compensation of a director was solely based on hospital performance relative to the targets and goals set by the commission in advance. It is expected that hospital directors would have less incentive to make profits by encouraging physicians to over-prescribe and -test.
Next, Sanming altered the payment rates for hospital services. The distorted price schedule was modified to reflect more the cost of physician’s labour input for a service. The prices for physician services that require time and skills were increased. The prices for high-tech diagnostic tests were reduced moderately. The purchasing prices of drugs were reduced significantly, largely through negotiation between insurance plans and pharmaceutical companies and the ‘two invoices’ system.3 At the same time, the previously allowed 15% profit margin on drugs was removed so that the official linkage between drug sales and hospital surplus was disconnected. Additionally, a case-based payment method, involving about 30 diseases, was implemented to control inpatient hospital costs and assure clinical quality. After these reforms, over-prescription and -test would be less profitable. Therefore, it is expected that the drug sales and the expenditure of test would decline significantly.
Last, Sanming took actions to alter the physician compensation methods by delinking the physician income from ‘profits’. Instead, physicians were paid a much higher basic salary plus a bonus based on performance. The legal income of physicians has substantially increased. Specifically, the bonus is based on seniority, the quantity of services, the quality of care, and the achievement of strategic targets such as controlling cost inflation. Hence, the new compensation to physicians was divorced from drugs and tests that physicians would prescribe.
Based on these reform measures, we expect that the Sanming model as a whole would significantly reduce the health expenditure, especially the drug cost. However, we are unsure of its impact on healthcare utilization and clinical quality without empirical evidence. Next, we will implement the econometric analysis to investigate the overall impacts of the Sanming model empirically.
Methods
Study design and data sources
Sanming introduced systemic changes simultaneously at all public hospitals in 2013. Thus, we regard 22 hospitals in Sanming as our treatment group, while 165 hospitals in other eight cities of Fujian province (Fuzhou, Xiamen, Putian, Quanzhou, Zhangzhou, Nanping, Longyan, Ningde) are treated as controls.4 Our basic study design is to compare changes in medical expenditures, the provision of medical services, and the medical quality at public hospitals in Sanming to the control group, where there were no systemic changes in 2013 and 2014.5
The main data used in this article are from three sources: Annual Statistical Report on China’s Public Hospitals, Annual Report on Medical Quality for Sanming’s Hospitals, and Fujian Statistical Yearbook (FSY). The Annual Statistical Report on China’s Public Hospitals contains extensive hospital-level information on health costs, the provision of medical services, and medical resources ranging from 2003 to 2014. We use total expenditures per outpatient visit, total expenditures per inpatient admission, the drug cost per outpatient visit, the drug cost per inpatient admission, drug sales as a share of total expenditures, outpatient visits, inpatient admissions, bed occupancy rates, and days per inpatient admission as our dependent variables. All expenditure variables in the article are converted to 2008 yuan (CN¥) using the CPI. In order to investigate the effect of Sanming’s reforms, we limit our sample to all 187 public hospitals in nine cities of Fujian province between 2008 and 2014. The Annual Report on Medical Quality for Sanming’s hospitals contains hospital-level information on the medical quality at Sanming’s public hospitals between 2008 and 2014. Measures of the patient satisfaction rate,6 the nosocomial infection rate,7 the surgical incision healing rate,8 the success rate of first aid in the emergency room,9 the number of senior physicians per hospital,10 and the number of physicians with a master’s degree or higher per hospital11 are included. The FSY contains social and economic statistical data for each city or county from 2008 to 2014. The following indicators are selected as control variables: GDP per capita, year-end resident population, public revenue per capita, public expenditures on education per capita, respective output in the primary industry and secondary industry as a share of GDP.12 We match these control variables with our hospital-level data to construct our analysis sample, using the unique city or county code.
Econometric analysis
The subscript i indicates the hospital and t indicates the year. Yit represents the dependent variables: medical expenditure indicators and service volume indicators. Because there is considerable variation in size across hospitals in Fujian province, the data of dependent variables in the article is right-skewed (see Supplementary Figure S1). A level specification would constrain the outcomes to grow by the same absolute amount by each year which makes the empirical results less robust (Hansen 2017). Following the previous literature on the hospital market (Finkelstein 2007; Kondo and Hitoshi 2013), all the variables in this article are estimated in logs except drug sales as a share of total expenditures. αi is a series of a hospital’s individual fixed effects that controls for the unobserved time-invariant individual heterogeneity across hospitals. γt represents a vector of year dummies that is used to control for flexible year effects. εit refers to the error term. Standard errors are clustered at the county level.
The key variable of interest is Reformit. It is a dummy variable indicating the reform status (i.e. it equals 1 for years after 2013 and equals 0 for years before 2013 if a hospital is in Sanming; it equals 0 for all years if a hospital is not located in Sanming). The coefficient, λ, captures average effects of the reform on the outcome, Yit.Xit is a set of covariates, including GDP per capita, year-end permanent population, public revenue per capita, public expenditures on education, output in the primary industry as a share of GDP, and output in the secondary industry as a share of GDP.
Results
Summary statistics
Figure 1 compares the time series patterns of six key variables between the treatment group and the control group. As shown in Figure 1, the trends of hospital outcome for Sanming are similar to the trends for other cities in Fujian before the reform was initiated, though there are significant gaps between two groups. That is, there are no heterogeneous trends between Sanming and the control group, which to a large extent guarantees that implementing DID method is plausible. Moreover, it is easy to observe that trends for Sanming’s hospitals in terms of medical expenditures drop sharply after the 2013 reforms, while their trends regarding the provision of medical services remain parallel with the trends of other cities in Fujian. Based on these patterns, we conjecture that the systemic reforms in Sanming may have impacts on reducing health expenditure.
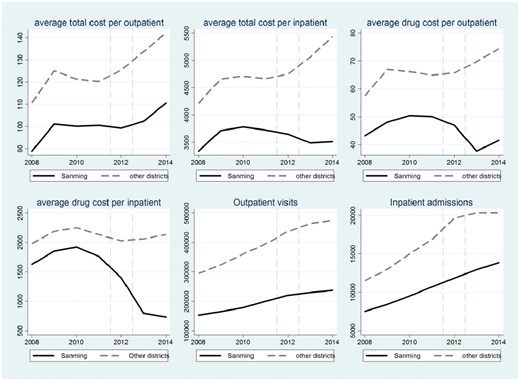
The time trends of six variables measuring medical costs and service delivery. The solid lines refer to the time trends of relevant variables for Sanming, while the dash lines refer to the time trends for other cities in Fujian province
Table 2 provides detailed information on changes in hospital outcomes between the period before the reform (2008–12) and after the reform (2013–14), in which statistical information on hospitals in Sanming (treatment group) and other cities of Fujian province (control group) is reported respectively. As Table 2 shows, the average value of medical cost per outpatient increased slightly over time for hospitals in both Sanming and other cities of Fujian province. However, the average value of medical cost per inpatient for hospitals in Sanming drops moderately before vs after 2013, while hospitals in other cities of Fujian experience a moderate increase in inpatient expenditure during the same period. The magnitude of the reduction in drug costs is striking. For example, drug sales as a share of total expenditures decline from about 48% in the period of 2008–12 to about 27% in the period of 2013–14, while the value for hospitals in other areas remains above 45% in the period of 2013–14. As for the provision of services, we find that all related variables increase for both Sanming and other cities, and the gap between them does not significantly change over time. Table 2 also shows the descriptive statistics for control variables. Based on the t-statistics in columns (4) and (7), we find that there are not major changes in the gaps between Sanming and other cities regarding economic and social development, though there is a significant difference between Sanming and their control group before the reform. It implies that there are no heterogeneous trends in term of social indicators between Sanming and their control group.
Summary statistics
| Variables | 2008-2012 | 2013-2014 | ||||||||||
|---|---|---|---|---|---|---|---|---|---|---|---|---|
| (1) | (2) | (3) | (4) | (5) | (6) | (7) | ||||||
| Overall | Sanming | Other regions | t-value: (2)-(3) | Sanming | Other regions | t-value: (5)-(6) | ||||||
| Mean | SD | Mean | SD | Mean | SD | Mean | SD | Mean | SD | |||
| Panel 1: Medical care expenditures (CN¥) | ||||||||||||
| Total expenditures (10K) | 14 321 | 26 009 | 5349 | 7070 | 11 965 | 21882 | −3.146*** | 9772 | 11044 | 23633 | 36214 | −2.520** |
| Medical care cost per outpatient visit | ||||||||||||
| Total cost | 122.6 | 60.79 | 97.96 | 25.41 | 120.6 | 62.08 | −2.789** | 106.4 | 23.5 | 138 | 65.69 | −3.160*** |
| Drug cost | 63.97 | 38.33 | 47.79 | 13.33 | 64.27 | 39.87 | −4.230*** | 39.68 | 12.1 | 72.11 | 39.67 | −5.382*** |
| Medical care cost per inpatient admission | ||||||||||||
| Total cost | 4645 | 3354 | 3641 | 1321 | 4601 | 3434 | −2.890*** | 3500 | 1137 | 5252 | 3706 | −3.113*** |
| Drug cost | 2044 | 1757 | 1723 | 656.8 | 2126 | 1855 | −2.258** | 781.3 | 318.5 | 2133 | 1813 | −4.929*** |
| Drug cost as a share of total cost (%) | 46.54 | 11.55 | 47.68 | 7.093 | 48.33 | 11.15 | −0.809 | 27.2 | 4.51 | 44.51 | 11.66 | −10.23*** |
| Panel 2: Medical service utilization | ||||||||||||
| Outpatient visits | 369 607 | 466 474 | 183153 | 142440 | 362279 | 458584 | −4.067*** | 233464 | 191507 | 469362 | 551107 | −2.813*** |
| Inpatient admissions | 15 981 | 15 894 | 9591 | 8187 | 15214 | 14817 | −3.894*** | 13377 | 12234 | 20299 | 19382 | −2.326** |
| Bed occupancy rate (%) | 88.33 | 21.4 | 87.26 | 15.13 | 89.49 | 22.75 | −0.999 | 81.37 | 16.73 | 86.59 | 20.76 | −1.721* |
| Days per inpatient | 10.48 | 10.11 | 9.476 | 2.341 | 10.68 | 10.06 | −1.247 | 8.39 | 1.36 | 10.59 | 12.28 | −1.204 |
| Panel 3: Medical care quality | ||||||||||||
| Patient satisfaction rate | 93.82 | 4.659 | 95.05 | 3.744 | ||||||||
| Nosocomial infection rate | 1.898 | 1.341 | 1.203 | 0.860 | ||||||||
| Surgical incision healing rate | 91.04 | 22.99 | 91.43 | 23.18 | ||||||||
| success rate of first aid | 89.41 | 7.149 | 88.26 | 12.32 | ||||||||
| Number of senior physicians | 7.895 | 10.92 | 11.60 | 14.04 | ||||||||
| doctors with master’s degree or above | 4.305 | 14.93 | 7.211 | 22.07 | ||||||||
| Panel 4: Control variables | ||||||||||||
| GDP per capita (¥) | 43343 | 17211 | 37771 | 14962 | 39253 | 16117 | −1.107 | 54616 | 14877 | 53447 | 15815 | 0.532 |
| Permanent resident population (10K) | 104.6 | 108.6 | 24.59 | 10.98 | 111.7 | 103.8 | −8.792*** | 24.12 | 10.80 | 125.8 | 127.4 | −5.288*** |
| Public revenue per capita | 2563 | 1929 | 1688 | 1010 | 2489 | 1987 | −4.145*** | 2325 | 847.7 | 3072 | 1998 | −2.450*** |
| Educational expenditure per capita | 866.7 | 341.5 | 853.6 | 268.2 | 761.9 | 270.4 | 1.712* | 1289 | 439.2 | 1063 | 370.1 | 1.897* |
| Primary industry output as a share of GDP | 13.74 | 7.140 | 17.64 | 1.814 | 12.50 | 6.863 | 2.377** | 21.02 | 5.452 | 14.36 | 7.952 | 3.221*** |
| Secondary industry output as a share of GDP | 48.18 | 6.534 | 48.82 | 1.918 | 48.63 | 6.711 | 0.116 | 46.36 | 5.948 | 47.13 | 7.039 | −0.252 |
Notes: Data in Panels 1 and 2 are taken from Annual Statistical Report on China’s Public Hospitals. Data for Panel 3 come from Annual Report on Medical Quality for Sanming’s Hospitals. All variables in Panels 1–3 are measured annually at the hospital level. Data on control variables are from the Fujian Province Statistical Yearbook. Column (4) reports the results of t-test of difference between Sanming and their control group during the period of 2008–12. Column (7) reports the results of t-test between Sanming and their control group during the period of 2013–14. ***, ** and * denote the significance at the 1, 5 and 10% level, respectively.
Results from econometric analysis
In this section, we present the DID results based on the log-linear regression models. Table 3 shows the estimated effects of Sanming’s reform on various medical expenditure variables: total expenditures per outpatient visit, total expenditures per inpatient admission, drug cost per outpatient visit, drug cost per inpatient admission and drug sales as a share of total expenditures. The coefficients on these dependent variables clearly indicate that systemic reforms in Sanming have reduced medical costs substantially, both for outpatient and inpatient care. To be specific, the reforms, on average, have reduced medical care cost per outpatient visit and per inpatient admission by 6.1% (=1−exp−0.0628, P-value = 0.0445) and 15.4% (=1–exp−0.168, P-value < 0.001), respectively, as shown in columns (1) and (3). Furthermore, columns (2) and (4) show that the drug cost per outpatient visit and per inpatient admission has been reduced by 29.2% (=1−exp−0.346, P-value < 0.001) and 56.1% (=1−exp−0.823, P-value < 0.001), respectively. As a result, drug expenditure as a share of total expenditures drops by about 17% points (P-value < 0.001). Not surprisingly, the magnitude of the drop in total expenditures is smaller than the drug cost because the prices for basic medical services have been increased. The net negative effects on total medical expenditures indicate that although the prices for basic medical services have been increased, reforms in Sanming have succeeded in slowing down the growth of medical expenses through controlling drug expenditures.
Impact of reforms on medical expenditures
| (1) | (2) | (3) | (4) | (5) | |
|---|---|---|---|---|---|
| Variables | Log (total cost per outpatient visit) | Log (drug cost per outpatient visit) | Log (total cost per inpatient admission) | Log (drug cost per inpatient admission) | Drug sales as a share of total health cost |
| Reform | −0.0628** | −0.346*** | −0.168*** | −0.823*** | −16.89*** |
| (0.0311) | (0.0477) | (0.0305) | (0.0451) | (0.992) | |
| Individual fixed effects | Y | Y | Y | Y | Y |
| Yearly fixed effects | Y | Y | Y | Y | Y |
| Covariates included | Y | Y | Y | Y | Y |
| R-square | 0.559 | 0.288 | 0.421 | 0.545 | 0.615 |
| Observations | 1,243 | 1,243 | 1,242 | 1,242 | 1,243 |
Notes: Standard errors clustered at the county level are reported in parentheses. Covariates include indicators of GDP per capita, public revenue per capita, public educational expenditures per capita, permanent resident population, the output in the primary industry as a share of GDP, and output in the secondary industry as a share of GDP. All control variables are measured at the county-level. ***, ** and * denote the significance at the 1%, 5%, and 10% level, respectively.
We also investigate the effect of Sanming’s reforms on the spending of diagnostic tests per outpatient visit and inpatient admission. We find that the reforms have insignificant effects on the spending of diagnostic tests (see Supplementary Table S1). In other words, hospitals in Sanming did not provide a significantly rising number of diagnostic tests to make up for the loss from decreasing drug sales. In addition, the estimated coefficient on fiscal subsidies is negative and insignificant (also see Supplementary Table S1), which indicates that decreases in outpatient and inpatient cost are driven by systemic changes in provider incentives and governance structure rather than by the increase in public funding.
Given the remarkable shrinkage in medical expenses, it is necessary to examine the changes in the provision of services and medical quality. It is entirely possible that reforms might result in some negative effects like a reduced quantity of medical services provided or decreasing medical quality. Therefore, we cannot make a conclusion simply based on a reduction in health costs. Only if the reforms do not significantly lower the levels of service quantity and medical quality, can we conclude that reforms help ease patients’ burdens and make healthcare more affordable.
Table 4 presents the estimation results for the provision of medical services in public hospitals: the number of outpatient visits, the number of inpatient admissions, the bed occupancy rate, and days per inpatient. As shown in column (1), the coefficient indicates that the reforms have reduced the number of outpatient visits moderately, by about 9.0% (=1−exp−0.0948, P-value = 0.0236). However, the estimation results in columns (2) to (4) show that there are insignificant effects on the changes in inpatient admissions, the bed utilization rate, and days per inpatient. These mixed results make it difficult to reach a conclusion on whether reforms in Sanming have led to any side-effect on the productive efficiency of public hospitals. It is unclear whether the reduction in outpatient visits is attributable to fewer repetitive visits or to a loss of patient base. To explore the underlying cause of the decrease in outpatient visits, we examine the effect of the reforms in Sanming on outpatient visits to private hospitals using the city-level aggregated data. If the decline in outpatient visits is due to lower productive efficiency of physicians, we would expect to find an increase in outpatient visits at private hospitals. As shown in Supplementary Table S1, the coefficient for private hospitals is small and insignificant. To sum up, we believe that the provision of medical services has not been affected by the reforms measurably.
Impact of reforms on provision of medical services
| (1) | (2) | (3) | (4) | |
|---|---|---|---|---|
| Variables | Log (outpatient visits) | Log (inpatient admissions) | Log (bed occupancy rate) | Log(days per inpatient) |
| Reform | −0.0948** | −0.0817 | −0.0536 | −0.456 |
| (0.0410) | (0.0510) | (0.0408) | (0.537) | |
| Individual fixed effects | Y | Y | Y | Y |
| Yearly fixed effects | Y | Y | Y | Y |
| Covariates included | Y | Y | Y | Y |
| R-square | 0.619 | 0.590 | 0.057 | 0.066 |
| Observations | 1,243 | 1,242 | 1,242 | 1,243 |
Notes: Standard errors clustered at the county level are reported in parentheses. Covariates and variable definitions are the same as those in Table 3. ***, ** and * denote the significance at the 1, 5 and 10% level, respectively.
Figure 2 shows the time trends of medical-quality measurements for Sanming’s hospitals by exhibiting the coefficients of the yearly variables estimated from the linear regression model. For convenience, we set 2008 as the reference year. Each graph in Figure 2 successively depicts the annual trends on the patient satisfaction rate, the nosocomial infection rate, the surgical incision healing rate, the success rate of first aid. We observe that the rate of patient satisfaction and the success rate of first aid increase over time, but both of the coefficients are not significant in most years at the 5% significance level, which indicates that the patient satisfaction rate and first aid success rate have not experienced a significant decrease. The time trend for nosocomial infection rate decreases over time, and there is no turning point in the trend, which indicates that the nosocomial infection rate has not been affected by the reforms. As for the surgical incision healing rate, a drop is observed in 2011 and 2012, but it has been increasing since 2013. Figure 2 also exhibits the results for the number of senior physicians and the number of physicians with master’s degrees or above, which are indirect indicators of medical quality. The increasing trend in the number of senior physicians and the number of physicians with master degrees or above indicate that they are also not affected by the reforms. All these results suggest that there is no strong evidence to prove that clinical quality has decreased due to the reforms.
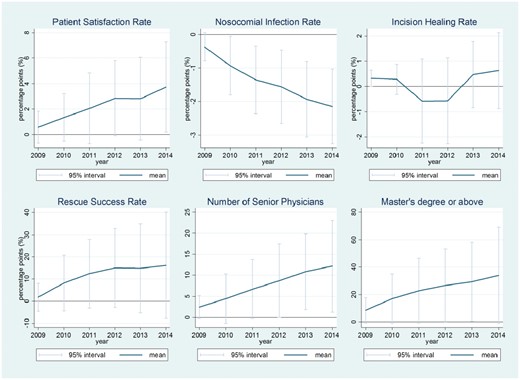
The time trends of medical-quality variables for Sanming from 2008 to 2014. The solid line in each graph indicates the patterns of coefficients λt in Equation (2) relative to the reference year (2008). The vertical lines indicate the 95% CI of each coefficient relative to the reference year
Robustness
Readers may have a concern that our results suffer from the selection bias upfront. In this subsection, we mainly address this concern. Given the design and the implementation of the Sanming model, we expect that selection bias may not be a big issue in this study. First, the graphic evidence in Figure 1 shows that Sanming exhibited a pattern of hospital outcomes similar to those in the control group before the reform in 2013, though there was a significant difference between hospitals in Sanming and other cities of Fujian. To a large extent, it guarantees that our study has identified the cause effects. Second, there was no variation in the timing of implementing reforms within the hospitals in Sanming. The reform covered all public hospitals in Sanming at the same time. Also, hospitals in Sanming were exposed to the same components of the reforms. Third, Sanming is not an outlier in term of economic development and political status. In 2012, the GDP per capita for Sanming ranked the fifth among the nine cities of Fujian province. When compared with Fuzhou and Xiamen that are sub-provincial cities, Sanming is a common prefecture-level city. The provincial government of Fujian does not set different criteria for assigning officials in Sanming.
We implement three robust tests to check whether our results suffer from the problem of selection bias. The first test is to compare trends in outcomes before the reform was initiated. It is an indispensable test when carrying out a DID method, which is strongly recommended by econometrists (Angrist and Krueger 1999). The rationale of the test is that if the early regression results are driven by selection bias (some unobserved, time-varying heterogeneities between the treatment and control groups), then these heterogeneities will lead to a placebo result similar to the early results (Bertrand et al. 2004). Here we use observations of the 2008–12 samples and classify hospitals to a treatment group or control group according to whether it is in Sanming. We assume that the reforms happened in 2010, instead of 2013.13 The second placebo test follows the idea of permutation test (Abadie et al. 2010), in which we reassign the treatment status to one of the other eight cities iteratively, keeping Sanming in the control group. That is, we proceed as if every other city in the control group would have experienced systemic changes in 2013, instead of Sanming. As shown in Supplementary Tables S2 and S3, we find that the relevant estimates of placebo tests are either insignificant or have conflicting signs, which suggest that our primary findings are driven by Sanming’s reform strategies rather than by some unobservable variables.
The estimated results of PSMDID are shown in Supplementary Table S4. We can observe that the estimated coefficients of PSMDID are quite similar to the results of DID. These results imply that the results of DID in our study are robust.
In addition, we exclude hospitals in Fuzhou and Xiamen from our sample to test whether our early results are driven by the special trends in Fuzhou, which is the provincial capital, and Xiamen, which is the only deputy-provincial-level city in Fujian. Estimates in Supplementary Table S5 are similar to estimates in the early main regressions.
Admittedly, we cannot claim that we have completely excluded the possibility of selection bias, even though we do our best to address this problem and all existing results of robust checks do not find any evidence of selection bias. Consequently, readers should treat the empirically results with caution, especially when applying the Sanming model in another context. However, this limitation does not reduce the significance of this study because explicating this systemic reform in China holds important lessons for China and other LMICs. Moreover, this article has another three limitations. First, the analysis relies on government administrative health data which are known to be sometimes problematic. Although there is no way for us to validate the data used in this article, the quality of data is somehow guaranteed because the data is partly based on financial records. Also, the Ministry of Health improved the quality of data by implementing checking online. Second, due to the limitation of data, the analysis of quality of care does not rely on DID method. Thus, the conclusions from this analysis should be more cautious. Third, this article only investigates the short-term impacts of the Sanming model. Studying its long-term impacts needs more data and empirical strategies. All these limitations should be addressed in the future research.
Discussion and conclusion
With the aim of delivering affordable high-quality health services to all people, the Chinese government has spent additional billions of dollars of public revenues to expand health insurance coverage since 2009. However, the people did not benefit that much because a large portion of the additional resources went to increase the revenue of medical providers, the profit of pharmaceutical companies, and the income of physicians (Yip and Hsiao 2014). Chinese profit-driven public hospitals are delivering inappropriate and less cost-effective hospital services that waste scarce national resources. Although the Chinese government has tried many pilot programmes to reform its public hospital system and control its soaring health expenditure since 2012, most of these pilot reforms have not yielded significantly positive results because they are piecemeal remedies.
This article explicates and evaluates the Sanming model in China—a model of the systemic reform of public hospitals. By employing the DID method and the time-series analysis, this article finds robust evidence that reforms in Sanming have reduced medical costs substantially without measurably sacrificing medical quality and quantity of services. The Sanming model has reduced the medical care cost per outpatient visit and per inpatient admission by 6.1% (P-value = 0.0445) and 15.4% (P-value < 0.001), respectively. It is largely accomplished through a decrease in drug expenditures per outpatient visit and per inpatient admission of about 29% (P-value < 0.001) and 53% (P-value < 0.001). These results show that the Sanming model has at least achieved a short-term success in improving the performance of public hospitals.
The Sanming model holds critical lessons for China and other LMICs. The inefficiency and waste of public hospital services may be caused by systemic problems rather than just underfunding which is often cited as the cause. Although public hospitals have to be adequately funded, this does not assure the resources will be allocated efficiently and effectively. World Health Organization has made a broad statement that the inefficiency rate of the health system is about 20–40% in LMICs (Chisholm and Evans 2010).
Large hospitals are complex organizations. Public hospitals’ performance depends on external and internal components. Externally, governance and organizational structure influence the behaviours of hospital executives and hospital performance. Payment incentives to the hospitals and competition confronting the hospitals also influence hospital behaviours. Internally, the incentives to hospital physicians and medical staff influence clinical practices directly (Arrow, 1963). The theory of managerial economics tells us that all these external and internal components have to be aligned properly (Brickley et al. 1995). Prominent health experts have attributed the failure of public hospitals in some LMICs to the inconsistent design that created dysfunctional organizations (McPake 1996; Jakab et al. 2002). Currently, researchers pay more attention to incentives but have not given adequate attention to the governance and the organizational structure of public hospitals.
The Sanming model demonstrates that a systemic reform can significantly improve the performance of public hospitals. China and other LMICs can examine what components the Sanming model has reformed and aligned to achieve its results. These components at least include an effective governance structure that sets clear social goals for public hospitals, autonomous decision rights of directors to manage hospitals, accountability system for directors, rational payment method and rates to hospitals, and hospitals’ internal financial incentives that motivate physicians to deliver value-based care. An absence of anyone of these components may cause failure in the performance of public hospitals.
Supplementary Data
Supplementary data are available at Health Policy and Planning online.
Acknowledgements
We would like to thank Xiaoyan Lei, Tianyang Xi, Wei Huang and seminar participants at Peking University and Harvard University. We acknowledge the assistance of Health and Family Planning Commission of Sanming (HFPCS) in providing data analysed in this article. The opinions expressed in this article and any errors are those of authors alone.
Conflict of interest statement. None declared.
Footnotes
Progress includes the coverage of more than 95% of the Chinese population by three major social health insurance schemes, the strengthening of primary care delivery and the equalization of access to public health services across both rural and urban areas.
China has three major social health insurance schemes: the rural new cooperative medical scheme the urban resident basic medical insurance and the urban employee basic medical insurance.
To address the problem that drugs prices were marked up at multiple levels in the supply chain, Sanming introduced a ‘two invoices’ system to streamline drug supply chains. The medical insurance fund in Sanming would only pay out if only ‘two invoices’ were produced: from manufacturer to the distributor, and from the distributor to the hospital. In this way prices could be tracked at each stage of the supply chain.
In our dataset, the number of public hospitals in Fuzhou is 42, 10 in Xiamen, 9 in Putian, 28 in Quanzhou, 22 in Zhangzhou, 22 in Nanping, 16 in Longyan, and 16 in Ningde.
The pilot reforms of county hospitals issued by the central government involved ∼10 hospitals in the control group. Though the national pilot reforms only removed the previously allowed 15% profit margins for drug sales in pilot county hospitals, its aim is similar with the reforms in Sanming. Thus, regarding the hospitals under national hospital reform as controls would not affect the robustness of the empirical results in this study, because it is only possible to underestimate the impacts of the Sanming model.
Patient satisfaction rate = patients who satisfy the hospital services/all patients who are surveyed × 100%. This indicator is used to measure the subjective feeling of patients at a hospital.
The nosocomial infection rate is calculated by dividing the number of infections acquired during a year by the number of patients discharged during that year. This indicator is widely used to measure the clinical quality of hospital services.
The surgical incision healing rate is calculated by dividing the number of surgical operations that incision is healed during a year by the number of all surgical operations during 1 year.
The success rate of first aid in the emergency room equals the survivals of critically ill patients after first aid as a share of critically ill patients who need first aid in the emergency room.
The number of senior physicians per hospital is the number of chief physicians at one hospital. In China, chief physician is the highest title for physicians. In general, it is an indirect indicator of quality of hospital services.
The number of physicians with a master’s degree or higher per hospital is the number of physicians at one hospital whose education level is master or MD.
Primary industry output refers to the output of agriculture, forestry, animal husbandry and fishery and services in support of these industries. The Second industry includes industries that produce a finished, usable product or are involved in construction.
Assuming the reform taking place in another year would not change the results.
