


Abstract
We investigate the influence of the classroom environment on educational performance and its dependency on parental socio-economic status (SES). The classroom environment can have a compensatory effect and decrease educational inequality, in which case the classroom context is more important for children originating from lower SES families. Alternatively, there can be an amplifying effect, in which case the classroom environment is more important for high-SES children. This would increase educational inequality. We investigate the two alternatives by applying a twin design to data from 4,216 twin pairs from the Netherlands Twin Register (birth cohorts 1991–2002). Some twin pairs share a classroom and other twins from the same pair are in different classrooms. We use this fact to decompose the variance in educational performance at the end of primary school into four components: genetic variance, classroom variance, shared environmental variance, and non-shared environmental variance. We find that of the total variance in educational performance, only a small part (2 per cent) can be attributed to differences between classrooms within schools. The influence of the classroom was larger when the level of parental SES was lower (up to 7.7 per cent) indicating a compensatory effect.
Introduction
Do schools reduce social inequality in educational performance and serve as ‘the Great Equalizer’? Or do they reproduce or even amplify inequalities? Over the past century, these questions have been a core focus of social science scholars and central to the debate on educational policies and reforms (Coleman et al., 1966; Downey, von Hippel and Broh, 2004; Downey and Condron, 2016). There are diverging ideas on how children from different socio-economic status (SES) backgrounds benefit from their school environment. On the one hand, schools could amplify inequality. Even if low-SES and high-SES children attend the same school, various opportunities and practices in the classroom may favour the educational performance of high-SES children. For example, high-SES students could profit more from the materials and lessons in effective classrooms because they enter the school with better academic preparation (Stanovich, 1986; Hanselman, 2018). On the other hand, schools could equalize inequality (i.e. a compensatory effect). Learning opportunities in schools and families overlap and could substitute for each other. An advantageous classroom environment would then benefit students from less resourceful family environments more (Chiu and Khoo, 2005; Hanselman, 2018).
Given the concerns about (increasing) educational inequality in many countries (OECD, 2019), it is important to understand to what extent the classroom context works as an equalizer and is part of the solution, or contributes to inequality and is part of the problem. Therefore, we ask: ‘To what extent are classroom effects contingent on SES background?’ Empirical studies did not provide a conclusive answer to this question yet (e.g., Downey et al., 2004; Alexander, Entwisle and Olson, 2007; Downey and Condron, 2016; Hanselman, 2018; von Hippel, Workman and Downey, 2018; Kyriakides, Creemers and Charalambous, 2019). The reasons for the mixed findings remain unclear. They do not seem to be dependent on students’ age or country, for example.
Investigating classroom effects on educational performance is complex. The quality of the classroom environment is difficult to observe (Hanushek and Rivkin, 2006). For example, measures for teacher quality (e.g. experience, education, test scores) often have a small effect on educational performance (Rivkin, Hanushek and Kain, 2005). While teacher quality effects could be overstated, it could also be that measurable characteristics cover only a small part of the true variation in teacher quality (Rivkin et al., 2005). Another challenge is that classroom effects can be biased when alternative influences on educational performance are not sufficiently controlled for. High-SES parents more often choose high-quality schools for their children (Borghans, Golsteyn and Zölitz, 2015). Also, children’s educational performance is genetically influenced (de Zeeuw et al., 2019), and the composition of classrooms concerning genetic predisposition may not be independent of the classroom environment. Children with a higher polygenic score for learning could be concentrated in higher quality classrooms (cf. Smith-Woolley et al., 2018). The classroom environment may capture influences of children’s socio-economic background or genetic predisposition if those influences are not sufficiently considered.
Prior research tries to deal with such issues with value-added models. These models focus on students’ learning gain instead of performance on a single occasion. Students’ prior achievement is used to estimate the contribution (‘added value’) of the teacher or school to students’ progress in achievement over time (OECD, 2018). Such value-added effects can be adjusted by student- and school-level covariates to further control for pre-existing differences between students, although it is debated to what extent such covariates should be included (Marks, 2021). Value-added models are often argued to provide a suitable way to estimate the contribution of classrooms or schools separate from alternative influences (see e.g. Wayne and Youngs, 2003), but they also come with disadvantages. One of these, which has only been limitedly acknowledged, is that value-added effects can be genetically influenced and may therefore provide biased estimates of the contribution of teachers and schools (Morris et al., 2018).
In this study, we take genetic influences into account by using a suitable method that is rarely applied in this research area. We estimate overall classroom effects and their dependency on parental SES by comparing the educational performance of twins who attend the same or different classrooms. With this method, classroom influences are not directly measured but a latent factor, in addition to other latent factors capturing the contribution of genes, the shared environment (i.e. influences making twins raised in the same family more similar), and non-shared environment (i.e. influences making twins raised in the same family dissimilar) (e.g. Plomin et al., 2008). With this twin design, we can detect classroom effects that suffer less from insufficient measures and bias due to unobserved background influences. An advantage is that we do not only isolate classroom effects but also pinpoint the sources of alternative influences, that is, genetic, shared environmental, or non-shared environmental influences.
Two prior studies used this approach to estimate classroom influences in Australia and the United States (Byrne et al., 2010; Grasby et al., 2020).1 They found that 0–9 per cent of the variance in literacy and numeracy could be accounted for by the classroom environment. We take the next step by investigating how classroom effects depend on parental SES. In this way, we investigate whether the classroom environment affects educational performance in an SES-neutral, equalizing, or amplifying way.
We analyse data on 4,216 twin pairs from the Netherlands Twin Register (NTR). We use the score on the nationwide standardized achievement test (i.e. Cito-test) to measure educational performance. Children take this test at the end of primary school around age 12. The test score, combined with the teacher’s recommendation, determines enrolment in a secondary educational track. The Cito-score is thus important for children’s educational careers. A key aspect of primary education in the Netherlands is that within-school tracking or academic streaming—a practice where classroom allocation is based on prior educational performance—is uncommon. This means that being in the same classroom does not depend on similarity in educational performance between twins, making the Dutch context well suited for investigating classroom effects with the twin method.
Theoretical background
Classroom influences
A classroom component derived from twin models is an omnibus measure for several interrelated ways through which the classroom environment could affect educational performance. Although we do not test the specific influences, we provide an overview of these possible ways.
The first route is via teacher quality. Teachers play a key role in students’ educational performance, either directly (e.g. via instructions) or indirectly (e.g. contributing to a safe and orderly classroom climate). How well teachers do their job is difficult to observe (Hanushek and Rivkin, 2006). Hence, most research is based on observable teacher characteristics, such as knowledge and experience (Parcel and Dufur, 2001; Hanushek and Rivkin, 2006). Studies show that teacher experience matters, but generally only in the first years of their employment (see Coenen et al., 2018). Teachers’ cognitive skills are found to be positively associated with student performance although there are indications that it matters for students’ math performance but not for reading (see Coenen et al., 2018). Lastly, teaching certificates and advanced degrees (i.e. a Master’s or PhD degree relative to a Bachelor’s degree) are generally not associated with students’ performance (Wayne and Youngs, 2003; Hanushek and Rivkin, 2006; Coenen et al., 2018).
A second feature involves classroom resources, for example, equipment, smaller class sizes, and a lower student–teacher ratio. Smaller class sizes and a better student–teacher ratio are thought to reduce resource dilution effects: students have fewer classmates to ‘compete’ for teachers’ time and attention (Parcel and Dufur, 2001). Furthermore, smaller classes may have fewer disciplinary problems and therefore more instructional time and greater opportunity to learn (see Blatchford and Russell, 2020). In empirical studies, indicators such as per-pupil expenditure, student–teacher ratio, and class size have been used. Per-pupil expenditure shows a consistent positive association with educational performance (Greenwald, Hedges and Laine, 1996), whereas for student–teacher ratio and class size, the results are mixed (Greenwald et al., 1996; Blatchford and Russell, 2020).
The third aspect is classroom climate. An academically oriented culture with high expectations signals certain standards about schoolwork and ideal student performance, which is thought to affect educational performance (Anderson, 1982). Also, a cohesive community with dense social ties could positively benefit students’ performance (Parcel and Dufur, 2001; Dronkers and Robert, 2008). Such a community could affect students’ sense of belonging, which relates to academic performance (Ma, 2003). Empirical studies show that classroom and school climate contributes to educational outcomes, with some evidence that it does not only influence short-term performance but that its effect persists for years (Thapa et al., 2013).
Lastly, peers in the classroom can play a role. One way is via direct interactions in learning. This does not only relate to figuring out an answer to an exercise, but also to processes such as developing vocabulary and obtaining knowledge that other students gained from museums, travelling, and so on (Kahlenberg, 2001; Hanushek et al., 2003). Additionally, peers influence each other’s motivation, aspirations, and attitudes towards education (Kahlenberg, 2001; Hanushek et al., 2003). Furthermore, peers affect the extent to which an environment is conducive to learning (Kahlenberg, 2001). If other students show disruptive behaviour, this affects classroom processes and lowers the learning opportunities for all students (Lazear, 2002). Conversely, highly motivated and skilled students contribute to a learning-oriented peer culture (Rumberger and Palardy, 2005). Numerous empirical studies show that peer influence is positively associated with students’ educational outcomes (e.g. grades, standardized test scores), and other outcomes contributing to educational performance including motivational outcomes (e.g. goals, efficacy, interest) and positive behavioural styles (e.g. cooperative behaviour, self-confidence) (see Wentzel and Ramani, 2016). Given these mechanisms and prior empirical studies, we expect that the classroom context influences children’s educational performance.
The moderating role of parental SES
Children’s educational performance is strongly affected by their family background. Children from a high-SES background perform on average better in school because of genetics, and the financial, cultural, and social resources high-SES parents can invest in children’s educational success (Blau and Duncan, 1967; Bourdieu and Passeron, 1977).2 We examine whether parental SES also affects the extent to which the classroom environment matters for educational performance.
There could be a compensatory effect in which case the educational performance of children from low-SES backgrounds depends more on their school environment. A reason to expect this is that learning opportunities within schools overlap with those within socio-economically advantaged families and can substitute for each other (Chiu and Khoo, 2005; Hanselman, 2018). A low-quality classroom environment may be less harmful to high-SES students because the fewer learning opportunities in such classes can be substituted by parental resources (e.g. providing tutoring), while low-SES parents cannot provide such compensation (Hanselman, 2018). In a similar vein, a higher quality classroom environment may be more beneficial for students from less advantaged family backgrounds. Low-SES students may be more susceptible to the supportive environment in advantageous classrooms because they are less likely to find supportive influences at home (Coleman et al., 1966; Rumberger and Palardy, 2005). For example, children in low-SES families receive less language stimulation at home as low-SES parents, in general, tend to expose their children to less vocabulary and grammar, read to them less, and purchase fewer reading materials for their children (Bradley and Corwyn, 2002). These children may benefit more from the available books in the classroom and interactions with peers that contribute to developing vocabulary.
Also, the opposite can be expected: the classroom environment may be especially beneficial for high-SES students. This refers to an amplification effect and has also been referred to as multiplication and multiplicative accumulation (Erola and Kilpi-Jakonen, 2017) or cumulative advantage (DiPrete and Eirich, 2006). High-SES students may take greater advantage of the classroom environment because they enter this environment with better academic preparation (Hanselman, 2018). For example, high-SES students enter school with a stronger vocabulary. They may, therefore, benefit more from learning opportunities in school than low-SES students, because they may understand instructional materials better and learn more from particular lessons than low-SES students (Stanovich, 1986; Hanselman, 2018).
Another consideration is the cultural correspondence between the classroom and the home environment. From a cultural reproduction perspective (Bourdieu and Passeron, 1977), the high-status cultural signals of high-SES children (e.g. behaviours, tastes, and attitudes) are positively evaluated by teachers and these children may experience a greater sense of belonging in their class, leading to better educational performance (de Graaf, de Graaf and Kraaykamp, 2000). This could be especially the case in high-quality classrooms. In such classrooms, the culture is more ambitious and academically oriented, which coincides with high-SES parents’ expectations and ambitions for educational success. This may further increase high-SES students’ educational performance. For low-SES students, such a culture means a mismatch between their family and classroom experiences which may lead to negative self-perceptions and emotional distress, negatively affecting educational outcomes (Crosnoe, 2009). Additionally, the transmission of norms may be stronger if multiple actors socialize with students in the same way (Centola and Macy, 2007). Therefore, if the culture at home and in the classroom matches and both parents and teachers emphasize, for example, the importance of educational performance, students may be more likely to internalize this norm and behave accordingly.
Empirical tests of compensation and amplification effects based on a twin design have not been performed. Prior empirical studies investigated these effects through an interaction between parental SES and measured classroom (or school) characteristics, or by investigating the ‘overall’ contribution of classrooms or schools (e.g. with a value-added approach), all with mixed results. Studies with measured characteristics focused on many different aspects of the classroom and found no interaction with SES (e.g. concerning teacher quality: Borman and Kimball, 2005; Akiba et al., 2007), compensatory effects (e.g. concerning student composition and climate, see e.g. Gustafsson, Nilsen and Hansen, 2018), and amplification effects (e.g. concerning resources, climate, and teacher quality; see Gustafsson et al., 2018; Atlay et al., 2019).
The results of studies that investigated the overall classroom effect are also inconclusive. For example, the value-added study by Kyriakides et al. (2019) shows that more effective classrooms and schools compensate for the socio-economic achievement gap. Additionally, the absence of schooling, for instance, during the summer break (e.g. Downey et al., 2004; Alexander et al., 2007) or COVID-19 pandemic (Engzell, Frey and Verhagen, 2021), increases the SES gap in educational outcomes, consistent with a compensatory effect of schooling. Yet, there are also comparable studies that challenge this conclusion. For example, Von Hippel, Workman and Downey (2018) find in their seasonal comparison study a small increase in SES inequality during the first summer and no change in inequality during the second summer. Additionally, Hanselman (2018) used a value-added approach and found no interplay with economic background, which suggests that classrooms and schools neither amplify nor compensate for socio-economic inequality but rather reflect existing inequality.
Since there are neither clear theoretical nor empirical arguments to favour either compensation or amplification, we consider two alternative hypotheses: the classroom environment has a larger influence on educational performance if students’ SES background is lower (H1; compensation) and the classroom environment has a larger influence on educational performance if students’ SES background is higher (H2; amplification).
Methods
Data
We analyse data from the NTR, which was established in 1986 by recruiting twins and multiples a few weeks or months after birth. The NTR is still ongoing and registers around half of all newborn multiples in the Netherlands (Boomsma et al., 2002). For young twins, parents receive a survey at registration and when twins are 2, 3, 4/5, 7, 9/10, and 12 years old. After obtaining parental consent, twins’ teachers receive surveys when the twins are 7, 9/10, and 12 years old. More details on the NTR are reported elsewhere (e.g. van Beijsterveldt et al., 2013; Ligthart et al., 2019).
We include twins from birth cohorts 1991–2002. For these cohorts, Cito-data are available for at least one of the twins for 5,672 twin pairs (1,943 monozygotic [MZ] pairs and 3,729 dizygotic [DZ] pairs). The NTR determines twins’ zygosity based on questionnaire items and on DNA or blood group polymorphism. The questionnaire allows for zygosity determination with 97 per cent accuracy (Ligthart et al., 2019).
For classroom placement, we rely on the mother’s, father’s, and teacher’s reports from when the twins were 12 years old. Changing classrooms is uncommon in the Netherlands. The large majority of pupils share their classroom with the same children throughout primary school (Polderman et al., 2010). We initially rely on mother’s report. If data were missing, we used father’s report, and if both parents’ reports included missing data, we used the teacher’s report. Parents were asked which school situation is or was most applicable: (1) same class, (2) same school, parallel class, (3) same school, different class, (4) different school, (5) partly same, partly different. Class information from the teacher report was also measured when twins were around 12 years old, but in a less specific way as only a distinction between ‘in the same class’ and ‘not in the same class’ was made. We excluded those twin pairs for whom it was unclear whether they were in the same class or not, either due to missing data (Npairs = 897, 15.8 per cent) or because they were partly in the same and partly in different classes (Npairs = 333, 5.9 per cent), leading to a sample of 4,442 twin pairs. Additionally, we repeated the analyses after also excluding twins who went to different schools (Npairs = 175, 3.1 per cent) and those who were in the same school but in different grades (Npairs = 657, 11.6 per cent). The conclusions remain the same (see Appendix B in Supplementary Material).
Lastly, we excluded twin pairs with missing information on parental SES (Npairs = 226) as missingness on the moderator is not allowed. We used Full-Information Maximum Likelihood (FIML) estimation (Arbuckle, 1996) to handle missing values for all other variables. Our final sample consists of 4,216 twin pairs (880 MZ pairs in the same class, 596 MZ pairs in different classes, 1,444 DZ pairs in the same class, and 1,296 DZ pairs in different classes).
Measurements
Our dependent variable, educational performance, is measured by the student’s score on the Cito-test. These were initially obtained via teacher reports and later also via parents’ and children’s reports. Cito-scores from the different sources are highly correlated: the correlation between Cito-scores reported by parents and twins is 0.975 and between teachers and twins is 0.932 (van Beijsterveldt et al., 2013). The Cito-test is a nationwide standardized educational achievement test that is taken at the end of primary education (around age 12). It consists of multiple-choice items on Dutch language, mathematics, study skills, and world orientation (e.g. geography, biology, and history). The domains are combined into a total score using Item Response Theory, and this score is standardized on a scale from 501 to 550. Because the sub-domain world orientation is not mandatory, this is not included in the calculation of the total score. The national average is a score of 535, with a standard deviation (SD) of 10. Our sample has a somewhat higher average and lower SD (see Table 1). Means and variances of the Cito-scores for twin 1 (typically the firstborn twin) and twin 2 are not statistically significantly different.
Descriptive statistics for MZ twins in the same classroom, DZ twins in the same classroom, MZ twins in different classrooms, and DZ twins in different classrooms
| Variable | Same classroom | Different classrooms | ||||||||
|---|---|---|---|---|---|---|---|---|---|---|
| Mean | SD | Min. | Max. | N | Mean | SD | Min. | Max. | N | |
| MZ twins | ||||||||||
| Twin specific | ||||||||||
| Cito twin 1 | 538.07 | 8.27 | 508 | 550 | 872 | 538.42 | 8.33 | 509 | 550 | 562 |
| Cito twin 2 | 537.57 | 8.49 | 505 | 550 | 866 | 538.36 | 8.20 | 510 | 550 | 552 |
| Boy twin 1 | 0.44 | - | 0 | 1 | 880 | 0.49 | - | 0 | 1 | 595 |
| Boy twin 2 | 0.44 | - | 0 | 1 | 880 | 0.49 | - | 0 | 1 | 595 |
| Twin pair | ||||||||||
| Education parents | 63.95 | 17.64 | 22.98 | 92.63 | 880 | 68.72 | 17.33 | 22.98 | 92.63 | 596 |
| Age | 12.26 | 0.49 | 11 | 14 | 740 | 12.27 | 0.52 | 11 | 14 | 472 |
| rcito1,cito2 | .80 | .77 | ||||||||
| DZ twins | ||||||||||
| Twin specific | ||||||||||
| Cito twin 1 | 537.82 | 8.83 | 503 | 550 | 1,415 | 537.78 | 8.46 | 510 | 550 | 1,132 |
| Cito twin 2 | 537.74 | 8.60 | 501 | 550 | 1,416 | 537.73 | 8.34 | 509 | 550 | 1,110 |
| Boy twin 1 | 0.49 | - | 0 | 1 | 1,444 | 0.52 | - | 0 | 1 | 1,294 |
| Boy twin 2 | 0.47 | - | 0 | 1 | 1,443 | 0.53 | - | 0 | 1 | 1,296 |
| Twin pair | ||||||||||
| Education parents | 64.80 | 17.29 | 22.98 | 92.63 | 1,445 | 67.77 | 17.55 | 22.98 | 92.63 | 1,296 |
| Age | 12.25 | 0.47 | 10 | 14 | 1,181 | 12.28 | 0.51 | 11 | 14 | 936 |
| rcito1,cito2 | 0.47 | 0.44 | ||||||||
Note: For twin-specific variables, the N refers to number of individuals. For twin pair variables, the N refers to number of pairs.
We measure parental SES by parental education, which is the most stable and important indicator of SES when predicting children’s educational performance (Sirin, 2005). We use the information on mother’s and father’s highest educational level from the parents’ survey when the twins were around 10 years old. When mother’s or father’s education at age 10 was missing, we used information from the survey for younger twins (ages 7, 3, and 1). The original variable from the parent survey for 10- and 7-year-old twins consisted of 13 categories ranging from elementary school to post-graduate degree/PhD. The variable measured at twin ages 3 and 1 consisted of five categories ranging from elementary school to scientific education. We converted these categories into scores on the International Standard Level of Education (ISLED) scale (Schröder and Ganzeboom, 2014). ISLED is a well-validated continuous education measure ranging from 0 to 100, which allows for comparison across surveys and countries. We coded the categories into the highest level of finished education using the online appendix (ISLED, 2014) and used the average ISLED score when multiple values were applicable (e.g. for the category combining higher general secondary education ‘havo’ and pre-university education ‘VWO’). An overview of the coding is presented in Table A1 (Appendix A in Supplementary Material).
In all analyses, we control for sex (girls = 0, boys = 1) and age (in years) when the Cito-test was taken. While most children take the test when they are 12 years old, there is variation in age (see Table 1) which we want to correct for.
Twin design
The classical twin design (Figure 1) decomposes the variance in educational performance into variance due to additive genetic influences (A), common or shared environmental influences (C), and non-shared or unique environmental influences including measurement error (E) (Franić et al., 2012). Twin data enable disentangling these variance components, as twins differ in genetic relatedness (MZ twins share almost 100 per cent of their genes at conception, DZ twin pairs share on average 50 per cent of their segregating genes) and MZ and DZ twin pairs are assumed to share their environment to the same extent. Hence, the covariance in educational performance between twin 1 and twin 2 is for MZ twins and for DZ twins. A larger similarity in performance for MZ twins than DZ twins is consistent with a hypothesis that genetic influences are of importance. If MZ twins are not alike, the source of this dissimilarity is by definition the non-shared environment.
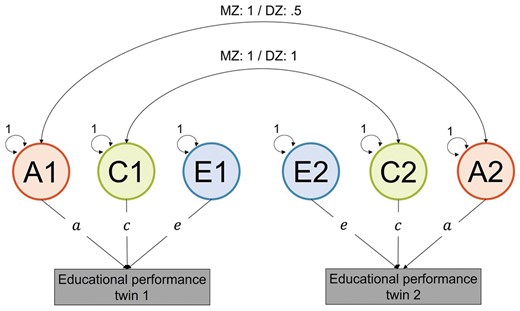
The Classical Twin Design (CTD). The CTD is fitted to data from monozygotic (MZ) and dizygotic (DZ) twins. Latent variables (circles) represent genetic (A), shared environmental (C), and non-shared environmental (E) factors. Their influence on educational performance (observed variables: squares) is given by path coefficients a, c, and e.
We estimate a fourth component capturing classroom influences (CL) using measured information on whether twins attend the same classroom in primary school or not. When twins share their classroom, classroom influences increase twin similarity in educational performance. Classroom influences make twins dissimilar if they are in different classrooms. The difference between twin correlations of twins in the same and different classrooms is the basis to estimate classroom influences (Byrne et al., 2010). As can be seen in Figure 2, the covariances in educational performance between twin 1 and twin 2 for the groups MZ twins in the same classroom (MZSC), MZ twins in different classrooms (MZDC), DZ twins in the same classroom (DZSC), and DZ twins in different classrooms (DZDC) are
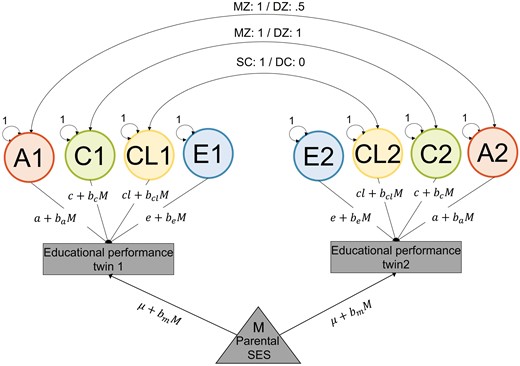
ACE moderation model extended with a classroom factor (CL). Latent variables represent genetic (A), shared environment (C), classroom (CL), and non-shared environment (E) factors, with the corresponding path coefficients a, c, cl, and e. Estimated from data of monozygotic (MZ) and dizygotic (DZ) twins who are in the same classroom (SC) or different classrooms (DC). The correlation between CL1 and CL2 equals 1 if twins share a classroom, otherwise it is zero. Moderator M is a measure of parental SES and is also included in the model as fixed effect (triangle). The model also includes fixed effects of age and sex (not shown to avoid clutter).
Estimating classroom variance changes the interpretation of C and E. These components now refer to shared environmental and non-shared environmental influences not related to the classroom. The classroom component mainly captures within-school differences, because most twins attend the same school. Since between-school differences in the classroom environment are very limited in our case, this may lead to an underestimation of the classroom effect compared to regular multilevel studies of children in classes. This affects the interpretation of the results but does not prohibit testing our hypotheses.
We use multi-group Structural Equation Modelling to decompose the variance in educational performance into A, C, CL, and E. The model includes the measured educational outcome for twin 1 and twin 2 for the groups MZSC, MZDC, DZSC, and DZDC. Latent factors A, C, CL, and E are set to a variance of one to identify the model. Path coefficients a, c, cl, and e represent the effects of the standardized latent factors on the observed outcome. The total variance is given by summing all squared path estimates:
Variance components can be standardized. For example, the proportion of the genetic variance component to the total variance in educational performance, which is called heritability, is given by
The contribution of genetic and environmental factors can depend on a moderator, in our case, parental SES (see Figure 2). For example, cl becomes , where M is the level of parental SES. The total variance in this moderation model becomes
Analytical strategy
We fitted a series of models in Mplus using FIML estimation. In all models, we control for age and sex. We do not take nesting into classes and/or schools into account, partly because of a practical reason as for 60 per cent of the twins we do not have a school identifier, and partly because the number of twin pairs in the dataset per school is low (on average 1.5 for those with a school identifier).
We decomposed the variance in educational performance with and without a classroom component. This shows how the classroom component is captured by C and E if it remains unmodelled. Then, we included our measure for parental SES, which is expected to have a main effect on educational performance and explain part of the total variance. Because parental SES is measured at the family level and always shared between twins, it can only explain shared environmental variance (Turkheimer et al., 2005). In our final model, we allowed the paths to be moderated by parental SES in a continuous, linear gene–environment moderation model (Purcell, 2002). With this model, we tested whether there is a compensatory (H1) or amplifying (H2) effect. If compensation takes place, classroom-level variance would be smaller in higher educated families (i.e. is negative), whereas in the case of amplification, classroom-level variance would be larger in higher educated families (i.e. is positive). Given that compensation and multiplication could occur simultaneously, a negative interaction effect means that compensation is stronger than possible amplification effects (and vice versa). Lastly, we elaborated on how selection into school classes may bias our results.
Before fitting the twin models, we checked whether the means and variances of educational performance were equal for twin 1 and twin 2 (first and second born), MZ and DZ twins, and twins in the same and different classrooms. Therefore, we fitted a saturated model that describes the data with no free parameters left (i.e. no constraints on means and variances) and compared this with models that included the constraints using likelihood-ratio tests. The assumptions of equal means and variances are met.
Results
Decomposition of educational performance
The decomposition of educational performance into the A, C, CL, and E components is presented in Model 2 of Table 2. The total variance in educational performance is 72.001 (= 6.9892 + 2.6992 + 1.2412 + 3.7852). The classroom variance is . While for classroom variance, the path loading of 1.241 is significant (p = 0.022), the variance of 1.540 is not (p = 0.252). This may be because the power for estimating a variance component is smaller than for a path loading. Standardizing this variance component shows that individual differences in educational performance are for 2.1 per cent related to differences in classroom environment within schools (). Additionally, there is statistically significant shared environmental variance () and non-shared environmental variance (), making up 10.1 per cent and 21.0 per cent of the total variance in educational performance, respectively. The largest source of variance in educational performance is genetic (). This leads to a heritability estimate of 0.678, meaning that 67.8 per cent of the individual differences in educational performance are related to genetic differences.
Results of twin models for educational performance for MZ twins in the same classroom (Npairs = 880), DZ twins in the same classroom (Npairs = 1,444), MZ twins in different classrooms (Npairs = 596), and DZ twins in different classrooms (Npairs = 1,296)
| Model 1 | Model 2 | Model 3 | Model 4 | |||||
|---|---|---|---|---|---|---|---|---|
| Estimate | SE | Estimate | SE | Estimate | SE | Estimate | SE | |
| Intercept | 551.703*** | (3.387) | 551.771*** | (3.388) | 535.201*** | (3.255) | 535.719*** | (3.209) |
| Parental education | 0.154*** | (0.006) | 0.158*** | (0.007) | ||||
| Path | ||||||||
| a | 6.987*** | (0.206) | 6.989*** | (0.206) | 6.995*** | (0.117) | 9.212*** | (0.447) |
| c | 2.880*** | (0.441) | 2.699*** | (0.496) | 0.000 | (0.000) | 0.000 | (0.000) |
| cl | 1.241* | (0.542) | 1.253* | (0.507) | 3.428*** | (0.916) | ||
| e | 3.862*** | (0.099) | 3.785*** | (0.121) | 3.784*** | (0.110) | 4.884*** | (0.397) |
| −0.034*** | (0.006) | |||||||
| 0.000 | (0.000) | |||||||
| −0.029** | (0.010) | |||||||
| −0.017** | (0.006) | |||||||
| Variance | ||||||||
| VA | 48.812*** | (2.877) | 48.849*** | (2.884) | 48.928*** | (1.630) | a | |
| VC | 8.294** | (2.538) | 7.287** | (2.678) | 0.000 | (0.000) | a | |
| VCL | 1.540 | (1.345) | 1.570 | (1.270) | a | |||
| VE | 14.913*** | (0.767) | 14.325*** | (0.914) | 14.320*** | (0.830) | a | |
| Vtotal | 72.019*** | (1.371) | 72.001*** | (1.370) | 64.819*** | (1.236) | a | |
| Model fit | ||||||||
| # free parameters | 30 | 31 | 40 | 44 | ||||
| LL | −35,692.259 | −35,691.177 | −53,444.695 | −53,380.945 | ||||
| AIC | 71,444.517 | 71,444.353 | 106,967.390 | 106,849.889 | ||||
Note: Estimates are unstandardized, controlled for age and sex in all models. SE = standard error, VA = genetic variance, VC = shared environmental variance, VCL = classroom variance, VE = non-shared environmental variance, Vtotal = total variance, LL = loglikelihood, AIC = Akaike Information Criterion. The variances are based on the squared path estimates a, c, cl, e (e.g. a2 = 6.9872 = 48.812).
aNot applicable, because in the moderation model the size of a variance component depends on the level of parental education.
*p < 0.05.
**p < 0.01.
***p < 0.001 (two-tailed tests).
If classroom variance is unmodelled, it is captured in the C and E, because part of the twin pairs share the same classroom while the other part does not. Model 1 (Table 2) shows that if the classroom variance is not modelled, the shared environmental variance is and the non-shared environmental variance is . Comparing these shared and non-shared environmental variances with those in Model 2 ( and , respectively) shows that the classroom variance is to a larger extent captured in the C-component. This is as expected given that the twins in our sample were more often in the same than in different classrooms.
We can use the difference in the C-components from Models 1 and 2 to calculate the extent to which shared environmental influences can be attributed to shared classroom experiences. Around 11.5 per cent of the differences in educational performance can be attributed to shared environmental influences if classroom effects are not considered and this is 1.4 percentage points lower (10.1 per cent) if we take classroom effects into account. This shows that 1.4/11.5 = 12 per cent of the shared environmental influences can be attributed to the same classroom experiences. One could do the same for the non-shared environment (E) and different classroom experiences, but this is not very informative given that E not only includes different environmental influences but also measurement errors.
The role of parental SES
Model 3 (Table 2) includes the main effect of parental education, our parental SES measure, which has a positive significant effect on educational performance. Each unit increase in parental education is associated with 0.154 point increase in Cito-score (b = 0.154, p < 0.001). The standardized effect (not shown in Table 2) is 0.319, meaning that an SD increase in parental education is associated with 0.319 SD increase in educational performance. Parental education entirely explains the (non-classroom) shared environmental variance.3
In Model 4 (Table 2), we allow the variance components to be moderated by parental education. These interaction effects are indicated by ba, bc, bcl, and be. If there is a compensatory effect (H1), classroom influences would become smaller with increasing parental education (i.e. is negative). In the case of an amplification effect (H2), we expect to observe the opposite (i.e. is positive). Our findings point towards a compensatory effect, as there is a negative statistically significant moderation of the classroom effect (, p = 0.006). The classroom variance in this moderation model is computed by . For children with the lowest educated parents (i.e. primary education—ISLED 22.98), classroom variance is VCL = (3.428 + (−0.029 × 22.98))2 = 7.626. Classroom variance decreases and almost approaches zero (VCL = 0.550) for the highest educated parents (i.e. postdoctoral education—ISLED 92.63) (see Figure 3).
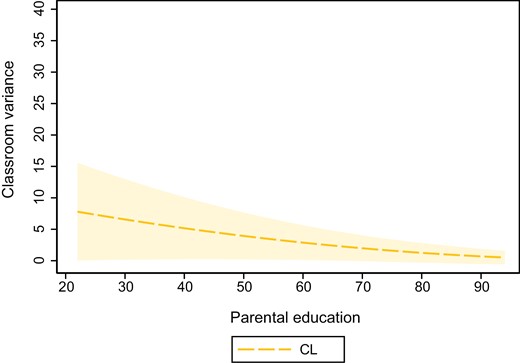
Unstandardized classroom variance (CL) in educational performance moderated by parental education (ISLED) including 95% confidence interval. Results based on Table 2 Model 4.
Classroom variance reduces with increasing parental education, but so does the total variance in educational performance (see Figure 4a). To investigate whether the compensation pattern appears because of the decreasing total amount of variance, we also look at the standardized results (see Figure 4b). The standardized results also show a pattern of compensation. We previously showed that for children with the lowest educated parents, the estimated classroom variance is 7.626. Dividing this by the total variance in educational performance among these children (98.893) shows that 7.7 per cent of the variance in educational performance can be attributed to the classroom context. For the average parental education (higher and pre-scientific secondary school), 3.5 per cent can be attributed to the classroom, and for children with the highest educated parents (postdoctoral education) 1.2 per cent.
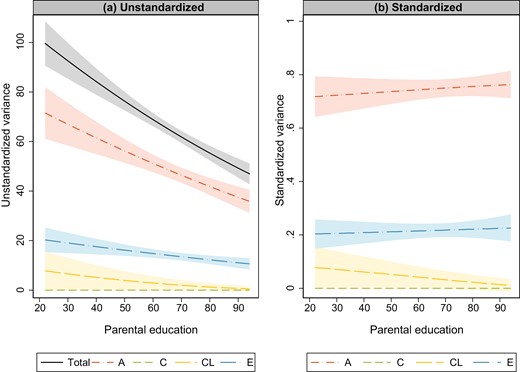
Decomposition of the (a) unstandardized and (b) standardized variance in educational performance moderated by parental education (ISLED). Genetic (A), shared environmental (C), classroom (CL), and non-shared environmental (E) variance. Results based on Table 2 Model 4.
Although we did not hypothesize on the moderation of other variance components, results show statistically significant negative moderations of unstandardized genetic influences (, p < 0.001) and non-shared environmental influences (, p = 0.002). Yet, these largely disappear when we look at the standardized components (see Figure 4b). With increasing parental education, relative genetic variance and non-shared environmental variance increase a little bit but are largely stable around 0.75 and 0.20, respectively. Shared environmental variance is not dependent on parental education: it is entirely explained by parental education for all levels of parental education.
Selection into classrooms
The Dutch Association of Parents of Multiples (NVOM) advises that the decision to allocate twins to the same versus different classrooms should be made on an individual basis by teachers and parents together (NVOM, 2019). To what extent schools follow this advice or have a different policy is not entirely clear. International studies show that official school policy to separate twins is exceptional. For example, a survey in the United Kingdom showed that only 1 per cent of the schools had an official policy on the education of twins (Preedy, 1999). Precise information on the Dutch context is lacking, although the NVOM (2019) reports that 9 per cent of the parents that participated in their survey indicate that only the school decides on the classroom allocation.
There may be, however, other selection effects. One of them relates to zygosity. An assumption underlying the classical twin design is that environmental influences are shared to the same extent by MZ and DZ twins. Under this assumption, greater similarity in educational performance among MZ twins compared to DZ twins can be attributed to MZ twins’ greater genetic similarity. However, if MZ twins are more often in the same classroom than DZ twins, greater similarity in MZ twins’ performance is due to both greater genetic similarity and greater classroom similarity. In our sample, MZ twins are somewhat more often in the same classroom than DZ twins (respectively, 59.6% vs. 52.7%, χ2 = 18.568, df = 1, p < 0.001). If classroom sharing is unmodelled, this would lead to an overestimation of genetic influences (Grasby et al., 2020). Since we explicitly model classroom sharing, a bias is avoided in our study. Greater similarity among MZ twins is no longer an unobserved mixture of greater genetic similarity and being more often in the same classroom because incorporating classroom information allows for separating these sources.
While selection based on zygosity is not problematic for estimating classroom influences, selection based on other characteristics may be. Twins (dis)similarity in certain characteristics may be a reason to allocate twins to the same class or different classes. This is only problematic if such characteristics also affect our dependent variable: educational performance at age 12. Studies suggest that there are mainly two characteristics that affect the decision to place twins in separate classrooms: ability and behavioural problems (Jones and De Gioia, 2010). As these characteristics may also affect educational performance, the estimated classroom component could be inflated. Greater twin similarity in educational performance for twins in the same class would then reflect similarity in prior ability or (the lack of) behavioural problems, rather than being solely a consequence of exposure to the same classroom context. We do not expect such selection processes to play a major role in the Dutch context. In Dutch primary education, there is no ability tracking. Neither parents nor schools can choose a high-performing classroom for one twin and a low-performing classroom for the other. Moreover, prior twin studies investigating classroom effects in countries where within-school tracking is common indicate that class allocation based on prior performance did not affect the conclusions on classroom effects (Byrne et al., 2010; Grasby et al., 2020). Concerning behavioural problems, studies using Dutch twin samples show that the association between problem behaviour and classroom allocation, if any, is small and that it does not affect educational performance in the long run (i.e. performance at age 12) (van Leeuwen et al., 2005; Polderman et al., 2010). Thus, the Dutch educational context and prior empirical evidence suggest that it is unlikely that originally dissimilar twins end up in different classes. Even if it would occur, the effect on the (over)estimation of classroom effects will likely be minimal.
Lastly, if the decision to place twins in different classrooms is selective (because of differences in performance or behavioural problems), it would influence the interaction that we are interested in if the bias depends on parental SES. Literature suggests that low-SES parents tend to be more ‘twinship oriented’ (i.e. treating twins more similar), while high-SES parents tend to be more ‘differentiation oriented’ (i.e. treating twins more dissimilar, emphasizing individuality), which may be especially pronounced for MZ twins (Robin and Casati, 1994). If so, our reported negative interaction effect between parental SES and influence of the classroom would be an underestimation, because the classroom effect would be overestimated for high-SES parents but not so much for low-SES parents. We do find that twins of lower SES parents are somewhat more often in the same class (χ2 = 78.407, df = 9, p < 0.001) (see Figure 5). We do not expect the underestimation of the interaction to be large, because the SES difference in class allocation is small and our results indicate that high-SES parents are not more differentiation oriented than low-SES parents. Environmental influences that make twins more dissimilar, such as parents treating twins differently, are captured in the non-shared environment component (E). If high-SES parents would indeed be much more differentiation oriented, one would expect E to be larger in high-SES families, which is not the case (see Figure 4a).
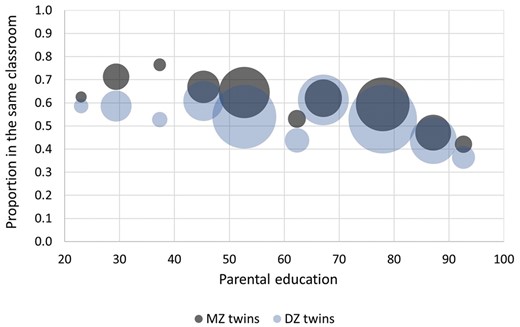
Proportion of MZ and DZ twins in the same class by parental education (ISLED). The size reflects the number of observations.
Conclusion and discussion
In many countries, educational inequality based on socio-economic background is of great concern, leading researchers, policy-makers, and educational professionals to question how to counter this. Classrooms are important contexts in children’s lives, but it is unclear whether these are part of the problem by amplifying educational inequality or part of the solution by reducing educational inequality. We used a novel approach based on Dutch twin data and showed that the role of classrooms in explaining educational performance of primary school pupils is relatively minor when alternative sources (including genetic and non-shared environmental influences) are considered. However, classroom influences are stronger for children from lower SES families. This suggests that classrooms compensate for influences of family background and thus serve as equalizers rather than amplifiers of educational inequality.
We find that on average 2.1 per cent of the variance in educational performance of Dutch primary school pupils is attributable to classroom influences. This falls within the range (i.e. 0–9 per cent) that has been previously found in twin studies (Byrne et al., 2010; Grasby et al., 2020). There are different ways to interpret this result. On the one hand, an explained variance of 2.1 per cent indicates that only a small part of all differences in educational performance can be accounted for by the classroom environment. Given the general view that teachers and other classroom aspects are important for children’s educational outcomes, this may be somewhat surprising. It is important to be aware that our classroom effect shows the extent to which the classroom environment explains differences in performance, not the effect on average performance. For example, a good teacher may increase student performance but if most classes have good teachers, it would not explain much of the individual differences in performance. Yet, one would not conclude that good teachers are not important.
On the other hand, the classroom effect may also be interpreted as being more substantial if we relate it to the environmental part of the variance instead of the overall variance. Genetic variance is a major source of differences in educational performance. In our case, genetic differences account for 68 per cent of the total variance, meaning that only 32 per cent result from environmental factors. Compared to these environmental differences, the share of the variance that is explained by classrooms is more sizeable. Of all the environmental influences that children from the same family share (e.g. parents, neighbourhood, school), 12 per cent can be attributed to shared classroom experiences. Moreover, classrooms are more important for some children than for others, as we discuss next.
Classroom effects are dependent on family background. They are larger the lower educated the parents are, explaining up to 7.7 per cent of the total variance in educational performance for children from the lowest educated families. This suggests a compensatory effect and is consistent with the argument that children from low-SES families could substitute school resources for family resources. Because these children are less likely to find supportive influences at home, for example, they may be more susceptible to a supportive school environment (Coleman et al., 1966; Rumberger and Palardy, 2005). This does not mean that amplification effects do not take place at all. Favourable classroom environments could have a compensating effect for low-SES children while simultaneously having an amplifying effect for high-SES children. If this would occur to the same extent, we would not find any differences in the classroom component by SES. Since we find larger classroom effects for low-SES children, we can conclude that the compensatory effects of classrooms are stronger than possible amplification effects.
While we did not hypothesize on how other sources of variance depend on SES background, we find less genetic and non-shared environmental variance in higher SES families. Gene–environment interaction in educational outcomes is often studied from a bio-ecological framework, where the genetic potential for high educational performance is thought to be actualized in more advantaged environments such as high-SES families (Scarr-Salapatek, 1971; Bronfenbrenner and Ceci, 1994). However, we find that genetic variance is higher in low-SES families. This can be interpreted as genetic influences associated with lower educational performance having more detrimental effects on children from more disadvantaged socio-economic backgrounds (see de Zeeuw et al., 2019). When we consider that the total variance in educational performance decreases by standardizing the results, we do not find a moderation of genetic variance (nor non-shared environmental variance) by parental SES.
Although twin data allow us to contribute to prior studies by investigating classroom effects and their dependency on parental SES in a novel way, it does not solve all issues. In particular, the (moderating) effect of measured parental SES should not be interpreted as causal. Parents’ genetic potential influences parents’ SES, and they transmit part of this genetic potential to their children, which in turn influences the children’s school performance. If these genes that parents and their children share are unmodelled, the association between parental SES and children’s education is likely genetically confounded and thus does not only reflect environmental effects (e.g. effects of resources and behaviours shaped by parental SES) (Hart, Little and van Bergen, 2021). This issue is not specific to our twin analyses but applies to most analyses involving parental SES and children’s outcomes (except those with a causal design such as an instrumental variable or difference-in-difference approach). For our conclusions, this means that the observed compensation of the impact of family background by classrooms does not pertain only to environmental (dis)advantages passed on by families, but possibly also to the transmission of genetic (dis)advantages. This is not problematic if one is interested in the stratification of educational outcomes by family background in a broader sense, capturing all types of (dis)advantages that are associated with it. If one is interested in separating environmental and genetic intergenerational transmission, one would need other designs such as the children-of-twin design or measured genotype design.
Using twin data also comes with some complexities of its own. A concern may be that twins form a special group and that conclusions based on twin data are not generalizable to the general population. Twins, especially identical ones, may be raised in more similar environments and treated more similarly than fraternal twins or non-twins. This could affect estimations if differential treatment is related to the outcome (i.e. educational performance). We do not expect this to be the case. Prior studies show only limited evidence for a violation of the equal environment assumption and if a violation occurred it did not affect the genetic and environmental effects on educational outcomes (Mönkediek et al., 2020). Also, in a population-based study on educational performance in the Netherlands, twin-based estimates of Cito-scores were not biased (Schwabe, Janss and van den Berg, 2017). These findings suggest that our results are generalizable to the general population of Dutch primary school pupils.
Nevertheless, relying on twin data may lead to conservative estimates of classroom effects. Twins almost always attend the same school, meaning that we capture only within-school differences between classrooms. Some classroom characteristics (e.g. SES composition, school resources) cluster within schools, implying that the differences between classrooms in our study are smaller than the differences between classrooms in general. The classroom effect that we find, therefore, reflects aspects that vary between classrooms within a school (e.g. teacher quality, climate) rather than aspects that vary mostly between schools (e.g. resources, student composition). Future research could include measured classroom characteristics to investigate which specific characteristics contribute to classroom variance. Another reason why our estimate of classroom effects is conservative relates to non-shared environmental influences. The non-shared environment makes up around 20 per cent of the total variance in educational performance after distinguishing the classroom component. Part of this non-shared environmental variance may still be related to what happens in classrooms. Even if twins are in the same classroom, they may perceive their classroom environment differently or teachers could treat them differently, which is captured in the non-shared environment component. Altogether, this means that our classroom estimate should be seen as a lower bound. Future work using complementary approaches (e.g. children-of-twins models, parental genotype design, including individual-specific measures of the class environment) could provide more insight into the interrelated influences of genes, families, and classrooms.
In conclusion, we find that classroom influences depend on family SES in Dutch primary schools. There is more classroom variance with lower levels of parental education, suggesting that children from lower SES families benefit more from a high-quality classroom than children from high-SES families. However, we cannot conclude that classroom environments are great equalizers because the role of classrooms in explaining differences in educational performance is relatively small. Moreover, it can be expected that especially children from high-SES families are in high-quality classes given socio-economic selection into schools (Borghans et al., 2015). High-SES children are more likely to be in high-quality classes while the added value of such an environment is relatively little for them. Contrarily, low-SES children, for whom a high-quality class environment could make more of a difference, are likely less often exposed to this. Our results are thus indicative of a compensatory effect and show the modest potential of the classroom environment to reduce educational inequalities. Whether this potential is actually realized depends on the quality of the classroom environment that low-SES children are exposed to.
Acknowledgements
We are grateful to the twin families and the teachers for their participation. Earlier versions of this work were presented at the ISA RC28 spring meeting (Frankfurt, 2019), Dag van de Sociologie (Amsterdam, 2019), Social Stratification Research Seminar (Amsterdam, 2019), Migration and Social Stratification Seminar (Utrecht, 2019), and ICS spring day (Nijmegen, 2019). We thank the participants at these meetings, and the anonymous reviewers, for their valuable comments.
Funding
This work was supported by the Dutch Research Council (Nederlandse Organisatie voor Wetenschappelijk Onderzoek (NWO)) research talent grant for the project ‘Quality and inequality: The compensatory and multiplicative effects of school quality’ (NWO: 406-18-557, awarded to K.S., A.K., and I.M.) and a Veni grant for the project ‘Towards equal educational opportunities: The complex interaction between genes, families, and schools’ (NWO: 451-17-030, awarded to A.K.). We gratefully acknowledge research programme ‘Consortium on Individual Development’ which is funded through the Gravitation program of the Dutch Ministry of Education, Culture and Science and the NWO (NWO: 0240-001-003); ‘Decoding the gene–environment interplay of reading ability’ (NWO: 451-15-017); ‘Netherlands Twin Registry Repository: Researching the interplay between genome and environment’ (NWO: 480-15-001/674); ‘Twin-family study of individual differences in school achievement’ (NWO: 056-32-010); ‘Longitudinal data collection from teachers of Dutch twins and their siblings’ (NWO: 481-08-011); ‘KNAW Academy Professor Award’ (PAH/6635).
Research Ethics
Informed consent was obtained from all participants. The study was approved by the Central Ethics Committee on Research Involving Human Subjects of the VU University Medical Centre, Amsterdam, an Institutional Review Board certified by the U.S. Office of Human Research Protections (IRB number IRB00002991 under Federal-wide Assurance FWA00017598; IRB/institute codes, NTR 03-180).
Data Availability
Netherland Twin Register (NTR) is an ongoing longitudinal study. Data may be accessed upon reasonable request and after approval of the data access committee. For more information, see https://ntr-data-request.psy.vu.nl/index.html. Code for replication can be found here: https://osf.io/mxzpe/.
References
Footnotes
A few other twin studies also provide information on twins in the same and different classes but do not explicitly test for classroom variance (e.g. Kovas et al., 2007; Eifler et al., 2019).
Because parental genes can influence both parental SES and children’s educational performance (via children’s genes), the association between parental SES and children’s educational performance may be partly spurious. We come back to this issue and its implications in the Conclusion and Discussion section.
This also leads to decreased model fit which would be less if we drop the C-component. We did not do so because C-variance may still be important for part of the parental education scale when we estimate the moderation model.
