


Abstract
Aims: The aim of the study was to examine for Australia whether the link between population alcohol consumption and liver disease mortality varies over time, using 71 years of data. Methods: Overall and gender-specific rates of liver disease mortality were analysed in relation to total alcohol consumption as well as for different beverage types by using autoregressive integrated moving average (ARIMA) time series methods. Separate models were developed for the entire time period and for two sub-periods (1935–1975, 1976–2006). Results: A 1-l increase in adult per capita consumption of pure alcohol led to a rise of ∼10% in overall liver disease mortality rates and a 11 and 9% increase in female and male liver disease mortality, respectively. The strength of the relationship between per capita consumption and liver disease mortality diminished over time. Spirits consumption was found to be the main driving factor in liver mortality rates between 1935 and 1975, while beer consumption was found to be the most significant predictor in liver diseases in the last three decades. In a comparative perspective, the effect of per capita alcohol consumption on liver disease in Australia is similar to the USA, Southern and Eastern Europe countries, but weaker than in Canada and western European countries. Conclusion: An increase in per capita alcohol consumption in Australia is likely to lead to an increase in liver disease. Changes in the most important beverage over the study period suggest substantial shifts in drinking patterns and preferences among the heaviest Australian drinkers.
INTRODUCTION
Liver cirrhosis attributed to alcohol consumption was responsible for an estimated 6825 deaths in Australia from 1992 to 2001 (Liang et al., 2011), and globally was the cause of ∼15% of all alcohol-attributable deaths in 2004 (Rehm et al., 2010). Epidemiological studies demonstrate that alcohol consumption is a key risk factor for liver cirrhosis and that the relationship between volume of alcohol consumed and risk of cirrhosis is non-linear at the individual level (Skog, 1984). In other words, the rate of liver cirrhosis in a population is driven largely by the consumption of the heaviest drinkers.
A public health and policy concern is whether this association between heavy drinking and cirrhosis is reflected in a relationship between per capita alcohol consumption and cirrhosis. If, as the population consumption model proposes, changes in per capita consumption reflect changes in the number of heavy drinkers, then a positive association between per capita consumption and liver cirrhosis mortality would be expected (Babor et al., 2010). If changes in per capita consumption are driven more by changes among moderate drinkers, then this relationship would be less evident.
Despite some epidemiological debate, in the middle of the twentieth century (see Herd, 1992), research has generally supported a link, with a large number of early and relatively unsophisticated correlational studies finding associations between population-level consumption and cirrhosis mortality (Edwards et al., 1994). More robust longitudinal approaches have been used to explore this issue, generally finding significant associations between changes in population consumption and changes in liver disease mortality (Skog, 1980). Ramstedt (2001) used aggregate data from 14 European countries over a 45-year period, finding significant relationships between per capita consumption and liver cirrhosis mortality in 13 (with Norway as the exception). When these results were pooled based on drinking patterns, they showed stronger relationships in Northern European countries (where drinking is more oriented towards intoxication) than in Southern European countries (Ramstedt, 2001). Similar studies have found significant relationships between population consumption and cirrhosis mortality in Canada (Ramstedt, 2003) and Eastern Europe (Ramstedt, 2007). For a full review, see Norström and Ramstedt (2005).
Researchers have also analysed beverage-specific associations with liver cirrhosis, with the aim of assessing whether the consumption of particular beverages was specifically related to cirrhosis mortality. A study of 50 states in the USA found that only spirits consumption was associated with cirrhosis mortality (not wine or beer) (Gruenewald and Ponicki, 1995a). Similarly, time series analysis of the association between alcohol consumption and cirrhosis mortality in the USA from 1949 to 1994 showed that the consumption of spirits has a stronger association than wine and beer consumption with cirrhosis mortality (Roizen and Kerr, 1999). In a study of five predominantly beer-drinking countries, Kerr et al. (2000) also found that spirits consumption had the strongest association with cirrhosis mortality, despite making up less than one-third of total alcohol consumption. In contrast, a recent study from the UK found that increases in wine consumption appeared to be a driver of recent increases in cirrhosis mortality (Mills, 2007). Individual-level studies have not often examined whether particular beverages are more or less risky for liver disease, although one study did find lesser effects for wine consumption (Becker et al., 2002).
Along with beverage-specific effects, there has been significant research into the influence of gender on the association between alcohol consumption and cirrhosis. The risk of cirrhosis increases with daily alcohol consumption in both men and women, but, at a given level of consumption, women have a higher risk of liver disease than men (Tuyns and Pequignot, 1984). A meta-analysis of 15 population cohort studies indicated that the same amount of alcohol consumption was associated with a greater risk of liver cirrhosis in women than men (Rehm et al., 2010). At the aggregate level, the relationship is less clear, not least because per capita alcohol consumption cannot be broken down into male and female consumption. Mann et al. (2005) found that the effect of alcohol consumption on liver cirrhosis was higher for males than females in Ontario, as did Ramstedt (2001) in both Western and Eastern Europe (Ramstedt, 2001, 2007). In contrast, there was little difference in the effects for males and females in Canada (Ramstedt, 2003). Given that men drink at least two thirds of the total alcohol, this implies a much steeper risk curve for women. The disparities of gender and beverage-specific effects on cirrhosis rates in previous studies are likely due to considerable variation in consumption and drinking patterns across different historical periods and regions.
Cirrhosis mortality rates may be influenced by other factors beyond total alcohol consumption. Changes in drinking patterns and other risk factors over time may mean that the population-level link between per capita consumption and liver disease mortality is not stable. There is some evidence to support this. A correlational study of annual alcohol consumption and cirrhosis mortality in Australia showed that the relationship was systematically stronger in 1905–1931 than it was in 1932–1980 (Rankin et al., 1985). A further complication in Australia has been the significant increase in hepatitis C virus infection from the 1960s through to around 2000 (Razali et al., 2007). Liver disease mortality is high among people with HCV infections. For example, a recent study of an HCV cohort in Australia estimated a standardized liver disease mortality rate of 18.3 per 10,000 person years (Gruenewald and Ponicki, 1995b). Based on current HCV prevalence estimates in Australia (Razali et al., 2007), these mortality rates suggest that HCV may contribute to ∼30% of liver disease mortality. It is worth noting that nearly half of these deaths would be due to alcoholic liver disease, suggesting that the relationship between HCV and liver disease mortality is heavily influenced by alcohol consumption. Indeed, there is the possibility that higher HCV prevalence would increase the link between per capita consumption and liver disease mortality, due to the geometric increases in mortality risk for heavy drinkers with HCV (Corrao and Aricò, 1998). Other factors, such as changing beverage preferences, shifts in the demography of drinking and in the prevalence of ‘binge’ drinking may also contribute to shifts in how closely linked per capita consumption and liver disease mortality are at different points in time.
As is apparent from this brief review, population-level studies of the association between alcohol and cirrhosis mortality include a large number of countries. However, while there have been previous Australian studies looking at homicide (Ramstedt, 2011) and at all-cause mortality (Livingston and Wilkinson, 2013), there have been no specific studies of Australian liver disease data. One previous study has examined this relationship with modern time series analyses using some Australian data (Kerr et al., 2000), although only pooled estimates were published, meaning that Australian-specific estimates were not available. Against this backdrop, the main aim of this paper is to estimate the relationship between total and beverage-specific alcohol consumption and liver disease mortality in Australia from 1935 to 2006. Our study extends this previous work by: using a much longer time series (71 years rather than 40 years), exploring the differential relationships by gender and exploring the variability in the relationship over time. Our results are presented in a comparative framework with previous international studies, to assess whether the links between alcohol consumption and liver disease mortality in Australia differ from those found elsewhere.
METHODS
Data
A proxy for per capita alcohol consumption was constructed using data on the sale of alcohol sourced from the Australian Bureau of Statistics (ABS). From 1960–1961 onwards, these data came from a recent synthesis of historical data (ABS, 2011), while data from earlier years were extracted manually from the relevant yearbooks (e.g. Commonwealth Bureau of Census and Statistics, 1960), and converted from gallons or proof gallons to litres of pure alcohol. This was then converted to litres of pure alcohol per resident aged 15 and older, with population data provided by the Australian Institute of Health and Welfare (AIHW) (AIHW, 2008).
Mortality data were provided by the AIHW, based on historical death certificate data. Due to changes in cause of death coding over the time period studied, our measure of mortality incorporated liver cirrhosis and other liver diseases (>85% cirrhosis, but also including acute and subacute yellow atrophy of the liver and other diseases of the liver).
Liver disease rates remained fairly stable in Australia from 1935 through to the late 1960s, before increasing sharply for 15 years and then declining gradually after a peak in around 1980 (Fig. 1). These trends are broadly similar to those seen for total alcohol consumption (Fig. 2), which climbed steadily to a peak of over 13 l per capita in the late 1970s, then dropped to 10 l per capita and stayed at the same level since the 1990s.
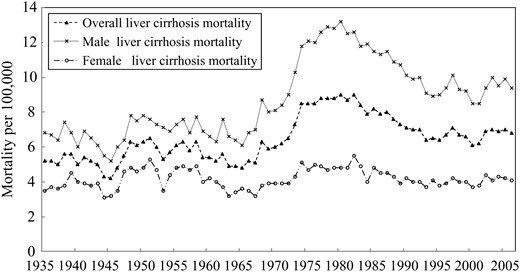
Total, male and female mortality from liver disease in Australia from 1935 to 2006.
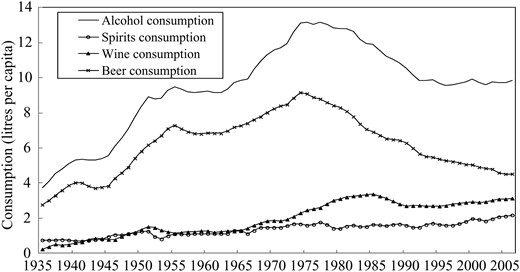
Trends in pure alcohol consumption per inhabitant age 15 years and above in total and for spirits, wine and beer in Australia from 1935 to 2006.
To analyse whether the association between alcohol consumption and liver disease mortality was affected by recent increases in HCV infection rates or changes in drinking patterns, data were further broken down into two time periods, broadly based on the estimated prevalence of HCV. HCV incidence in Australia increased dramatically after 1960 and it has been estimated that between 8 and 21% of people exposed to HCV go on to develop cirrhosis (Razali et al., 2007). The lag time between HCV incidence and cirrhosis is estimated as at least 15 years (Razali et al., 2007), so we divided the sample at 1975. Thus, we run the same models from 1935 to 1975 and from 1976 to 2006 to determine whether the link between alcohol consumption and liver disease mortality has altered in recent years.
Statistical model
To estimate the association between per capita alcohol consumption and liver disease mortality, the autoregressive integrated moving average (ARIMA) modelling technique was employed. ARIMA models require stationary time series to reduce the risk of obtaining a spurious relation between two series that have common trends (Ramstedt, 2001). The Augmented Dickey–Fuller (ADF) unit root test is commonly used for testing stationarity (Dickey and Fuller, 1979). Furthermore, the error term that includes explanatory variables not considered in the model is allowed to have a temporal structure that is modelled and estimated in terms of autoregressive or moving average parameters (Stickley et al., 2011).
For the whole time period 1935 to 2006, the results of five separate models are reported: for the effects of total alcohol consumption; for the effects of each beverage type controlling for the effects of the other two types in a combined analysis; and three models where the effect of each beverage type is measured separately. These five analyses are then repeated for each of the periods 1935–1975 and 1976–2006. The robustness of the models derived in this study was checked via the serial correlation Lagrange multiplier (LM) test of 12 lags, Jarque–Bera test for normality of residuals and Box–Ljung test of the first 10 autocorrelations.
RESULTS
Alcohol consumption and liver disease mortality
The ADF unit root test was carried out to test for stationarity in all the time series used. The test results suggested that all the variables were stationary after first differencing (P < 0.05). The effects of weighted per capita alcohol consumption and weight per capita beverage-specific consumption on overall, male and female liver disease mortality in Australia from 1935 to 2006 are summarized in Table 1. Coefficients in Table 1 indicate that movements of liver disease mortality rates were positively related to changes in alcohol consumption per capita. The total effect (distributed over a 10-year period) of a 1-l increase in per capita alcohol consumption is a rise in liver mortality of ∼10% (i.e. 1-e−0.105). The results suggest that changes in per capita consumption affect female liver disease rates quite similarly to male liver disease rates (11 and 9% effects for a 1 l change in consumption, respectively).
Estimated effects of weighted alcohol consumption on overall, male and female cirrhosis mortality in Australia from 1935 to 2006a
| Overall | Male | Female | |||||||
|---|---|---|---|---|---|---|---|---|---|
| Coef. | SE | Model | Coef. | SE | Model | Coef. | SE | Model | |
| Total alcohol consumption | 0.105** | 0.039 | 0,1,0 | 0.095* | 0.044 | 0,1,0 | 0.116* | 0.056 | 0,1,0 |
| Overall beverage | |||||||||
| Spirits | 0.847*** | 0.241 | 3,1,0 | 0.656* | 0.287 | 3,1,0 | 0.975** | 0.322 | 1,1,0 |
| Wine | 0.091 | 0.122 | 0.127 | 0.148 | 0.064 | 0.179 | |||
| Beer | 0.059 | 0.038 | 0.058 | 0.046 | 0.094 | 0.054 | |||
| Beverage-specific | |||||||||
| Spirits | 0.975*** | 0.236 | 0,1,3 | 0.630** | 0.260 | 0,1,1 | 0.979*** | 0.262 | 0,1,1 |
| Wine | 0.171 | 0.155 | 0,1,0 | 0.200 | 0.171 | 0,1,0 | 0.095 | 0.222 | 0,1,0 |
| Beer | 0.119** | 0.045 | 0,1,0 | 0.109* | 0.050 | 0.1.0 | 0.096* | 0.038 | 1,1,2 |
aBox–Ljung test for residual autocorrelation, Lagrange Multiplier test for serial correlation, Jarque–Bera test for normality of residual were all satisfactory in all models.
*P < 0.05, **P < 0.01, ***P < 0.001.
We used the same weighted lag structure for the overall beverage-specific model as that used in overall estimation above. It is clear that spirits consumption had the strongest association with liver disease mortality over the full study period. A 1-l increase in per capita consumption in spirits, in a static model, corresponds to an increase in liver disease mortality of ∼57% during the following 10 years. The estimates indicate that females were impacted more than males by increasing spirits consumption at the aggregate level. The mortality rate from liver disease in females rises 62% after a 1-l increase in per capita alcohol consumption in the form of spirits when 10 years have elapsed, compared with 48% in males. The relationships between per capita consumption of wine and beer, and liver disease mortality were positive (coefficients = 0.091 and 0.059, respectively), but the effects were weak and statistically non-significant in both overall and gender-specific models.
Three individual beverage-specific models were further applied (Table 1) to explore the relationship between beverage-specific consumption and liver disease mortality. As with the combined model, a strong positive impact of spirits consumption on mortality and a non-significant relationship between wine consumption and mortality was found. In the single-beverage model, aggregate beer consumption was positively associated with liver disease mortality, with a 1-l increase followed by an 11% (1-e−0.119) increase in cirrhosis mortality. The results of model validation tests (LM, Jarque–Bera and Box–Ljung Q) suggest that all estimated models (Tables 1 and 2) were satisfactory with regards to autocorrelation of residuals, and non-normal errors in the residuals with P-values larger than 0.10.
Estimated effects of weighted per capita alcohol consumption on overall cirrhosis mortality in Australia in pre-HCV-influencing period (1935–1975) and HCV-influencing period (1976–2006)a
| Period l (1935–1975) | Period 2 (1976–2006) | |||||
|---|---|---|---|---|---|---|
| Coef. | SE | Model | Coef. | SE | Model | |
| Total alcohol consumption | 0.172* | 0.079 | (0,1,0) | 0.092* | 0.038 | (0,1,2) |
| Overall beverage | ||||||
| Spirits | 1.141*** | 0.350 | (1,1,0) | 0.138 | 0.153 | (1,1,2) |
| Wine | −0.190 | 0.291 | 0.005 | 0.045 | ||
| Beer | 0.166 | 0.078 | 0.214** | 0.067 | ||
| Beverage-specific | ||||||
| Spirits | 1.169** | 0.358 | (1,1,0) | 0.105 | 0.265 | (1,1,3) |
| Wine | 0.046 | 0.311 | (0,1,0) | 0.091 | 0.105 | (1,1,3) |
| Beer | 0.180* | 0.090 | (0,1,0) | 0.245*** | 0.053 | (1,1,2) |
aBox–Ljung test for residual autocorrelation, Lagrange Multiplier test for serial correlation and Jarque–Bera test for normality of residual were all satisfactory in all models.
*P < 0.05, **P < 0.01, ***P < 0.001.
Structural shifts in the relationship between alcohol consumption and liver diseases
The results of our attempt to explore how the relationship between alcohol consumption and liver disease has varied over time are presented in Table 2. For these analyses, we have simply examined the alcohol and mortality relationship in two different periods to see whether the relationship differs between the two time periods. This might be expected given, for example, the increase in HCV-related liver disease after 1975. The estimates based on the first period of data suggest a strong association between per capita consumption and liver disease mortality, with a rise of 16% in cirrhosis mortality per litre. This association was somewhat weaker in the more recent period (9% per litre). Furthermore the results of beverage-specific modelling (Table 2) suggest that spirits was the key beverage driving the association between per capita consumption and mortality prior to 1975. However, the relationship between spirits consumption and liver disease mortality was non-significant in the last three decades, while beer consumption was significantly linked with mortality. These changes may be due to shifts in people's drinking preferences and the increased role of non-alcohol causes in liver cirrhosis mortality, particularly the sharp increase in hepatitis C prevalence over recent decades. The shift from spirits to beer as the most significant beverage associated with liver disease mortality suggests that the heaviest drinkers in Australia may have shifted from spirits to beer in the last quarter of the twentieth century.
Comparison of Australian findings and previous international studies
The association between per capita alcohol consumption and the mortality rate of cirrhosis has been estimated in a number of studies internationally. We present a comparison based on the findings from current study in Australia and previous studies in other countries or regions in Table 3. All these studies used the same basic methodological approach, ARIMA time series models with geometric lag schemes. The results of comparison reveal that the effect of a 1-l increase in per capita alcohol consumption on liver disease mortality rate in Australia (10%) is similar to that in the USA (9%), but weaker than those in the UK (18%) and Canada (17%). The effects on liver disease mortality are weaker in Australia than in Northern Europe (including Finland and Sweden), but similar to effects in Southern European countries (such as France, Italy and Portugal) and Eastern European countries (including Belarus, Poland, Russia and Ukraine). It is noted that the impact of changes in per capita consumption appears to be slightly larger on female liver disease in Australia, while in Canada, Northern, Central and Eastern Europe, males have a higher risk of cirrhosis when aggregate alcohol consumption increases.
A comparison of Australian and international studies in alcohol consumption effect on total, male and female cirrhosis mortality rates
| Countries or regions | Time period | Effecta | ||
|---|---|---|---|---|
| Total (%) | Male (%) | Female (%) | ||
| 5 English-speaking beer-drinking countries (Kerr et al., 2000) | 1953–1993 | 16 | – | – |
| UK (Mills, 2007) | 1973–2002 | 18 | – | – |
| USA (47 states) (Ye and Kerr, 2011) | 1968–2002 | 9 | – | – |
| Australia | 1935–2006 | 10 | 9 | 11 |
| 9 Eastern European countries (Ramstedt, 2007) | 1950–2003 | 8 | 10 | 7 |
| Spirit countries | 10 | 12 | 9 | |
| Non-spirit countries | 6 | 8 | 5 | |
| 14 European countries (Ramstedt, 2001) | 1950–1995 | – | 14 | 8 |
| Northern Europe | – | 30 | 16 | |
| Central Europe | – | 9 | 5 | |
| Southern Europe | – | 10 | 11 | |
| Canada (9 provinces) (Ramstedt, 2003) | 1950–1998 | – | 17 | 13 |
| Ontario (Mann et al., 2005) | 1968–1989 | – | 14 | 16 |
aEffect of a 1-l increase in alcohol consumption on rises in mortality rate from liver cirrhosis.
CONCLUSIONS
The present temporal analyses support a well-established finding in alcohol research. The Australian case verifies that per capita alcohol consumption is positively and significantly related to the mortality rate of liver disease. When we explored the variation in this relationship over time, we found a reduction in the alcohol effect size in recent years, along with some interesting beverage-specific variations. In particular, spirits consumption was found to be a strong predictor of liver disease mortality rates between 1935 and 1975, but weak and insignificant between 1976 and 2006. The association between wine consumption and liver disease mortality was weak and insignificant at both time periods. Beer consumption has historically made up the biggest share of the total alcohol consumption in Australia, but the effect of beer consumption on liver disease mortality was weaker than the effect of spirits between 1935 and 1975. From 1975 to 2006, beer consumption was the only significant beverage predictor for the liver diseases.
These results are partly consistent with the findings of Kerr et al. (2000) that spirits is the most significant beverage-specific predictor of cirrhosis mortality, although the shift in the most recent time period suggests that this does not reflect some specific property of spirits. A more likely explanation for this finding is that the drinking patterns of spirits users used to be substantially different from patterns of wine or beer users, and that this changed over the course of the century such that beer drinkers had more problematic drinking patterns in the most recent years.
There is little available historical information on the relationship between beverage type and consumption patterns in Australia, but recent data do suggest that beer is commonly consumed by the riskiest drinkers in Australia (Stockwell et al., 2008; Room et al., 2011). Kerr et al. (2000) postulated that price may be the driving factor and spirits, at least in recent decades, have been the most expensive form of alcohol in Australia. Indeed, recent analyses highlight that the historical variations in alcohol taxation in Australia are consistent with price being a key consideration here (Manton, 2013). Between 1939 and 1973 spirits were taxed at lower levels per unit of alcohol than beer, with tax rates as low as half of the beer rate. Since the mid-1970s, spirits taxes have increased substantially, reaching levels more than three times those for beer in the 1990s. These significant excise changes may be a key to explaining the shift in the beverage-specific relationships between alcohol and liver disease mortality at the aggregate level via shifts in the consumption preferences of the heaviest drinkers.
Previous studies have found significant gender differences in the association between aggregate alcohol consumption and cirrhosis mortality. Some studies found that male cirrhosis mortality increases more than female when there is an increase in per capita alcohol consumption, while others have found the opposite (Ramstedt, 2001, 2003). Our study finds little difference between males and females in this respect, which suggests that changes in per capita consumption affect drinking among the heaviest drinking men and women in Australia in a roughly equivalent way.
The international comparisons suggest that the relationship between per capita alcohol consumption and liver disease mortality in Australia falls somewhere between those found in Northern Europe and those in Central Europe, and is broadly in line with those found in the USA and Southern and Eastern Europe. This fits with previous research implicating drinking pattern above and beyond drinking volume as a risk factor for liver disease (Bellentani et al., 1997).
We also examined whether the relationship between per capita alcohol consumption and liver disease mortality had changed over time in Australia, by comparing models fitted to two time periods (1935–1970 and 1971–2006). The finding that the alcohol effect was substantially smaller in the more recent period requires further research to explain. Earlier Australian research suggested a weakening of the relationship between per capita alcohol consumption and liver cirrhosis over time (Rankin et al., 1985), which may reflect general changes driven by, for example, improved nutrition or more effective treatment over the course of the twentieth century. On the other hand, our results may reflect the increasing impact of hepatitis C reducing the relative importance of alcohol consumption on liver cirrhosis in Australia, with estimates of cirrhosis incidence due to HCV rising from 322 per 100,000 people in 1965 to more than 5000 per 100,000 in 2005 (Wodak et al., 2006). However, as discussed earlier, the effect of alcohol consumption on cirrhosis mortality might possibly increase with higher rates of HCV, given the high rates of alcohol-related liver disease mortality in HCV cohorts (Gruenewald and Ponicki, 1995b). Other reasons for the reduced alcohol effect might include improved treatment of liver disease, meaning that mortality rates are less easily shifted by changes in drinking behaviour, changes in drinking patterns or, given our beverage-specific findings, the reduction in beer consumption in the latter part of the study period. A further potential explanation might relate to the broad trends in consumption in the two periods studied. In the first, alcohol consumption was generally increasing, while in the second it was largely declining. The relation of increases in population consumption to cirrhosis mortality may be different from the relation to reductions. For example, very heavy drinkers with high risk of cirrhosis mortality may have more trouble reducing their drinking when consumption generally is increasing than they do during periods of declining consumption.
Our findings support the substantial literature which demonstrates a link between per capita consumption of alcohol and liver disease mortality (Corrao et al., 1998; Rehm et al., 2010). This consistent international link suggests that policy approaches that reduce per capita alcohol consumption are likely to reduce mortality from liver disease. However, the variation over time in effect size (both at the overall level and in terms of specific beverages) suggests that this relationship is complex, and mediated by a range of potential other factors. In particular, there is some evidence that drinking pattern may affect cirrhosis mortality (even controlling for drinking volume) (Dawson et al., 2008), so changes in how alcohol is consumed (as well as how much is consumed) may be critical (although the evidence remains mixed on this point (Rehm et al., 2010)). Further, the shift between spirits and beer as the most influential beverage type in these analyses is suggestive of a role for alcohol pricing in reducing liver disease mortality, mirroring as it does a shift in the approach to excise taxation for these two beverages (Manton, 2013). These findings (while only suggestive) fit with a broader literature that highlights the potential association between alcohol taxation and alcohol-related mortality (Kimmo et al., 2008; Wagenaar et al., 2009), and reinforce the potential of pricing policy to reduce a range of negative alcohol-related outcomes (Babor et al., 2010).
Funding
The research was funded by a project grant from the Australian National Health and Medical Research Council (#566629). The Centre for Alcohol Policy is funded by the Foundation for Alcohol Research and Education (FARE), an independent, charitable organization working to prevent the harmful use of alcohol in Australia (www.fare.org.au). M.L. is supported by a National Health and Medical Research Council Early Career Fellowship, P.D. is supported by an ARC Future Fellowship and R.R.'s position is supported by the Victoria Department of Health.
Conflict of interest statement
None declared.
