


Abstract
Background Diverse opinions have emerged about the best way to scale up malaria interventions. Three controversies seem most important: (1) should the scale-up focus on a broader target of febrile illness (including infectious disease and pneumonia)? (2) should the scale-up feature a single intervention or be targeted to the situation? (3) should scale-up have a preference for one kind of delivery mechanism or another?
Methods A decision model of 576 nodes describes the patterns of access, treatment and outcomes of an episode of febrile illness for a child below 5 years. Incremental costs and outcomes relative to baseline (2010) are computed for particular scenarios for Ethiopia using data from the literature. Two perspectives define the relevant costs: society at large and financiers (government and donors) where the costs borne by households are not included.
Findings Scaling up malaria interventions by one means or another is a very inexpensive way of saving young lives in poor countries. The low cost per life saved stems from two main reasons: the excessive baseline costs of presumptive use of antimalarial drugs for non-malaria cases, and the excessive costs of delayed treatment of pneumonia. A very limited policy of supplying antibiotics to facilities to eliminate stockouts would save 2100 lives, at a cost of only $615 a life. A much broader programme option, bundling malaria and pneumonia together for patients presenting with febrile illness [including rapid diagnostic test (RDT) for malaria, respiratory rate timers (RRTs) and free antibiotics], would save tens of thousands of young lives at and still cost society less than child fever management in the baseline situation! It is not clear that scale-up via community health workers (CHWs) is to be preferred to a facility-based intervention. The delivery through CHWs allows for a broader coverage of using RDT and RRT, but with limited effectiveness due to limited skills of CHWs in treating and managing patients.
Introduction
After $1.5 billion in international funding for malaria in 2009 and much success (World Health Organization 2010), the prospects of further scale-up of the malaria treatment programme has begun to expose diverse opinions about the best way forward. Accompanying the shortage of financing have been concerns about issues such as high costs, diminished pay off, drug wastage, provider compliance rigidities, how best to access rural and isolated groups, and others (Reyburn et al. 2004; Bell et al. 2006; d’Acremont et al. 2010; Cohen et al. 2011). Proposals for scaling up need to cope with these issues, and experts have come to see the way forward in quite different ways. The programme of Affordable Medicines Facility—malaria (AMFm) starts addressing some of these issues with promising results (Littrell et al. 2011; ICF International and London School of Hygiene & Tropical Medicine 2012; Tougher et al. 2012; Malm et al. 2013).
One area about the scale-up reacts to concerns about the high levels of inappropriate use of antimalarial drugs (AMDs), including artemisinin-based combination therapies (ACTs), and the shortage of essential drugs (i.e. antibiotics) in resource-limited settings. One possible scale-up strategy to address the concerns would be to amend the ‘malaria model’ by adding antibiotics (e.g. commodities) to eliminate antibiotic stockouts. Alternatively, we could consider a broader strategy aimed at all febrile illness in order to better accommodate to provider practice realities. This kind of intervention might capture benefits from more appropriate (compliant) patterns of treatment (Hildenwall 2009). Broader interventions of febrile illness would combine pneumonia, malaria and even other diagnoses, along with new rapid testing technologies, making appropriate drugs widely available, and using training to support appropriate provider behaviours (World Health Organization 2010). This kind of solution might reduce widespread waste of ACTs and get antibiotics to patients who need them more quickly.
Beyond scale-up solutions that would bundle diagnoses and better integrate treatment decisions, other lines of thinking are beginning to suggest that further scale-up must move beyond the idea of ‘one type of universal malaria or bundled solution with multiple interventions’. This thinking is beginning to consider more nuanced, or tailored, or targeted programmes, where different kinds of interventions and delivery mechanisms could be implemented in different situations (Sabot et al. 2011; Tren et al. 2012).
The third important dimension on which opinion seems to be fracturing relates to how the delivery system needs to be structured to support scale-up (Steketee and Eisele 2009). Both kinds of alternate thinking about scale-up noted earlier (bundling or not, and targeted or not) are suggestive of a broader integration of the programme with extant health services delivery structures and policy. Some see the need to emphasize the role of trained community health workers (CHWs) to eliminate distance and knowledge barriers and allow scale-up to reach the vast majority of the population (Chanda et al. 2011). Others see the scale-up differently, emphasizing health facilities including private facilities (Chinkhumba et al. 2010), reasoning that training costs for CHWs are high and that some countries have not chosen the CHW as an important form of service delivery.
Methods
A decision model is used to examine the consequences of alternative ways of scaling up the malaria intervention for children below 5 years. The impacts of intervention changes are computed by differencing baseline outcomes (costs, mortality) with the modelling results obtained for a particular intervention scenario. Both health system and societal perspectives are used for defining the relevant costs (and cost savings).
The modelling is based on Ethiopia, using data for a baseline of 2010, the most recent time for which the data on some key epidemiological parameters were available. We chose Ethiopia because it has a mid-range incidence of malaria, a mixed delivery system (CHWs and facilities) and three successful grants from the Global Fund for Malaria programming (The Global Fund 2013). In 2010, Ethiopia had nearly 14 million people below age 5 (United Nations Statistics Division 2012). Incidences of malaria and pneumonia in this population are estimated at 0.15 and 0.30 per person year, respectively (Salomon et al. 2011). Deaths from malaria and pneumonia are about 16 200 and 88 000, respectively. Febrile illness is treated in facilities (16%), by access to a CHW (1%) and by self-treatment (83%) (Salomon et al. 2011). In the country, there are 412 government health facilities with 1806 physicians and 35 000 CHWs (World Health Organization 2010). For persons treated in government facilities, we assume that about 40% of the febrile cases now get rapid diagnostic tests (RDTs) (Nankabirwa et al. 2009; Ndofor et al. 2013) and 30% of the time when antibiotics are prescribed, they are not available (Ministry of Health of Ethiopia and WHO 2003; Carasso et al. 2009).
Five scenarios are used to understand likely impacts of scaling up the current activities to fight malaria. The determination of scenarios of interest was based on initial discussions with programme officials in the Global Fund and the Bill and Melinda Gates Foundation, followed up with a review of policy discussions found in the literature. The five scenarios include a limited intervention scenario wherein antibiotics would be provided to health facilities in amounts that would eliminate stockouts, which occur about 30% of the time at baseline, and four scenarios defined by interacting the disease scope of the scale-up (two approaches) with the way service delivery are done (two approaches). In all four of these scale-up scenarios, we made no changes in the way the private sector functioned, other than the way scale-up alters the numbers of patients seeking care in that sector.
All scale-up options assume that there will be increases in the number of children with febrile illness who are seen by providers. Now, only about 16% are seen in Ethiopia (Salomon et al. 2011). In two of the scenarios, we assumed expansion to 50% (these scale-up scenarios utilize a service delivery model featuring facility-based care). Two other scenarios expand care seeking to 80% of children with febrile illness (these scale-up scenarios utilize service delivery centred around CHWs).
We defined two scale-up approaches regarding disease scope; one scale-up possibility is to continue the current intervention of focusing on malaria alone, but enhanced by adding universal access to RDT; the other scope option is to broaden the malaria programme to include helping providers identify and treat pneumonia. This would be done with added interventions including provision of antibiotics, and by making respiratory rate timers (RRTs) available. The ‘bundled’ scenarios referenced in the tables and figures refer to scaling up interventions to manage both malaria and pneumonia.
The model is illustrated in Supplementary Figure S1. For an episode of febrile illness, the model captures sequence of choices and results in 576 nodes. The sequence includes
family decisions about whether and where to seek care (facility, CHW, self-treatment);
provider approach to diagnosing the underlying condition (microscopy, RDT, RDT+RRT, presumptive);
given the diagnosis result, provider decision about test compliance and decisions about treatment;
course of the condition and subsequent care needs (hospital stay, follow-up outpatient care, nothing);
outcomes in terms of total costs and mortality.
Scenarios are created by positing changes in one or more baseline parameters. In the case of parameters like adherence (compliance) rates and disease incidence rates, we also examine the sensitivity of scenario outcomes to a range of plausible values for the parameter in question. The characteristics for each scenario are shown in Table 1.
Parameters that differentiate the baseline and five intervention scenarios
| Baseline | 1 | 2 | 3 | 4 | 5 | |
|---|---|---|---|---|---|---|
| Antibioticsa | Malaria-Facilityb | Bundled-Facilityc | Malaria-CHWd | Bundled-CHWe | ||
| Facility access rate (%) | 16 | 16 | 40 | 40 | 10 | 10 |
| CHW access rate (%) | 1 | 1 | 10 | 10 | 70 | 70 |
| Self-treat rate (%) | 83 | 83 | 50 | 50 | 20 | 20 |
| Facility antibiotics availability (%) | 70 | 95 | 70 | 70 | 95 | 95 |
| Use rate of RDT-facilities (%) | 40 | 40 | 100 | 100 | 100 | 100 |
| Use rate of RDT-CHW (%) | 0 | 0 | 100 | 100 | 100 | 100 |
| Use rate of RRT in facilities (%) | 0 | 0 | 0 | 100 | 0 | 100 |
| Use rate of RRT in CHW (%) | 0 | 0 | 0 | 100 | 0 | 100 |
| RDT negative compliance (%) | 60 | 60 | 100 | 100 | 100 | 100 |
| RRT negative compliance (%) | 90 | 90 |
aAssuming that availability of antibiotic increases from 70% to 95%.
bAssuming that 40% of febrile cases seek case at health facilities, increased from 16% at the baseline, RDT scales up from 40% to 100% in health facilities, use of RDT among CHW increases from 0% to 100%, the adherence to malaria test results increases from 60% to 100%.
cIn addition to changes in Scenario 2, it assumes that RRTs are fully used by both health facilities and CHWs to diagnose pneumonia, with RRT compliance rate of 90%.
dIn addition to changes in Scenario 2 except few cases seeking care at health facilities, it assumes that CHWs took major role in diagnosing and managing 70% febrile cases, self-treatment cases reduced from 83% to 20%, and availability of antibiotics increase from 70% to 100%.
eIn addition to changes in Scenario 4, it assumes that RRTs are fully used by both health facilities and CHWs to diagnose pneumonia, with RRT compliance rate of 90%.
The scenarios differ not only in terms of the access to care assumption but also in terms of the practice patterns, or choices, of providers. Overall compliance with RDT negative test results (not giving ACTs when RDT test results are negative) is assumed to be improved in all the scale-up scenarios since the initial introduction of RDT, RRT and antibiotics at least will appropriately treat those who are given ACT due to lack of antibiotics.
The data for modelling the baseline situation in such a complex model are not fully available for any country. Parameters are taken to the extent possible from the 2010 values for Ethiopia available from the World Health Organization, CHOosing Interventions that are Cost Effective (WHO-CHOICE). Other important data sources include extensive African malaria modelling efforts by Salomon et al. (2011) and Shillcutt et al. (2008). Other data sources used are also identified in the data and assumption tables provided in the Supplementary data. If data were not available from these sources or the literature, assumptions were made to perform the simulation. The baseline model assumptions were also adjusted to conform to known child death rates for malaria and pneumonia.1 Due to the lack of data on the case fatality rate (CFR) of malaria and pneumonia, we did not distinguish the CFRs by treatment settings. The key epidemiological and cost parameters are showed in Tables 2 and 3.
Key epidemiological parameters among children below 5 years
| Parameters | Estimate (%) | Source |
|---|---|---|
| Epidemiology | ||
| Incidence of febrile illness (per person year) | 56 | Salomon et al. (2011) |
| Incidence of malaria (per person year) | 15 | Salomon et al. (2011) |
| Incidence of pneumonia (per person year) | 30 | Salomon et al. (2011) |
| Incidence of co-infection of malaria and pneumonia (per person year) | 2 | d’Acremont et al. (2010) |
| Care seeking behaviour | ||
| Receiving care at health facilities | 16 | Salomon et al. (2011) |
| Receiving care at community health workers | 1 | Salomon et al. (2011) |
| Self-treatment | 83 | Salomon et al. (2011) |
| Sensitivity and specificity of diagnostic approaches | ||
| Sensitivity of RDT | 93 | Meena et al. (2009) |
| Specificity of RDT | 98 | Meena et al. (2009) |
| Sensitivity of microscopy | 79 | Uzochukwu et al. (2009) |
| Specificity of microscopy | 82 | Uzochukwu et al. (2009) |
| Sensitivity of presumptive diagnosis for malaria | 85–90 | Ajayi et al. (2009) |
| Specificity of presumptive diagnosis for malaria | 20–42 | Ajayi et al. (2009) |
| Sensitivity of RRT | 80 | Assumption |
| Specificity of RRT | 75 | Assumption |
| Sensitivity of presumptive diagnosis for pneumonia | 40–80 | Assumption |
| Specificity of presumptive diagnosis for pneumonia | 35–63 | Assumption |
| Case fatality rate | ||
| Malaria CHWs treated with initial proper treatment | 3 | Assumption + calibration |
| Malaria treated without initial proper treatment | 1 | Assumption + calibration |
| Pneumonia without initial proper treatment | 6 | Gwer et al. (2007) + calibration |
| Pneumonia with initial proper treatment | 2 | Assumption + calibration |
Key cost estimates used in the model
| Parameters | Estimate($) | Sources or assumptions |
|---|---|---|
| Diagnostics | ||
| RDT | 0.80 | Lemma et al. (2011); Uzochukwu et al. (2009) |
| Microscopy | 1.30 | Chanda et al. (2009); Uzochukwu et al. (2009) |
| RRT | 3.50 | Assumption |
| Drugs (per treatment course) | ||
| ACT for uncomplicated plasmodium falciparum (p.f.) cases | 1.59 | Tougher et al. (2012) + assumption |
| Choloquine for uncomplicated plasmodium vivax (p.v.) cases | 0.90 | $0.3 per day for 3 days |
| Intravenous quinine for severe malaria cases | 5.47 | Uzochukwu et al. (2009) |
| Antibiotics for uncomplicated pneumonia | 2.52 | Banja (2010) |
| Antibiotics for complicated pneumonia | 15.54 | Banja (2010) |
| Health care cost | ||
| Inpatient health care cost (per bed day) | 3.56 | WHO-CHOICE |
| Outpatient health care cost (per visit) | 0.98 | WHO-CHOICE |
| Lab cost for inpatients | ||
| Lab cost for malaria inpatients | 36 | Kone et al. (2010) |
| Lab cost for pneumonia inpatients | 36 | Kone et al. (2010) + assumption |
| Cost of training | ||
| Cost of training/CHW (bundled) | 50 | $5 for material cost + half day of training and per diem |
| Cost of training/CHW (unbundled) | 100 | $10 for material cost + 1 day of training and per diem |
Results
The baseline situation is shown in the first column of Table 4. Using the model, we estimate the baseline 2010 level of total spending on febrile illness at about $50 million a year in Ethiopia, about 44% of which is financed directly by households, mainly on purchases of drugs from retail private sources. Government/donor cost on febrile illness (66% of $50 million) is mainly on hospital and health facility follow-up care (85%) and both AMDs and antibiotics (14%). The level of government cost on antibiotics is not much different than the amount costed by households. Nearly 113 000 children died from febrile illness at baseline, over 75% of them from pneumonia.
Annual costs and deaths for febrile cases <5 in Ethiopia for baseline and five intervention scenariosa
| 1 | 2 | 3 | 4 | 5 | ||
|---|---|---|---|---|---|---|
| Baseline | Antibiotics | Malaria-Facility | Bundled-Facility | Malaria-CHW | Bundled-CHW | |
| Health outcomes | ||||||
| Number of death due to co-infection | 9351 | 9331 | 8139 | 7697 | 7078 | 6371 |
| Number of malaria death | 16 226 | 16 311 | 15 608 | 15 760 | 15 158 | 15 461 |
| Number of pneumonia death | 87 771 | 85 607 | 83 551 | 71 698 | 79 114 | 60 150 |
| Total death | 113 348 | 111 250 | 107 298 | 95 155 | 101 350 | 81 982 |
| Death rate (per 1000 population) | 19.61 | 19.46 | 19.17 | 18.29 | 18.74 | 17.34 |
| Costs of government/donors ($) | ||||||
| Cost of RDT | 435 192 | 435 192 | 3 473 242 | 3 473 242 | 5 953 043 | 5 953 043 |
| Cost of RRT | 0 | 0 | 0 | 128 821 | 0 | 128 821 |
| Cost of antibiotics | 2 501 487 | 3 170 917 | 8 115 278 | 9 276 373 | 14 637 600 | 15 012 134 |
| Cost of AMD | 1 325 864 | 1 149 023 | 2 483 594 | 1 824 247 | 4 200 546 | 2 995 063 |
| Cost of training | 0 | 0 | 3 500 000 | 1 750 000 | 3 500 000 | 1 750 000 |
| Other health care costb | 23 930 748 | 24 729 494 | 23 629 947 | 24 960 762 | 26 992 063 | 27 324 514 |
| Subtotal | 28 193 291 | 29 484 626 | 41 202 060 | 41 413 445 | 55 283 252 | 53 163 575 |
| Costs of household (HH) ($) | ||||||
| HH transportation cost | 888 601 | 888 601 | 2 221 503 | 2 221 503 | 555 376 | 555 376 |
| HH cost of AMD | 7 834 026 | 7 834 026 | 4 337 430 | 4 337 430 | 1 734 972 | 1 734 972 |
| HH cost of antibiotics | 13 245 491 | 13 245 491 | 7 979 211 | 7 979 211 | 3 191 685 | 3 191 685 |
| Subtotal | 21 968 118 | 21 968 118 | 14 538 145 | 14 538 145 | 5 482 032 | 5 482 032 |
| Total ($) | 50 161 409 | 51 452 744 | 55 740 205 | 55 951 589 | 60 765 284 | 58 645 607 |
| Cost/life saved (programme) | 615 | 2150 | 727 | 2258 | 796 | |
| Cost/life saved (society) | 615 | 922 | 318 | 884 | 270 | |
AMD, anti-malaria drug, including ACT, chloroquine and quinine.
aSame note for the five intervention scenarios as Table 1.
bOther health care costs include the labour costs of medical staff, facility capital costs and costs of laboratory tests other than RDT and RRT.
Question 1: Does eliminating the antibiotic stockouts in government facilities save lives and create efficiencies relative to baseline? We created an intervention scenario wherein sufficient antibiotics were purchased and distributed to government facilities to eliminate stockouts, which at baseline are assumed to be 30% (in 3 of 10 patients where the clinician would administer antibiotics, such drugs are not available at the facility). No other changes from the baseline were made in this scenario, including no changes in the use of the private sector delivery system. The cost of the programme is limited to the costs of the antibiotics (the supply systems are not altered in the scenario). The benefits will be the reductions in deaths for persons who did not promptly receive antibiotics (pneumonia deaths) and cost savings achieved by not wasting the free AMDs that are often administered by clinicians who are often pressured to ‘do something’ when faced with stockouts for the drug of choice.
The results for this scenario are shown in the second column of Table 4. The programme would cost about $670 000 a year for the additional antibiotics, another $800 000 in other health care costs that include labour costs of medical staff, facility capital costs, and costs of laboratory tests other than RDT and RRT, and result in saving 2100 pneumonia deaths in children. The cost per life saved is only $615. One reason this is so inexpensive is that the added costs of testing and other health care are offset by the reduced costs of presumptive use of AMDs including ACTs. A weakness of this very limited intervention is that (without supplementary provision of RDT) only about 40% of suspected malaria cases treated in health facilities are able to be tested with RDT. This commodity strategy for antibiotics is a better payoff (for society and for governments/donors) when pneumonia incidence rates are higher. As Figures 5 and 6 indicate, as incidence rates for pneumonia rise, the costs per life saved become even lower.
Question 2: Does scale-up using a bundled approach to febrile illness yield more programme efficiencies and saved lives than a malaria-only approach? Bundling directly addresses the clinical distortions created by better clinician access to AMDs than to other treatments for conditions that also present as a febrile illness. These distortions manifest as excessive use of the least expensive/more accessible treatment alternative when clinicians face a situation of uncertainty about the underlying condition. The bundled programme would improve access to RDT for malaria, would provide universal access to RRTs (to better discriminate the condition of pneumonia and compromised pulmonary function) and would offer required supplies of both AMDs, including ACTs, and antibiotics (e.g. no stockouts at facilities). We would expect an increase in lives saved (particularly for pneumonia) and modest increments in cost because the costs of the programme of interventions would be largely offset by the reduction in wastage of AMDs. Results are shown on Table 4. In that table, the bundled programme results are shown in column 3 (emphasizing facility-delivered mechanism) and column 5 (emphasizing CHW-delivered mechanism). The scale-up is evident in assumptions made about access to government providers in all scenarios. Now about 83% of febrile patients are self-treated (Salomon et al. 2011), with or without privately purchased pharmaceuticals. In the roll out scenarios, we alternatively assume that this is reduced to 50% (in the case where facility delivery is emphasized) and to 20% (where the intervention emphasizes the CHW strategy, where there are much more widely dispersed points of testing and treatment services).
As a scale up alternative, the bundling alternatives (Scenarios 3 and 5) save more lives saved than the malaria-only intervention (Scenarios 2 and 4). In terms of net cost outlays by government/donors, the bundled programme roll out that emphasizes the facility delivery mechanism (Scenario 3) would cost about $13 million each year more than current intervention (Baseline). The malaria-only programme under the same assumptions (Scenario 2) would cost $13 million over baseline. The scale-up that emphasizes CHWs would have a net incremental cost increase over baseline of $25 million for the bundled programme (Scenario 5) and $27 million for the malaria-only programme (Scenario 4). While costing more to implement (RRTs and antibiotics), the net costs of bundling are lower or similar relative to the malaria-only programme primarily because of savings that accrue by reducing the wasted AMDs (partly by reducing stockouts for antibiotics and by improving the accuracy of diagnosis). There is no real differential in the household costs between the bundled scale-up with the scale-up that continues to emphasize malaria only.
Scale-up of a bundling alternative improves febrile care outcomes for the population under 5 more than a malaria-only intervention. The savings in lives are primarily due to fewer deaths from pneumonia. Using a facility-focused delivery model, the bundled intervention saves about 18 000 lives each year relative to baseline. The malaria-only intervention would save only about 6000 lives. With the CHW delivery emphasis the mortality benefits of bundling are even more pronounced: with bundling about 31 000 lives would be saved a year, and for a malaria-only roll out, only about 12 000 lives would be saved. Consequently, cost per life saved is far lower for bundled scale-up than for malaria-only scale up. When considering the costs borne by donors/government and households, the bundled intervention scale up more than pays for itself from society’s perspective. The cost reductions of the scale-up for the households are not relevant for the government/donor perspective, so the cost per life saved from this perspective is much greater, though they still favour a bundled intervention.
Question 3: Does it matter how scale-up is delivered? Does the emphasis on one or the other service delivery modality influence intervention efficiency and mortality? The intervention options we tested here are defined by a CHW dominant one (80% overall coverage, with 70% going to CHWs and only 10% to facilities) and a facility dominant model (only 50% coverage, of which 40% seek care in facilities and only 10% to CHWs). These results are shown in Table 4, columns 2 and 4, respectively. CHWs require lots of expensive training, but more people can be reached because distance and ignorance barriers to care-seeking are lower.
The overall costs for scaling up via CHW are higher mainly because of the further reach of the programme to more people. The added net costs to the government/donors for the facility centred model of scale-up will be around $13 million, whereas the CHW approach will cost twice that much ($25–27M). The delivery model emphasizing facilities saves far fewer lives (6000–18 000 lives) than the CHW model (12 000–31 000). Overall, from the vantage point of payers or from the vantage point of society at large, the cost per life saved is somewhat lower for a facility-based roll out (for both a bundled and unbundled service approach).
Sensitivity tests
To better understand the impact of delivery system options on outcomes, we performed sensitivity tests. Table 5 shows some sensitivity tests on the mix of the two delivery systems, holding overall scale-up access constant at 50% (e.g. 50% of the population are self-treated). For example, when 20% of the families seek care in facilities, it means that 30% seek care with CHWs. When 50% seek care in facilities, it means that 0% seek care with CHWs. Whether the intervention is bundled or not, from the perspective of the donor/government, it is more cost effective to make maximum use of facilities in delivering the scaled up intervention. As the care seeking choices emphasize more and more use of facilities, the cost per life saved falls. However, from the societal perspective, the story is mixed: the cost per life saved drops when using more and more health facilities to deliver the service for the unbundled intervention, but the cost per life saved increases for the bundled intervention. This is due to the higher facility costs in comparison with the unbundled facility-delivered option, for treating pneumonia, which is part of the bundled intervention.
Sensitivity of cost per life saved to mix of delivery system models
| Seeking care in health facility (%) | Cost/life saved ($) | |||
|---|---|---|---|---|
| Government/donors | Society | |||
| Malaria- Facility | Bundled- Facility | Malaria- Facility | Bundled- Facility | |
| 0 | 2701 | 777 | 1118 | 246 |
| 10 | 2564 | 764 | 1069 | 264 |
| 20 | 2427 | 752 | 1020 | 282 |
| 30 | 2289 | 739 | 971 | 300 |
| 40 | 2150 | 727 | 922 | 318 |
| 50 | 2011 | 714 | 873 | 336 |
How important is provider compliance with diagnostic testing in scale-up effectiveness? Compliance rates with RDT negative findings for malaria in facilities were assumed to be 60% in the baseline and 100% in the scale-up options. In the case of CHW, we assume that this compliance rate is also 100%. Figures 1 and 2 examine the effect of varying these compliance assumptions for RDT tests. As expected, better compliance rates, other things the same, reduce the cost per life saved for all approaches to scale up and from the perspective of the financiers or society at large. Improving compliance is one key to improving the efficiency of these interventions.
Sensitivity of outcomes to compliance with RDT results for donors/government
Sensitivity of outcomes to compliance with RDT results for society
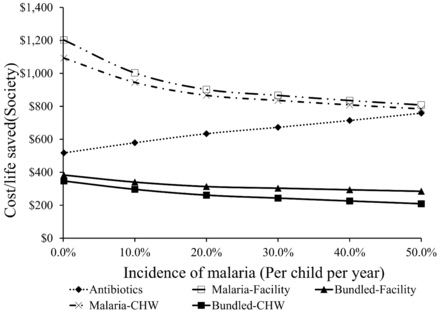
Do scale-up options perform equally well across places with different disease patterns? Keeping the incidence of pneumonia at the baseline level of 0.30 per child per year, when the incidence of malaria is increasing between 0% and about 15% per child per year, the cost per life saved from scaling up the RDT intervention in both facilities and CHW settings decreases from the government/donors perspective. Beyond the incidence of malaria of about 15%, higher malaria incidence is associated with higher cost per life saved for all four of the scale-up strategies from donor/government perspective. Figures 3 and 4 show these results. In the latter case, with moderate malaria burden, and without considering the savings from households, this pattern is largely the result of less wastage from presumptive use of ACTs when malaria incidence gets higher. More intuitively, as malaria incidence increases, the presumptive diagnosis of malaria by default becomes more rational. Investment in RDT becomes less attractive as more febrile cases are malaria cases. This wastage is a large component of financing for scale-up, hence the positive correlation between malaria incidence and cost per life saved. However, from the society’s perspective, the cost per life saved declines as the incidence of malaria increases.
Sensitivity of outcomes to incidence of malaria for government/donors
Sensitivity of outcomes to incidence of malaria for society
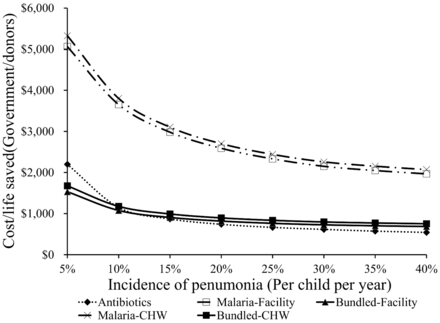
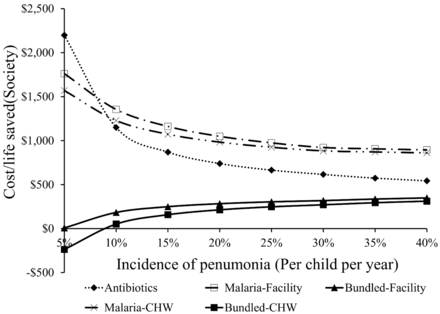
Holding the incidence of malaria at 15%, sensitivity to pneumonia incidence is more complex (see Figures 5 and 6). For donors/governments, all scale-up strategies have better payoffs as pneumonia incidence rates climb. For society as a whole, the scale-up featuring a malaria-only intervention also shows better payoffs as pneumonia rates climb, cet par. But, in the bundled approaches to scale up the cost per life saved become higher as pneumonia incidence rises. Essentially, the bundled intervention (of better diagnostics and commodities allows clinicians to find and treat pneumonia better) becomes less valuable as pneumonia incidence soars, largely because the savings per live saved from households declines (due to reduced costs for transportation, AMDs and antibiotics).
Sensitivity of outcomes to incidence of pneumonia for government/donors
Sensitivity of outcomes to incidence of pneumonia for society
Discussion
Although great efforts have been made towards malaria prevention such as the use of long-lasting insecticidal nets and indoor residual spraying (Otten et al. 2009), the malaria burden remains high and threatens population health. And, the economic burden is high on governments and on households. The case management of malaria cases becomes critical in saving lives and doing it in as economical a fashion as is possible. Improving quality and coverage of child fever case management programmes by one means or another seems to be a sensible and inexpensive way of saving young lives in poor countries. The benefits of the scale-up to households can be considerable, shifting the cost of care for febrile illness from their own pockets (mainly purchasing drugs from private pharmacies) to the scaled up public programme. From the vantage point of the financier, on the other hand, the scaling up costs are higher, ranging from $1000 to $3600 per life saved across the options we studied. This large disparity of interests reminds us of the huge financial burdens of out-of-pocket spending for health care in poor countries and how it influences policy discussions.
Would it save money and lives to pursue a policy limited to supplying antibiotics to facilities, reducing stockout problems? The answer to this question is affirmative. This tactic would save around 2100 young lives lost to pneumonia each year, at a cost of about $615 a life. But, this is not a scale-up strategy. Further low cost benefits could be achieved by investing more in scaling up other life-saving interventions associated with febrile illness and malaria in children.
Should the scale-up prefer a bundled intervention focusing on both malaria and pneumonia? The answer is yes. The bundled intervention has a lower cost per life saved in all cases: from the vantage point of the society and from the vantage point of the financier, and whether delivery emphasizes facilities or whether delivery emphasizes CHWs. This seems true because modelling shows that the vast majority of lives being saved in the scale-up are preventable pneumonia deaths, and the bundled intervention provides clinicians tools for doing a better job of identifying and treating pneumonia.
Should the scale-up prefer facility delivery or the use of CHWs? This is not clear from the modelling solution for the scenarios we studied. The accessibility advantages of CHWs may offer more upside total benefits, because the approach can likely reach more people. Getting high access rates is important since the benefits to households can be considerable as they (and their spending) can be shifted from the private to public sectors for their febrile illness care. But the facility-based scale-up is somewhat more efficient per life saved (than the CHW solution) when overall access rate is controlled in the comparison (Table 5). This advantage is due to a number of cost-related advantages of the facility model such as more accurate diagnosis of pneumonia and malaria, which significantly reduces the wastage of both ACTs and antibiotics. Facility-based rollout makes economic sense as far as it can go, but this strategy probably does not offer very high scale-up potential. Using CHWs or some other outreach approach is going to be required to reach remote and thinly populated areas.
We have no evidence that one scale-up intervention is to be preferred at low incidence rates, and another configuration at higher incidence rates. We find that from the government and donor perspective, cost per life saved is $100–200 (about 30–50% higher) across scale up scenarios when comparing a site with malaria incidence of 0.50 with a situation where incidence is only 0.20. In a setting with moderate malaria burden, the primary reason why high incidence populations cost more is that with high incidence, less of the presumptive usage of ACTs in the baseline is wasted, offering less potential as a course of financing for the scale-up. Whatever the intervention included, the scale-up is simply going to cost more per life saved when malaria incidence is high. This inverse relationship is consistent with literature showing an inverse relationship between the cost-effectiveness of a diagnostic test and incidence rate of the associated illness (Shillcutt et al. 2008). If one disease is dominant, investment in diagnostic tests to accurately diagnose the dominant disease will result in high cost/life saved.
There are some other implications of the modelling work. The modelling of impacts of the scale-up strategy for malaria tells an unusual story. From the perspective of donors and governments, the scale-up alternatives each save thousands of preventable pneumonia deaths, and are all largely financed by reduced spending on AMDs! For society at large, the story is the same, plus large benefits to households as the scale-up moves health care for febrile illness away from the out-of-pocket spending to the public sector. Why are the benefits of malaria intervention scale-up found in fewer pneumonia deaths? Why are cost impacts driven by the baseline levels of waste in the use of anti-malaria drugs? What has been happening in the malaria programme to date? This appears to be a story of distorted incentives facing clinicians. Pneumonia and malaria and other diseases usually present as fever in children. Rather than consider the interdependencies of the triage situation, the silo (vertical) programme for malaria distorted the incentives by making available copious supplies of free drugs for malaria (the Global Fund and other international donors have promoted ACTs by subsidizing private-sector ACT distribution) (Tozan et al. 2013). The lack of parasitological testing, the unreliability of tests when they are available, subjective clinical interpretations, and the pressures from experience and parents all contribute to the excessive use of the free and available ACTs. That is the bad news. The good news is that efforts to scale up RDT have been observed (Zhao et al. 2012) and the scale-up of RDT can use this waste (the product of the distortion) to partially finance the scale-up. Have the high level of the (preventable) pneumonia deaths at baseline been the result of the distortion? Probably, as the models confirm that compliance rates with RDT negative results are inversely correlated with pneumonia deaths. This is not a positive story about clinical decision-making incentives for the malaria-only intervention to date. It certainly suggests that co-dependent clinical problems are prone to distortion if one disease or treatment approach is singled out over the others. Such distortions should be larger the more co-dependent the diseases and the more important is subjectivity in the provider’s behaviour.
How quickly will the results predicted by the models actually occur even if RDTs and RRTs, free antibiotics and other interventions could be made to happen tomorrow? Changes in practice patterns will not happen quickly in the face of longstanding practices, family pressures and known levels (however modest) of unreliability of the tests. The model cannot help us here beyond sensitivity tests (Figures 1 and 2), but it is a very important problem. In the model, the effectiveness of training is not studied directly, but we do examine the sensitivity of outcomes to the rates of compliance (high, low, etc.). And, we find that compliance is a consistent and important predictor of cost effectiveness for these programmes.
Improvement of adherence to malaria or fever case management guidelines will take time to realize. Merely investing in the supply of diagnostic tests and free drugs does not necessarily bring about positive behaviour changes and compliance (Smith et al. 2009; Chandler et al. 2011, 2012). One approach to achieve compliance could be through additional training, and this would be slow and expensive. Some successful stories of using training to improve clinician adherence to testing results have been reported (Bastiaens et al. 2011; Chanda et al. 2011; Mukanga et al. 2011; Cohen et al. 2012). Another potential approach would be through provision of financial incentives for providers, possibly involving explicit criteria, a financial pool and some kind of ex post audit of records. Although the effectiveness of pay for performance in developing countries remains in dispute (Witter et al. 2012), in Rwanda and Haiti, for example, pay for performance to health providers and CHWs has shown great impact on maternal health services (Basinga et al. 2011; Zeng et al. 2012). A similar approach, in conjunction with strong implementation, could be considered in the malaria field to shape provider behaviour in a more direct and faster way.
The generalizability of these cost and mortality findings to the situation in other countries is not known. The sensitivity testing for baseline incidence rates and compliance parameters offers some guidance as to what to expect in countries with baseline febrile illness and care delivery situations different from Ethiopia. The model could be fit to baseline data from other countries.
Acknowledgements
This work was supported by the Bill and Melinda Gates Foundation (Contract 19203 to Brandeis University).
Endnote
1 All data, assumptions, modelling details and sensitivity testing results are available directly from the authors.
References
Author notes
†The model used in this research is available from the authors.
