


Abstract
A plausible cause of distress for voice hearers is listening to and believing the threats and criticisms heard. Qualitative research indicates that patients have understandable reasons to listen. This study aimed to develop the understanding of distress using this listening and believing framework. Measures were developed of listening and believing voices and the reasons, and associations with distress tested.
A cross-sectional study of patients hearing derogatory and threatening voices (N = 591). Listening and Believing–Assessment and Listening and Believing–Reasons item pools were completed, and assessments of distress. Exploratory and confirmatory factor analyses and structural equation modeling (SEM) were conducted.
52% (n = 307) of participants believed their voices most or all the time. Listening and believing had 4 factors: active listening, passive listening, believing, and disregarding. Higher levels of believing, active listening, and particularly passive listening were associated with higher levels of anxiety, depression, and voice distress. Reasons for listening and believing formed 7 factors: to better understand the threat; being too worn down to resist; to learn something insightful; being alone with time to listen; voices trying to capture attention; voices sounding like real people; and voices sounding like known people. Each type of reason was associated with active listening, passive listening, and believing. SEM showed that feeling worn down in particular accounted for listening and believing. Test–retest reliability of measures was excellent.
A framework of listening and believing negative voices has the potential to inform the understanding and treatment of voice distress.
Introduction
The appraisal account of voice distress1,2 has been important in understanding and treating the distress of people who hear voices. First highlighted over 25 years ago, meta-analysis indicates that appraisals concerning malevolence and omnipotence1 have substantial associations with voice-related distress.3 This understanding has largely formed the basis for cognitive behavioral techniques for helping patients hearing voices.4,5 Cross-sectional data show that power and malevolence each explain approximately a fifth of the variance in distress in voice hearers.2,3 Variance is therefore left unexplained. There are now endeavors to expand on this approach, for example by assessing perceived control in relation to voices.6 We aimed to identify appraisals that explain distress for a subtype of voices: derogatory and threatening voices (DTVs). Our view is that if a person listens to and believes what DTVs say—and there are understandable reasons why an individual would do that—then that will increase distress.
Lived experience has been central to building our account. Patient interviews were used to generate a grounded theory to explain why DTVs are listened to and believed.7 Twenty-one reasons for listening to and believing DTVs were identified, which were grouped into 6 higher order categories: to understand the voices; to be alert to the threat; a normal instinct to rely on sensory information; the voices can be of people known to the hearer; the DTVs use strategies to capture attention; and patients feel so worn down that it is hard to resist the voice experience.
This theoretical perspective requires quantitative testing. A first step is developing validated scales that assess key constructs outlined in this approach.8
Therefore we aimed to:
1. Develop an assessment scale for the degree of listening to and believing DTVs;
2. Develop an assessment scale for the reasons (appraisals) people listen to and believe DTVs;
3. Develop a full appraisal measure, a short-form version, and a very brief (5-item) version that can be used for different clinical and research purposes.
4. Test the hypothesis that listening to and believing DTVs predicts distress (anxiety, depression, and voice distress);
5. Test the hypothesis that the reasons for listening and believing are associated with the degree of listening to and believing DTVs; and
6. Identify the most important appraisals which predict listening to and believing DTVs.
Methods
Design
This cross-sectional observational study was conducted in 38 NHS mental health trusts between February 18, 2020 and December 3, 2021. NHS Trusts covered all the geographical regions of England. Two participant groups were recruited to conduct exploratory (part-A) and confirmatory (part-B) factor analyses. To assess test–retest reliability, a subgroup of part-B participants completed measures one week after their initial assessment. Informed consent was obtained from all participants. The study was approved by South Central Oxford-B NHS Research Ethics Committee (19/SC/0610).
Participants
Participants were identified and recruited by the National Institute of Health Research (NIHR) clinical research network. Participants were identified by clinicians who referred patients to the NIHR research teams, or via patients previously providing consent to be contacted for research. Participant inclusion criteria were:
1. Self-report endorsement of hearing voices at least once per week;
2. Endorsing derogatory and threatening voice content, defined as: (1) voices threatening to harm the participant; (2) threatening to harm people known by the participant; (3) voices telling the participant that they will be harmed by other people; (4) hearing voices which criticize them; or (5) tell them that other people are judging them negatively7;
3. Being aged 16 or older;
4. An ability to understand English well enough to complete the questionnaires without the use of a translator; and
5. Being under the care of mental health services.
There were no exclusion criteria. 308 participants took part in part-A, 283 in part-B, and 41 completed the test–retest assessment. Participants completed informed consent and the assessment measures either on paper, via an online survey (JISC; https://www.onlinesurveys.ac.uk/) or by reading out answers over the phone to the researcher while viewing a paper copy of the questionnaires.
Assessment Measures
Experiences of Voice Hearing
Participants were asked their age at the onset of DTVs. Three questions from the PSYRATS auditory hallucinations scale9 were delivered in self-report format and assessed voice frequency, duration, and degree of distress caused. Derogatory and threatening content was assessed via endorsement (yes/no) of the 5 definitions outlined in the inclusion criteria (see supplementary materials). The types of criticisms made by voices were assessed by adapting negative self-belief items in the Brief Core Schema scale10 (e.g. “I am unloved” became “over the past week has the nasty voice told you that you are unloved?”). The 5-point response options were rephrased to: 0 = no, 1 = rarely, 2 = 1–2 days, 3 = several days, and 4 = at least once per day.
Listening and Believing Questionnaire–Assessment (LB-A)
Individual items for this self-report questionnaire were generated from: (1) Qualitative interviews with people experiencing DTVs7; (2) The McPin Hearing Voices Lived Experience Advisory Panel (LEAP); and (3) Clinical psychologists with expertise in treating psychosis (B.S., E.Č., D.F., and L.J.)
Two theoretical factors informed the generation of items: (1) listening to DTVs and (2) believing DTVs. Reverse items were also included for both factors. Items for the listening factor covered both voluntary control (eg, “I want to keep listening to what the nasty voices have to say”) and involuntary control of auditory attention (eg There’s nothing I can do but listen to what the nasty voices say”). Items covered the period prior to voices starting (eg “I listen out for the nasty voices”), the point of onset of voices starting (eg “When the nasty voices start it’s almost impossible to ignore what they say”), and during the voice hearing experience itself (eg “It’s difficult to focus on anything other than what the nasty voices say”). The believing and disregarding subscales were generated to ensure that the amount of derogatory and threatening voice content a participant experiences does not affect the scoring, hence references to specific voice content were not included. Respondents were instructed to complete the questionnaire based on DTVs (termed “nasty voices”) only, not positive or neutral voices.
Response options ranged from 0 (never) to 3 (all the time) and the past week was the time frame of reference. Part-A participants completed the full initial item pool of 46 questions. Part-A data were analyzed and subsequently part-B participants completed the shortened version (18-items).
Listening and Believing Questionnaire–Reasons (LB-R)
Items for this self-report questionnaire were created from a qualitative study.7 The scale covered the 6 themes identified in that study. Additional items were generated from the LEAP and psychosis specialist clinical psychologists (B.S., D.F., and L.J.)
Part-A participants completed the full initial item pool of 74 questions. Part-A data were analyzed and part-B participants subsequently completed a shortened version (41 items).
Patient Health Questionnaire-9 (PHQ-9)
The PHQ-9 is a self-administered 9-item questionnaire assessing depression. Response options range from not at all (0) to nearly every day (3). Higher scores indicate greater severity. Internal consistency is excellent (Cronbach’s α = 0.89).11
Generalized Anxiety Disorder Questionnaire-7 (GAD-7)
The GAD-7 is a self-administered 7-item questionnaire assessing generalized anxiety disorder (GAD) symptoms. Response options range from not at all (0) to nearly every day (3). Higher scores indicate higher levels of anxiety. The internal consistency of the scale is excellent (Cronbach’s α = 0.92).12
Analysis
Analyses were conducted in R version-4.0.513 with packages lavaan,14 psych,15 lm.beta,16 and regsem.17 Factor analyses used oblimin rotation. Reduction of item pools was based on: factor loadings (<0.50 for assessment; <0.30 for reasons); cross-loading item (>0.30); item communality (<0.30); clarity of item phrasing; and creating theoretically coherent subscales. Model fit was assessed by: “reasonably good”=SRMR close to or below 0.08; RMSEA close to or below 0.06; CFI and TLI close to or greater than 0.9518; and “acceptable” = CFI and TLI 0.90–0.9519; and RMSEA < 0.08.20
To assess the factor structure of LB-A items, exploratory factor analysis (EFA) was conducted on part-A data using maximum likelihood estimation on the polychoric correlation matrix. Confirmatory factor analysis (CFA) was conducted on part-B data using diagonally weighted least square estimation owing to the ordinal data.21 A bifactor model with a general factor was carried out to assess the appropriateness of calculating a total score. Test–retest reliability was assessed using the intraclass correlation coefficient (ICC). Simple regressions between the scale factors and distress variables were conducted using part-B data. The simple regressions with distress were additionally run whilst controlling for the 4 most prevalent diagnostic groups (schizophrenia, psychosis not otherwise specified, borderline personality disorder, and depressive episode/disorder).
The individual reasons for listening to and believing DTVs (LB-R items) are not of theoretical or clinical interest in and of themselves, only if they predict the degree of listening to and believing DTVs. Hence, the reasons item pool was initially reduced using regularized SEM (regSEM)22 on part-A data to ensure each item predicted listening and/or believing. Active listening, passive listening, and believing nasty voices were regressed onto the 74-item pool and only items with a regression coefficient ≥ 0.01 across at least one of the dependent variables were retained. regSEM lasso is specifically designed to allow for the assessment of a complex model with a large number of parameters but with a limited number of observations.22 A series of arbitrary penalty values are applied to regression paths to artificially drive the coefficient down towards zero. The purpose is to simplify the measurement model and only retain important predictors via an exploratory search. Significant items are assessed based on their non-zero coefficients. A range of penalty values was tested to determine the best fitting model by means of the Bayesian Information Criterion (BIC).22 Retained items from the regSEM analysis were factor analyzed using minimum residual estimation on the polychoric correlation matrix, and the item pool was further reduced. A CFA model with a higher order factor (combining all latent variables) was carried out in order to assess the appropriateness of calculating a total score.
Sample B data were analyzed using CFA and robust maximum likelihood estimation (MLR) to create a full version of the scale. Further items were removed through CFA by assessing modification indices, factor loadings, and item content overlap. A shorter 16-item version of the reasons questionnaire was developed by regressing the higher order factor for the degree of listening to and believing nasty voices questionnaire onto the reasons item-pool using regSEM. This reduced the item pool, following which CFA was carried out using MLR. The internal consistency was tested using Cronbach’s alpha (α) and the correlation with the full version of the scale assessed.
The same regSEM lasso method was used to create a 5-item version of the measure. The 5 items chosen had the highest coefficients across different latent variables. The internal consistency was tested (α) and the correlation with the full version of the scale assessed.
The LB-A factors were regressed individually onto each of the latent factors obtained from the reasons questionnaire. P values were corrected for multiple comparisons using the Holm method.23
In order to identify the most important reasons for listening to and believing nasty voices, accounting for shared variance, 2 SEMs were carried out using part-A and B datasets combined (N = 576). LB-A factors were together regressed onto the latent LB-R factors (Understand, Worn down, Learn, Attention, Real people, Alone, I know). Given that a high degree of shared variance was expected between disregarding DTVs and listening and believing, a separate model was run regressing disregarding DTVs onto the LB-R factors.
Results
Basic Characteristics
The ethnicity of the participant group was broadly representative of the population of England.24 Most participants were single. Voice onset tended to be when participants were in their early 20s, and two-thirds of the participant group had a diagnosis of schizophrenia or psychosis not otherwise specified (table 1).
Socio-demographic and Clinical Characteristics
| Variable | Part-A (N = 308) | Part-B (N = 283) | |
|---|---|---|---|
| Data are n (%) unless otherwise stated | |||
| Age | M = 40.66 (SD = 13.11) | M = 40.95 (SD = 13.72) | |
| Gender | Male | 169 (55.23) | 162 (57.24) |
| Female | 134 (43.79) | 118 (41.70) | |
| Other | 3 (0.98) | 3 (1.06) | |
| Ethnicity | Asian or Asian British | 26 (8.64) | 8 (2.88) |
| Black, Black British, Caribbean, or African | 24 (7.97) | 16 (5.78) | |
| Mixed or multiple ethnic groups | 14 (4.65) | 4 (1.44) | |
| White | 228 (75.75) | 232 (83.76) | |
| Other ethnic group | 9 (2.99) | 17 (6.13) | |
| Marital status | Single | 217 (70.46) | 205 (72.44) |
| Married/ Civil partnership | 38 (12.34) | 32 (11.31) | |
| Cohabiting | 24 (7.79) | 18 (6.36) | |
| Divorced | 22 (7.14) | 25 (8.83) | |
| Widowed | 7 (2.27) | 3 (1.06) | |
| Employment status | Unemployed | 210 (68.18) | 190 (67.38) |
| Employed (part-time) | 23 (7.47) | 17 (6.03) | |
| Employed (full time) | 21 (6.81) | 20 (7.09) | |
| Voluntary work | 17 (5.52) | 13 (4.61) | |
| Retired | 11 (3.57) | 15 (5.32) | |
| Student | 11 (3.57) | 14 (4.96) | |
| Self-employed | 9 (2.92) | 7 (2.48) | |
| House wife/husband | 6 (1.95) | 6 (2.13) | |
| Living arrangements | Live alone | 134 (43.50) | 116 (41.14) |
| Live with parents | 62 (20.13) | 46 (16.31) | |
| Live with partner/spouse | 54 (17.53) | 44 (15.60) | |
| Supported accommodation | 15 (4.87) | 14 (4.97) | |
| Live with children | 11 (3.57) | 12 (4.26) | |
| Live with other family | 8 (2.60) | 6 (2.13) | |
| Live with friends | 5 (1.62) | 8 (2.84) | |
| Other | 19 (6.17) | 14 (4.97) | |
| Age of onset of voices | M = 22.98 (SD = 11.83) | M = 25.23 (SD = 13.21) | |
| Care team | Adult mental health team | 201 (65.26) | 174 (61.48) |
| Early intervention for psychosis service | 62 (20.13) | 47 (16.61) | |
| Inpatient unit | 41 (13.31) | 60 (21.20) | |
| Other | 4 (1.30) | 2 (0.71) | |
| Diagnosisa | Schizophrenia | 132 (42.86) | 120 (42.40) |
| Psychosis not otherwise specified | 71 (23.06) | 69 (24.38) | |
| Depressive episode/disorder | 48 (15.58) | 46 (16.25) | |
| Borderline personality disorder | 32 (10.39) | 48 (16.96) | |
| Schizoaffective disorder | 29 (9.42) | 21 (7.45) | |
| PTSD/complex PTSD | 22 (7.14) | 14 (4.95) | |
| Other anxiety disorder | 13 (4.22) | 14 (4.95) | |
| Bipolar affective disorder | 10 (3.25) | 13 (4.59) | |
| Other | 11 (3.57) | 15 (5.65) | |
Note: M = mean, SD = standard deviation.
aMultiple diagnoses may have been endorsed, hence the percentage does not sum to 100.
Each DTV content category (eg, voices making direct threats, saying that other people will harm them, direct criticisms etc.) was endorsed by at least 40% of participants. Voices criticized more often than spoke of threats. Passive listening was more common than believing and active listening. Half of participants endorsed believing DTVs most or all of the time and over half passively listened to them most or all of the time. Actively listening was endorsed less (table 2). Of part-B participants, 221 (78.92%) screened positive for depression, and 189 (67.50%) for GAD.
Listening To and Believing DTVs: Descriptive Statistics
| Subscale Mean (SD) (N = 576) | Illustrative Example (N = 576) | |||||
|---|---|---|---|---|---|---|
| Never n (%) | A Bit of the Time n (%) | Most of the Time n (%) | All the Time n (%) | |||
| Believing | 5.35 (3.60) | “I believe what the nasty voices say” | 94 (16) | 186 (32) | 173 (30) | 123 (21) |
| Passive listening | 7.24 (3.18) | “There’s nothing I can do but listen to what the nasty voices say” | 87 (15) | 156 (27) | 153 (27) | 179 (31) |
| Active listening | 4.04 (3.32) | “I listen out for the nasty voices” | 231 (40) | 161 (28) | 106 (18) | 78 (14) |
LB-A
The polychoric correlation matrix was assessed for multicollinearity (r ≥ 0.90). One item was subsequently removed. Bartlett’s test for Sphericity confirmed that correlations between items were sufficiently large for EFA (X2 = 14092, df = 990, P < .001). Sampling adequacy was “marvellous”25 (overall KMO = 0.93, all items KMO > 0.77).
A 4-factor solution explained 59% of the cumulative variance (active listening, comprising items related to purposefully tuning into DTVs; passive listening, comprising items related to listening to DTVs, but without the intention of doing so; believing DTV content; and disregarding DTVs, which comprises items linked to both disregarding voice content and tuning out the voices). Factor loadings following item removal are presented in supplementary materials.
A 4-factor CFA model was subsequently carried out on part-B. Model fit was reasonably good based on the CFI, TLI, and SRMR and acceptable based on the RMSEA, however weighted least squares estimation is known to inflate the RMSEA26 (robust χ2 = 293.83, df = 129, P < .001, CFI = 0.96, TLI = 0.95, RMSEA = 0.07, SRMR = 0.07). The internal consistencies of subscales were good (α = 0.79–0.88). The factor loadings and correlations between factors are in supplementary tables.
A bifactor model with 3 factors and a general factor was carried out to assess the appropriateness of calculating a total score. Model fit was excellent (robust χ2 = 57.68, df = 42, P = .05, CFI = 1.00, TLI = 0.99, RMSEA = 0.04, SRMR = 0.04). Internal consistency of the total score was good (α = 0.87).
Test–retest reliability over 1 week was excellent (ICC = 0.81, n = 48).27 Active listening, passive listening, and believing each predicted anxiety, depression, and voice-related distress, confirming predictive validity (table 3). Each simple regression remained significant, with similar R2 values whilst controlling for both voice frequency and diagnosis (supplementary materials).
Simple Regressions between Listening To and Believing DTVs and Distress
| Depressiondf = 1278 | |||||
|---|---|---|---|---|---|
| β | β a | R 2 | F | P b | |
| Believing | 0.88 | 0.44 | 0.19 | 65.08 | <.001 |
| Active listening | 0.66 | 0.31 | 0.09 | 28.77 | <.001 |
| Passive listening | 1.10 | 0.51 | 0.26 | 97.49 | <.001 |
| Anxietydf = 1278 | |||||
| Believing | 0.80 | 0.47 | 0.22 | 77.02 | <.001 |
| Active listening | 0.74 | 0.40 | 0.16 | 53.26 | <.001 |
| Passive listening | 0.97 | 0.52 | 0.28 | 105.80 | <.001 |
| Voice-related distressdf = 1281 | |||||
| Believing | 0.06 | 0.21 | 0.04 | 12.83 | <.001 |
| Active listening | 0.05 | 0.14 | 0.02 | 5.42 | <.05 |
| Passive listening | 0.11 | 0.34 | 0.12 | 36.83 | <.001 |
aStandardized beta coefficient.
bCorrected for multiple comparisons using the Holm method.
Bold values indicate statistical significance.
LB-R
The polychoric correlation matrix for all the reasoning items was assessed for multicollinearity. No items met criteria (r ≥ 0.90). In order to reduce the item pool, active listening, passive listening, and believing were each regressed onto the 74 items from the reasons questionnaire using the regSEM lasso with lambda (λ)=5 and an iteration step of 0.03. The optimal BIC solution was observed with λ = 0.12. Twenty-one parameters had their paths regularized to <0.01 across all 3 dependent variables and were omitted from further analysis (supplementary materials).
Fifty-three items were taken forward to the EFA. Bartlett’s test for sphericity confirmed that correlations between items were sufficiently large for EFA (X2 = 8611.23, df = 1378, P < .001). The Kaiser–Meyer–Olkin test indicated that overall sampling adequacy was “marvellous”25 (overall KMO = 0.91, all items KMO > 0.69). A 7-factor solution explained 49% of the cumulative variance. The 7 factors were: to better understand the voices to deal with the threat (understand); being so worn down it is difficult to resist the voice experience (worn down); I’ll learn something insightful (learn); voices use strategies that capture attention (attention); the voices are just like real people (real people); I’m alone so have time and space to listen (alone); the voices are of people I know (I know). Factor loadings and correlations between factors are in supplementary materials.
A correlated 7-factor CFA model was performed on part-B, including adjustments (3 sets of correlated items) based on the modification indices. Fit indices were adequate on all indices (robust χ2 = 446.89, df = 326, P < .001, CFI = 0.96, TLI = 0.95, RMSEA = 0.04, SRMR = 0.05). Internal consistencies of the subscales were good to excellent (α = 0.71–0.88).
A 7-factor CFA model with a higher order factor was carried out in order to assess the appropriateness of calculating a total “reasons for listening to and believing” score. Model fit was adequate (robust χ2 = 500.84, df = 340, P < .001, CFI = 0.94, TLI = 0.93, RMSEA = 0.04, SRMR = 0.07). Internal consistency was excellent (α = 0.91). One-week test–retest reliability for the total score was excellent (ICC = 0.90, n = 48). Each of the 7 factors predicted the degree of active listening, passive listening, or believing nasty voices (table 4); worn down, alone, and real people significantly predicted disregarding (supplementary materials).
Simple Regressions Between 7 Factors for the LB-R and 3 Factors for the LB-A
| Believing | Active Listening | Passive Listening | ||||||||||
|---|---|---|---|---|---|---|---|---|---|---|---|---|
| β | R 2 | F a | P b | β | R 2 | F a | P b | β | R 2 | F a | P b | |
| Understand | 0.33 | 0.20 | 69.17 | <.001 | 0.35 | 0.50 | 270.40 | <.001 | 0.49 | 0.41 | 192.40 | <.001 |
| Worn down | 0.56 | 0.64 | 482.70 | <.001 | 0.24 | 0.26 | 97.04 | <.001 | 0.68 | 0.84 | 1385.00 | <.001 |
| Learn | 0.25 | 0.12 | 37.04 | <.001 | 0.31 | 0.39 | 173.10 | <.001 | 0.23 | 0.09 | 25.85 | <.001 |
| Attention | 0.46 | 0.22 | 78.54 | <.001 | 0.47 | 0.51 | 285.30 | <.001 | 0.59 | 0.33 | 132.70 | <.001 |
| Real people | 0.47 | 0.37 | 157.80 | <.001 | 0.22 | 0.18 | 58.14 | <.001 | 0.60 | 0.52 | 294.30 | <.001 |
| Alone | 0.31 | 0.23 | 79.55 | <.001 | 0.20 | 0.20 | 68.95 | <.001 | 0.45 | 0.42 | 195.30 | <.001 |
| I know | 0.07 | 0.01 | 3.73 | .11 | 0.14 | 0.11 | 35.17 | <.001 | 0.06 | 0.01 | 2.12 | .15 |
aDegrees of freedom for all F statistics = 1274.
b P values adjusted using the Holm method.
Factor scores were used for all regressions, hence β values can be compared across regressions.
Understand = to better understand the voices to deal with the threat, worn down = being so worn down it is difficult to resist the voice experience, Learn = I’ll learn something insightful, Attention = voices use strategies that capture attention, Real people = the voices are just like real people, Alone = I’m alone so have time and space to listen, I know = the voices are of people I know.
Bold values indicate statistical significance.
Regressing active listening, passive listening, and believing onto the 7 latent variables for the reasons questionnaire resulted in 8 negative coefficients which were previously positive in simple regressions. These were likely to be suppressor effects caused by shared variance with other predictors28 and hence were removed before using a backwards elimination approach to identify the remaining significant predictors of listening to and believing nasty voices.
The final 3-factor SEM regressing active listening, passive listening, and believing onto the remaining latent variables for the reasons questionnaire showed reasonably good fit indices (figure 1), (robust χ2 = 1152.73, df = 700, P < .001, CFI = 0.95, TLI = 0.95, RMSEA = 0.03, SRMR = 0.05). The model explained 70% of the variance in passive listening, 52% in believing, and 46% in active listening. The factor labeled “worn down”, which primarily comprises low self-confidence and mental defeat, was a particularly strong predictor of both passive listening to and believing DTVs. A separate SEM with disregarding as the dependent variable showed worn down to be the only significant predictor (supplementary materials).
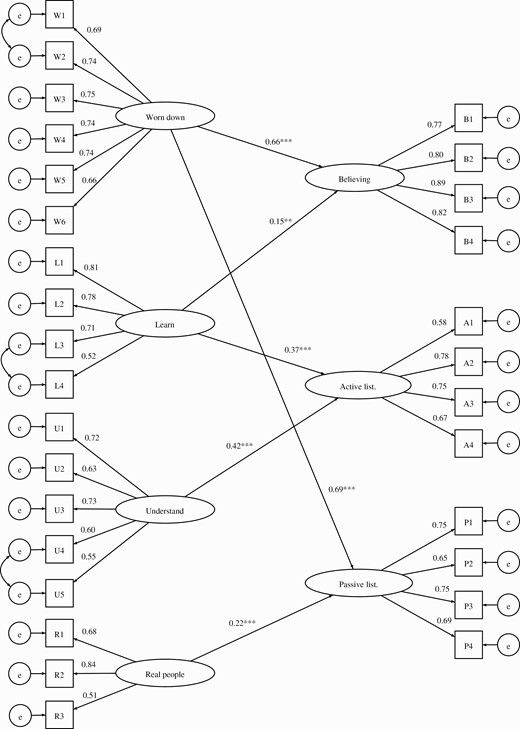
Final 3-factor SEM of the relationship, after backwards elimination, between listening to and believing nasty voices and the reasons. Standardized beta coefficients are reported alongside the following P value cut offs: P < .01**, P < .001***. The first item for each factor was fixed to 1. All factor loadings were significant at P < .001. Understand = to better understand the voices to deal with the threat, worn down = being so worn down it is difficult to resist the voice experience, Learn = I’ll learn something insightful, Real people = the voices are just like real people.
LB-R: 16-Item Short-Form Version
A regSEM lasso was estimated with λ = 2 and an iteration step of 0.03. The BIC was lowest with a λ = 0.03. Sixteen parameters had non-zero coefficients and were entered into CFA. The 16 parameters included 6 of 7 of the latent variables (“I hear the voice of someone I know” was excluded). Model fit was adequate (robust χ2 = 164.22, df = 98, P < .001, CFI = 0.95, TLI = 0.94, RMSEA = 0.05, SRMR = 0.05). The higher order factor for the 16-item version significantly predicted the higher order factor for the degree of listening to and believing nasty voices (unstandardized β = 0.89, standard error = 0.13, P < .001), was strongly associated with the full 28-item version (r(274) = 0.96, P < .001) explaining 93% of the variance. Internal consistency was excellent (α = 0.88).
LB-R: 5-Item Brief Measure
The highest beta coefficients across different factors from the regSEM in Section 3.4 (worn down, real people, attention, understand, and learn) formed a 5-item scale with α = 0.71, and a correlation of .90 with the total score from the full 28-item version (explaining 81% of the variance in the full version).
Discussion
We set out to broaden the understanding of the potential causes of distress in voice hearers. The focus was on one type of voice experience: hearing derogatory or threatening voices. It was hypothesized that listening to the negative content and believing it to be true would heighten emotional distress. It was also hypothesized that patients would have multiple motivations to listen to and believe the voices. It was found that listening to and believing DTVs is common: half of the participants endorsed a high degree of believing the threats and criticisms. Passive listening to voices (ie, without any sense of intent) most or all of the time was endorsed by 58% of participants, and was an even more common occurrence than active listening. Given that participants endorsed hearing a range of threats and criticisms from voices, it is consistent with our perspective that overall levels of depression and anxiety in the participant group were high. Within the group, higher levels of active listening, passive listening, and believing nasty voices were each significantly associated with higher levels of anxiety, depression, and voice-related distress, even when controlling for voice frequency. Passive listening explained approximately one quarter of the variance in depression and anxiety, and believing DTVs explained approximately a fifth of the variance. Psychological strategies which enable voice hearers to disengage from listening to and believing derogatory and threatening content could have the potential to provide an innovative route to reduce distress. This requires explicit testing.
Analysis of the data indicated that there were 7 different types of reasons for listening to and believing DTVs. These are now measurable via a 28-item assessment scale and shortened versions which correlate very highly with the longer version. The reasons (eg to better understand the voices to deal with the threat), are logical and reasonable responses to the very real experience of hearing a voice. The final SEM model indicated that the reasons accounted for the majority of variance in passive listening, and half of the variance in believing and active listening. Believing DTVs was strongly predicted by being worn down (comprising low self-confidence and mental defeat), and to a lesser extent the view that voices are a valuable source of information (“I might learn something insightful”). Passive listening was also strongly predicted by being worn down, and to a lesser degree by how real the voices sounded. The potential importance of feeling worn down builds on previous findings that low self-confidence is common for voice hearers,29 and that both low self-worth in comparison to voices30 (social rank) and feelings of entrapment31 (a construct closely related to mental defeat) are associated with depression in voice hearers. Cross-sectional data requires very cautious interpretation, but it is plausible that building self-confidence and overcoming mental defeat could be particularly helpful for voice hearers to begin to question the veracity of DTV content and to foster greater control over whether they choose to listen.
Believing and passive listening, but not active listening, were associated with feeling worn down. Active listening was associated with reasons relating to the positive consequences of engagement, which fell into 2 categories: an opportunity to better understand the voices in order to deal with the threat (eg “It might help me work out what they could do to me”), and an opportunity to learn something insightful (eg “Listening to the voice will help me to learn about myself”). Helping people alter the view that voices are a trustworthy source of information could help enable patients who hear DTVs to choose to direct their attention away from voices and towards meaningful activities and interests that can help improve mood.
The key limitation of the study is the cross-sectional design. The direction of the association between listening to and believing DTVs and negative affect cannot be determined. Given that defeat and low self-confidence are psychological experiences closely linked to the experience of low mood, it is probable that depression also leads to passive listening. A bidirectional relationship is most plausible. Causal interventionist tests are required to assess both directional pathways. It is notable that listening to and believing DTVs was more closely associated with the more distal measures of anxiety and depression than voice-related distress. However the relationship is likely affected by the use of a single-item question from the PSYRATS to assess voice-related distress. The size of association should therefore be interpreted cautiously. Lastly, the assessment of predictive validity was limited to negative affect. It is plausible that listening to DTVs can also lead to other negative reactions such as confusion, and greater conviction in delusional beliefs. These relationships remain to be assessed.
It is also notable that the majority of variance in distress remains unexplained. There are likely other contributors to the occurrence of negative affect in this group, including perceptions of the controllability over illness,32 loss of social roles such as employment, experiences of stigma33 and social isolation,34 elevated worry,29 and the impact of other psychotic experiences. Depression and anxiety disorders, which are known to be elevated in people with psychosis,32 may also be separate cooccurring clinical disorders. There is also room for improvement in explaining the reasons why patients believe and actively listen to DTVs. Around half of the variance in believing and active listening was unaccounted for by the reasons scale. When asked about unmeasured factors that could affect believing and active listening the LEAP proposed that believability could be influenced by the quality of evidence that voices use to back up their criticisms and threats. And that one might be more inclined to actively listen out for the voice’s perspective in a new environment, when the perceptual system is generally more alert to threat. These could be assessed in future research and integrated into the current theory. There could also be future research to examine potential contributors to the appraisals identified in this study. Traumatic experiences,35 sleep disruption,36,37 and low self-confidence7 would be potential contributors that are worthy of investigation. Cognitive functioning (eg verbal distractibility and inhibitory control) may also be important in determining whether or not voices are listened to.38 Notwithstanding the limitations of the current study, the framework of active listening, passive listening and believing DTVs is complementary to existing appraisal frameworks, and provides a new perspective on voice distress that will be possible to translate into psychological intervention.
Acknowledgments
We are grateful to all the participants who took part in this research, to the NIHR Clinical Research Network delivery teams, the local principal investigators across the NHS Trusts for facilitating recruitment, and the clinical teams who referred patients to the research. We thank Imogen Kilcoyne and Sapphira McBride for help with data entry and Rachel Batchelor for help setting up the online surveys. Lastly we thank Thomas Kabir, Rachel Temple and Anja Hollowell from the McPin Foundation for their facilitation of lived experience involvement. The authors have declared that there are no conflicts of interest in relation to the subject of this study.
Funding
B.S. is supported by an Higher Education England/National Institute for Health and Care Research clinical doctoral research fellowship (ICA-CDRF-2017-03-088), which funded the current study. DF is an NIHR Senior Investigator. L.J. is employed by Oxford Health NHS Foundation Trust. This publication presents independent research funded by Health Education England. The views expressed are those of the authors and not necessarily those of the NHS, HEE, the NIHR, or the Department of Health and Social Care. The funding sources had no role in the study design, collection, analysis or interpretation of the data, writing the manuscript, or the decision to submit the paper for publication.
References
Author notes
The group included P. Mirow and T. Oberai.
