


Abstract
The objective of this review was to systematically synthesize the results of original studies on the association between physical activity and social support in adolescents, published until April 2011. Searches were carried out in Adolec, Eric, Lilacs, Medline, SciELO, Scopus, SportsDiscus and Web of Science electronic databases and the reference lists of selected articles. Searches for articles, data extraction and assessment of methodological quality were conducted independently by two reviewers. In total, 75 articles met inclusion criteria and were analyzed. Most studies were published over the past 6 years (2006–11), conducted in high-income countries, with a cross-sectional design, using subjective measures of physical activity (e.g. questionnaires and recall) and exhibited medium to high methodological quality level. Social support was positive and consistently associated with the physical activity level of adolescents in cross-sectional and longitudinal studies. Those who received more overall social support as well as support from both parents, friends and family showed higher levels of physical activity. It is concluded that social support is an important factor associated with physical activity level in adolescents and should be targeted in intervention programs that aim to increase physical activity levels in this population group.
Introduction
Among the factors associated with physical activity, psychosocial factors such as self-efficacy, attitude and social support are the most widely analyzed and are those that can best explain the variations in physical activity levels in adolescents [1, 2]. Social support is a construct contained in a number of theories (Social Cognitive and Planned Behavior Theory) and models (Health Belief and Social Ecological Model) used to explain physical activity behavior [3]. It is described as an action that helps a person adopt and/or maintain a particular practice that can occur in different ways, such as instrumental/direct (characterized by acquisition or sports equipment sharing, facilitating transport to local practices and engaging in physical activities together), psychological/emotional (transmitted through incentives, words of motivation and encouragement for practices) and instructional/informative support (characterized by acts of orientation, counseling and talks about the importance and appropriate ways of engaging in physical activities) [4–7]. Parents, family members (brothers, uncles and grandparents), friends and teachers have been the most extensively investigated, because they are the main sources of support [4, 5, 7].
There are several systematic reviews on correlates of physical activity in adolescents [1, 2, 8–12], most of which identified social support as a factor positively associated with physical activity in adolescents [1, 2, 8, 9, 12]. However, these reviews clustered the results of the association from various measures and outcomes of physical activity (overall measure; physical activity by domain: leisure, commuting, structured and unstructured sports, among others) with overall scores of sources and types of social support. This procedure does not allow an assessment of how different measures of sources and types of social support are associated with a particular global and specific means of measuring physical activity as well as the simultaneous effect of providing different types of social support. Furthermore, they did not assess the extent to which the association between different types and sources of social support and engaging in physical activity varies as a function of sex, age and methodological quality of the studies.
Studies have shown that the relative importance of different sources and types of social support may vary with the characteristics of the physical activities performed [13, 14]. For example, social support provided by parents is usually in the form of sports equipment, transportation to sporting venues as well as reinforcement and encouragement to engage in leisure-time physical activities [15], whereas friends tend to provide more support by engaging in more vigorous physical activities and competitive sports [16]. There is also evidence that certain types of social support such as engaging in activities with the adolescent are more strongly associated with leisure-time physical activity [17], whereas other types such as encouragement have been important for active commuting [18]. It must also be taken into account that adolescents that perceive various types of social support are more likely to be more physically active, as they are commonly involved in a range of physical activities that require different types of social support [5].
Thus, the objective of this review was to systematically synthesize the results of studies on the association between physical activity and social support in adolescents, considering the different sources and types of social support, the domain and intensity of physical activity as well as its variations by sex and age and the quality of the studies analyzed.
Methods
Searches and study selection
The development of this review followed the guidelines suggested by PRISMA (Preferred Reporting Items for Systematic Reviews and Meta-Analyses) [19]. Original articles that analyzed the association between physical activity and social support in adolescents were reviewed. The electronic database, descriptors/terms and logical operators used in searches are described in Table I.
Electronic databases, descriptors/terms and operators used in searches of studies on physical activity and social support in adolescents
| Databases | Descriptors/termsa | Operatorsb |
|---|---|---|
| Physical activity: physical activity, motor activity, physical exertion, sports, exercise, leisure physical activities, leisure activities, physical exercise and physical inactivity. | And/Or |
| Social support: social support, determinant factors, associated factors and correlated factors. | ||
| Population group: children, adolescent, youth, teen, teenager, high school, students, young, schoolchildren and school children. |
aDescriptors in English/Portuguese; bCombinations descriptors and terms used.
The selection of descriptors was based on prior consultation with Medical Subject Headings (MeSH), Health Sciences Descriptors (DeCS), and specific terms that refer to ‘social support’, ‘physical activity’ and ‘adolescent’. Study selection, data extraction procedures and assessment of article quality were conducted independently by two reviewers (G.M. and L.A.C). In cases of discrepancy, a third reviewer (J.C.F.J.) was consulted and the question was resolved by consensus.
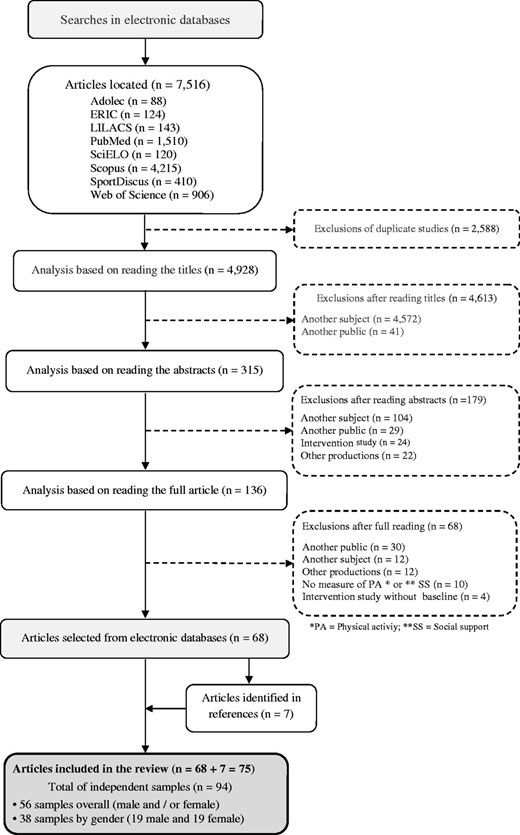
Study selection involved four stages, as described in Fig. 1. The first consisted of reading the article titles. In the second stage, the decision was based on information contained in the abstracts. When these did not contain enough information for decision making as to inclusion or exclusion, the article was kept for the ensuing stages. In the third stage, the articles were fully analyzed. Finally, reference lists of articles selected in the third stage were examined to identify potentially relevant studies that were not identified in the initial selection.
Stages adopted in the selection of articles.
Inclusion and exclusion criteria
The inclusion criteria established were: (i) original article published in Portuguese or English and indexed up to April 2011; (ii) studies with adolescents aged 10–19 years or average age in this range, or those including other ages, but presenting separate results for the age group under analysis; (iii) studies with cross-sectional and longitudinal design and intervention studies if presenting baseline results.
Exclusion criteria were studies that used high performance sport teams as a measure of physical activity, studies on special groups of adolescents (e.g. pregnant, postpartum period and obese), or those with chronic diseases (e.g. diabetes, hypertension and cardiovascular disease), instrument validation articles and qualitative research. Studies that did not present a summary measure of the association between physical activity and social support and those that used cardiorespiratory fitness as indicator of physical activity level were also excluded.
Definition of terms
Studies on any type of physical activity (structured and unstructured activities, games, plays, dances, recreational sports), irrespective of the domain (leisure, school, commuting, work and home) and method used to measure it (objective and subjective) were considered, as long as they included a summary measure of physical activity (e.g. minutes per month/week/day, frequency of practice, METs, kcal, score). In case of studies that used objective and subjective methods simultaneously to measure physical activity, the results of the former were considered [10].
Any type of social support provided by the following sources was considered: general social support (did not specify the source of social support or combination of different sources in a single measure), parents (father and mother), father only, mother only, friends (including peers and classmates), the family (social support provided by different family members such as parents, uncles, cousins and grandparents combined into a single measure), siblings, teachers, the school and social support characterized as ‘other’ (such as coaches, school environment and other adults).
Data extraction
Data extraction was performed using a previously tested standardized instrument. The following information was extracted: author, year of publication, country of origin of the sample, sample size and selection procedure, study design, characteristics of study participants (age and sex), main statistical analysis used, instruments to measure physical activity and social support, testing of these instruments, domains of physical activity, sources and types of social support measured and the main results of the association between physical activity and social support.
Due to the diversity of statistical techniques used in data analysis, it was decided to gather them into four groups: correlations, analysis of variance or covariance, regression models and structural equation modeling. Whenever possible, results of the multivariate rather than bivariate analysis were used. A total of 97.4% of the results derived from multivariable analyses. Studies that reported results separately for males and females were considered two independent samples, as adopted in other review studies on factors associated with physical activity [1, 11].
Evaluating study quality
A critical assessment of article quality was conducted, particularly in relation to methodological procedures. An instrument was developed based on several recomendations and checklists such as: Strengthening the Reporting of Observational Studies in Epidemiology (STROBE) [20], Downs and Black checklist [21] and Consolidated Standards of Reporting Trials (CONSORT) [22].
The instrument consisted of 12 items (e.g. adequately described variables, validity and accuracy instruments used to measure outcome, sample size, confounding variables and study limitations), each of which was attributed three response options: nonexistent = 0; partial = 1 and total = 2. A score was then calculated based on the sum total attributed to each item, which ranged from 0 to 24 points. These scores were classified into three levels: level A (high quality): studies that obtained ≥70% of total points (≥16.8 points); level B (medium quality): studies that obtained between 51% and 69% (12.1–16.7 points) and level C (low quality): studies with ≤50% (≤12.0 points). These criteria were adapted from the CONSORT [22]; the adaptation process was similar to that described in other review articles [23–25]. The protocol used for data extraction and assessment of study quality can be obtained by contacting the authors of this study.
Codification and summary of the associations
Due to the diversity of physical activity and social support measuring instruments as well as the statistical analysis used to summarize the results of the associations between physical activity and social support, procedures used by Sallis et al. [12] and van der Horst et al. [1] in their systematic reviews were adopted.
The studies that found statistically significant associations between physical activity and social support were allocated to the ‘related to physical activity’ column and the direction of the association was labeled with ‘+’ for positive association and ‘−’ for negative. Studies that did not find a significant association were allocated to the ‘not related to physical activity’ column and labeled with ‘0’.
The consistency of study results was determined as follows: when ≥60% of the samples in the ‘evidence’ column showed results in the same direction, they were classified as consistent with a positive (‘++’), negative (‘−−’) or nonexistent association (‘00’); between 33% and 59% as inconsistent, represented by ‘+?’, ‘−?’ or ‘0?’; and <33% as inconsistent with no association between physical activity and social support, depicted by a question mark (‘?’).
Evidence showed 50% of samples had association results in the same direction and 50% in another were also classified as inconsistent, illustrated by a double question mark (‘??’), indicating a lack of definition in the direction of evidence (‘+’, ‘−’, ‘0’). The code summaries of evidence were only computed for variables studied in at least three independent samples for each source of social support.
Results
Of the 7523 articles identified in all search strategies (7516 in databases and 7 in the reference lists of articles), 75 met inclusion criteria and were analyzed (Fig. 1). The articles selected were published between 1992 and 2011, mostly between 2006 and 2011 (70.7%) and conducted in North America (62.7%). Most samples consisted of adolescents of both sexes (76%) and 48% involved an age range between 10 and 19 years. Studies with a cross-sectional design were the most common (85.3%) as well as those with non-probabilistic samples (58.7%) and composed of 100–1000 adolescents (66.7%). Information on these studies is presented in Table II.
Characteristics of the studies that analyzed the association between physical activity and social support in adolescents aged 10–19 years
| Variables | n (%) |
|---|---|
| Publication year | |
| 1992–99 | 6 (8.0) |
| 2001–05 | 16 (21.3) |
| 2006–11 | 53 (70.7) |
| Origin of sample | |
| North America | 47 (62.7) |
| Europe | 13 (17.3) |
| Oceania | 7 (9.3) |
| Asia | 5 (6.7) |
| South America | 2 (2.7) |
| Oceania and Asiaa | 1 (1.3) |
| Frequency by countriesb | |
| USA | 42 (89.4) |
| Norway | 3 (23.1) |
| Australia | 6 (85.7) |
| China | 2 (40.0) |
| Brazil | 2 (100.0) |
| China and Australia | 1 (100.0) |
| Others | 19 (100.0) |
| Sex sample | |
| Male | 1 (1.3) |
| Female | 17 (22.7) |
| Male and Female | 57 (76.0) |
| Age groupc (years) | |
| 10–14 | 28 (37.3) |
| 15–19 | 2 (2.7) |
| 10–19 | 36 (48.0) |
| Sample size (no. of subjects) | |
| <100 | 7 (9.3) |
| 100–1000 | 50 (66.7) |
| 1001–5000 | 15 (20.0) |
| >5000 | 3 (4.0) |
| Sample type | |
| Probabilistic | 31 (41.3) |
| Non-probabilistic | 44 (58.7) |
| Study design | |
| Cross-sectional | 64 (85.3) |
| Intervention | 2 (2.7) |
| Longitudinal | 9 (12.0) |
aStudy performed with samples from two continents. bValues proportional to the sample origin Others (all the other countries). cNine articles reported only average age.
Measures of physical activity and social support
In most of the studies, physical activity was measured using a subjective method (77.3%), particularly the use of questionnaires (64%). Accelerometers and pedometers accounted for 17.3% of all measures of physical activity and only 5.3% of the studies combined objective and subjective measures. In 68% of the studies, the physical activity domains measured were not defined, 20% measured leisure-time physical activity and 12% combined leisure and commuting. Only four studies did not report the psychometric properties of the instruments (reliability and validity) or inform whether they had been previously tested.
A total of 11 different sources of social support for physical activity were identified (general social support, parents, father, mother, friends, family, siblings, teachers, other adults, school environment and coaches). In 74.7% of the studies, up to two sources of social support were measured, highlighting the social support provided by friends, evaluated in 64% of the studies. This was followed by social support from family (36%) and parents (35%). The sources of social support from other adults, the school environment and coaches were evaluated in only one study each, and were excluded from analysis. Seven studies did not report on psychometric properties (internal consistency, reliability and validity) or whether the instruments had been previously tested.
The most widely used statistical analyses to check the association between physical activity and social support were regression models (72%), followed by structural equation modeling (18.7%), analysis of variance or covariance (6.7%) and correlation (2.6%). Details about the measures of physical activity and social support are described in Table III.
Characteristics of the measures of physical activity and social support, and assessment quality of studies
| Author | Year | Countrya | PA domain | Type of instrument | Tested the PA instrument | Tested the SS instrument | No. of SS sources | Statistical analysis | Quality of study | |
|---|---|---|---|---|---|---|---|---|---|---|
| Point | Level | |||||||||
| Anderssen and Wold [26] | 1992 | NOR | Leisure | Questionnaire | Yes | NI | 4 | Regression modeling | 62.5 | B |
| Zakarian et al. [27] | 1994 | USA | Leisure | Questionnaire | Yes | Yes | 4 | Regression modeling | 70.8 | A |
| Biddle and Goudas [28] | 1996 | GBR | Overall | Questionnaire | Yes | NI | 2 | Structural equation | 50.0 | C |
| Bungum and Vincent [29] | 1997 | USA | Overall | Questionnaire | Yes | Yes | 2 | Regression modeling | 66.7 | B |
| Vilhjalmsson and Thorlindsson [30] | 1998 | ISL | Leisure | Questionnaire | Yes | NI | 5 | Regression modeling | 66.7 | B |
| Sallis et al. [31] | 1999 | USA | Overall | Questionnaire | Yes | Yes | 1 | Regression modelimg | 66.7 | B |
| Strauss et al. [32] | 2001 | USA | Leisure | Accelerometer | Yes | Yes | 1 | Regression modeling | 54.2 | B |
| Prochaska et al. [33] | 2002 | USA | Overall | Questionnaire and accelerometer | Yes | Yes | 2 | Regression modeling | 62.5 | B |
| Rhodes et al. [34] | 2002 | CAN | Leisure | Questionnaire | NI | Yes | 2 | Structural equation | 29.2 | C |
| Sallis et al. [13] | 2002 | USA | Overall | Questionnaire and accelerometer | Yes | Yes | 2 | Regression modeling | 66.7 | B |
| Wu and Pender [35] | 2002 | CHN | Overall | Recall | Yes | Yes | 2 | Structural equation | 66.7 | B |
| Higgins et al. [36] | 2003 | CAN | Overall | Questionnaire | NI | NI | 1 | Regression modeling | 45.8 | C |
| Neumark-Sztainer et al. [37] | 2003 | USA | Overall | Questionnaire | Yes | Yes | 1 | Regression modeling | 75.0 | A |
| Trost et al. [38] | 2003 | USA | Overall | Recall | Yes | Yes | 1 | Structural equation | 75.0 | A |
| Wu et al. [39] | 2003 | CHN | Overall | Recall | Yes | Yes | 2 | Structural equation | 54.2 | B |
| Davison [14] | 2004 | USA | Overall | Questionnaire | Yes | Yes | 5 | Variance/Covariance | 50.0 | C |
| Saunders et al. [40] | 2004 | USA | Overall and leisure | Questionnaire | Yes | Yes | 1 | Structural equation | 58.3 | B |
| Bourdeaudhuij et al. [41] | 2005 | BEL | Overall | Questionnaire | Yes | Yes | 3 | Regression modeling | 83.3 | A |
| Duncan [4] | 2005 | USA | Overall | Questionnaire and pedometer | Yes | Yes | 3 | Structural equation | 75.0 | A |
| Frenn et al. [42] | 2005 | USA | Overall | Recall | Yes | Yes | 1 | Regression modeling | 54.2 | B |
| Reis and Petroski [43] | 2005 | BRA | Overall | Questionnaire | Yes | Yes | 2 | Variance/Covariance | 33.3 | C |
| Voorhees et al. [16] | 2005 | USA | Overall | Questionnaire | Yes | Yes | 1 | Regression modeling | 62.5 | B |
| Beets et al. [5] | 2006 | USA | Overall | Questionnaire | Yes | Yes | 3 | Structural equation | 50.0 | C |
| Davison et al. [44] | 2006 | USA | Leisure | Questionnaire | Yes | Yes | 1 | Correlation | 41.7 | C |
| Davison and Schmalz [45] | 2006 | USA | Overall | Questionnaire | Yes | Yes | 4 | Regression modeling | 70.8 | A |
| Heitzler et al. [46] | 2006 | USA | Leisure | Questionnaire | Yes | Yes | 1 | Regression modeling | 83.3 | A |
| Ommundsen et al. [47] | 2006 | NOR | Leisure, school and commuting | Questionnaire | Yes | Yes | 3 | Regression modeling | 75.0 | A |
| Raudsepp [48] | 2006 | EST | Overall | Recall | Yes | Yes | 2 | Regression modeling | 54.2 | B |
| Springer et al. [49] | 2006 | USA | Leisure | Questionnaire | Yes | Yes | 2 | Regression modeling | 54.2 | B |
| Zhang and DeBate [50] | 2006 | USA | Leisure | Questionnaire | Yes | Yes | 1 | Regression modeling | 66.7 | B |
| Beets et al. [51] | 2007 | USA | Overall | Pedometer | Yes | Yes | 2 | Regression modeling | 70.8 | A |
| Beets et al. [52] | 2007 | USA | Overall | Questionnaire | Yes | Yes | 3 | Structural equation | 66.7 | B |
| Dowda et al. [53] | 2007 | USA | Overall | Recall | Yes | Yes | 1 | Regression modeling | 66.7 | B |
| Hohepa et al. [54] | 2007 | NZL | Leisure, school and commuting | Questionnaire | Yes | Yes | 4 | Regression modeling | 75.0 | A |
| Kuo et al. [55] | 2007 | USA | Overall | Questionnaire | Yes | Yes | 1 | Regression modeling | 50.0 | C |
| Lubans et al. [56] | 2007 | GBR | Overall | Questionnaire | Yes | Yes | 2 | Regression modeling | 58.3 | B |
| Motl et al. [57] | 2007 | USA | Overall | Questionnaire | Yes | Yes | 1 | Structural equation | 45.8 | C |
| Wilson and Dollman [58] | 2007 | AUS | Overall and Leisure | Recall | Yes | Yes | 4 | Regression modeling | 54.2 | B |
| Hamilton and White [59] | 2008 | AUS | Overall | Questionnaire | NI | Yes | 2 | Regression modeling | 70.8 | A |
| Jackson et al. [60] | 2008 | AUS | Overall | Accelerometer | Yes | Yes | 1 | Regression modeling | 83.3 | A |
| King et al. [61] | 2008 | USA | Leisure | Questionnaire | Yes | Yes | 2 | Variance/Covariance | 50.0 | C |
| Lown and Braunschweig [62] | 2008 | USA | Overall | Questionnaire | Yes | Yes | 2 | Regression modeling | 70.8 | A |
| Martin and McCaughtry [63] | 2008 | USA | Overall | Questionnaire | Yes | Yes | 3 | Regression modeling | 37.5 | C |
| Martin and McCaughtry [64] | 2008 | USA | Leisure | Questionnaire | Yes | Yes | 3 | Regression modeling | 50.0 | C |
| Martin et al. [65] | 2008 | USA | Leisure | Questionnaire | Yes | Yes | 1 | Regression modeling | 62.5 | B |
| McMinn et al. [66] | 2008 | DNK | Overall | Accelerometer | Yes | Yes | 2 | Regression modeling | 79.2 | A |
| Robbins et al. [67] | 2008 | USA | Overall | Questionnaire | Yes | Yes | 6 | Regression modeling | 75.0 | A |
| Sabiston and Crocker [68] | 2008 | CAN | Leisure | Questionnaire | Yes | Yes | 2 | Structural equation | 54.2 | B |
| Shields et al. [69] | 2008 | CAN | Overall | Questionnaire | Yes | Yes | 1 | Regression modeling | 58.3 | B |
| Davison and Jago [70] | 2009 | USA | Overall | Accelerometer | Yes | Yes | 2 | Regression modeling | 70.8 | A |
| Dishman [71] | 2009 | USA | Overall | Questionnaire | Yes | Yes | 1 | Structural equation | 62.5 | B |
| Há et al. [72] | 2009 | AUS/CHN | Leisure | Questionnaire | Yes | NI | 4 | Variance/Covariance | 45.8 | C |
| Kurc and Leatherdale [73] | 2009 | CAN | Overall | Questionnaire | Yes | NI | 1 | Regression modeling | 58.3 | B |
| Loucaides [74] | 2009 | CYP | Overall | Questionnaire | Yes | Yes | 2 | Correlation | 66.7 | B |
| Lubans and Morgan [75] | 2009 | AUS | Overall | Pedometer | Yes | Yes | 1 | Regression modeling | 62.5 | B |
| Maglione and Hayman [76] | 2009 | USA | Overall | Questionnaire | Yes | Yes | 1 | Regression modeling | 83.3 | A |
| Panter et al. [18] | 2009 | GBR | Commuting | Questionnaire | NI | Yes | 2 | Regression modeling | 66.7 | B |
| Wenthe et al. [77] | 2009 | USA | Overall | Questionnaire and accelerometer | Yes | Yes | 2 | Regression modeling | 54.2 | B |
| Wilson and Dollman [17] | 2009 | AUS | Overall and Leisure | Recall | Yes | Yes | 4 | Regression modeling | 33.3 | C |
| Barr-Anderson et al. [7] | 2010 | USA | Overall | Questionnaire | Yes | Yes | 1 | Regression modeling | 54.2 | B |
| Deforche et al. [78] | 2010 | BEL | Leisure and commuting | Questionnaire | Yes | Yes | 2 | Regression modeling | 66.7 | B |
| Dishman et al. [79] | 2010 | USA | Overall | Accelerometer | Yes | Yes | 2 | Structural equation | 58.3 | B |
| Fermino et al. [80] | 2010 | BRA | Overall | Questionnaire | Yes | Yes | 2 | Regression modeling | 91.7 | A |
| Kelly et al. [81] | 2010 | USA | Overall and Leisure | Accelerometer | Yes | Yes | 2 | Regression modeling | 79.2 | A |
| Kim and Cardinal [82] | 2010 | KOR | Overall | Questionnaire | Yes | Yes | 2 | Structural equation | 75.0 | A |
| Kitzman-Ulrich et al. [83] | 2010 | USA | Overall | Accelerometer | Yes | Yes | 1 | Regression modeling | 75.0 | A |
| Lee et al. [84] | 2010 | SGP | Overall | Recall | Yes | Yes | 1 | Regression modeling | 79.2 | A |
| Leslie et al. [85] | 2010 | AUS | Commuting | Questionnaire | Yes | Yes | 2 | Regression modeling | 58.3 | B |
| Patnode et al. [86] | 2010 | USA | Overall | Accelerometer | Yes | Yes | 2 | Regression modeling | 75.0 | A |
| Taymoori et al. [87] | 2010 | IRN | Overall | Questionnaire | Yes | Yes | 4 | Regression modeling | 79.2 | A |
| Bergh et al. [88] | 2011 | NOR | Overall | Accelerometer | Yes | Yes | 3 | Regression modeling | 83.3 | A |
| Bradley et al. [89] | 2011 | USA | Overall | Accelerometer | Yes | NI | 1 | Regression modeling | 70.8 | A |
| Hsu et al. [90] | 2011 | USA | Overall | Recall | Yes | Yes | 2 | Structural equation | 70.8 | A |
| Jago et al. [91] | 2011 | GBR | Overall | Accelerometer | Yes | Yes | 2 | Regression modeling | 45.8 | C |
| Martin et al. [92] | 2011 | USA | Leisure | Questionnaire | Yes | Yes | 1 | Regression modeling | 54.2 | B |
aAbbreviations according to the Brazilian Association of International Transport Companies (ABRETI) [93]; NI, not informed; PA, physical activity; SS, social support.
Evaluating study quality
In relation to study quality (Table III), 45.3% were classified as level B, followed by levels A (34.7%) and C (20%). The items referring to sample power (0.2 mean value) and representativeness (0.7 mean value) had the lowest mean values. Appropriate statistical tests and adequate description of the results were the items that obtained the highest average in assessment of study quality (1.8 and 1.7 mean values, respectively).
Evidence of the association between physical activity and social support
In general, social support was positive and consistently associated with the overall physical activity levels of adolescents (overall physical activity = sum of all physical activities investigated). The measure of general social support, and that of parents, father, friends and family showed consistent evidence of a positive association (‘++’) with overall physical activity levels (Table IV). The same behavior was observed when studies were stratified by methodological method (data not reported in the tables).
Synthesis of studies that evaluate the association between physical activity and social support in adolescents
| Related to physical activity | Not related to physical activity | Synthesis | Evidence | Percent of evidence for study qualitya | ||||||||||
|---|---|---|---|---|---|---|---|---|---|---|---|---|---|---|
| Source of SS | Positive association (‘+’) | Negative association (‘−’) | No. association (‘0’) | No. S | No. IS | + | − | 0 | n/N | % | Cod | A(≥70) | B(69–51) | C(≤50) |
| Overall | [32]; [37]F; [42]F; [50]; [57]F; [71]F | [76]; [36]; [42]M | 8 | 9 | 6 | 0 | 3 | 6/9 | 66.7 | ++ | 16.7 | 66.6 | 16.7 | |
| Parents | [4]; [28]; [26]M/F; [38]; [44]F; [46]; [47]; [54]; [56]M/F; [61]; [70]F; [73]F/M; [74]; [18]; [84]M/F; [89]M/F | [60]M | [68]; [33]; [39]M/F; [60]F; [63]; [64]; [65]; [66]; [86]M/F; [88] | 26 | 34 | 21 | 1 | 12 | 21/34 | 61.8 | ++ | 43.8 | 37.5 | 18.8 |
| Father | [5]; [26]M/F; [14]M/F; [45]; [48]; [51]M; [58]M; [67]; [72]; [17]F; [91]M | [30]; [51]F; [52]F; [87]F; [91]F | 14 | 18 | 13 | 0 | 5 | 13/18 | 72.2 | ++ | 23.1 | 30.8 | 46.2 | |
| Mother | [5]; [26]M/F; [14]M; [45]; [51]F; [58]M; [72]; [17]F | [30]; [14]F; [51]M; [48]; [52]F; [30]; [87]F; [91]M/F | 14 | 18 | 9 | 0 | 9 | 9/18 | 50.0 | ?? | − | − | − | |
| Friends | [4]; [5]; [68]; [26]M/F; [27]M/F; [30]; [34]; [13]M; [35]; [39]M/F; [14]M/F; [41]; [16]F; [45]; [47]; [49]F; [52]F; [54]; [56]M/F; [58]M; [72]; [62]F; [64]; [67]; [70]F; [72]; [74]; [75]F; [18]; [78]; [80]; [81]F; [82]; [85]M; [86]M; [88]; [92] | [59]; [29]F; [33]; [13]F; [43]M/F; [65]; [66]; [75]M; [77]M/F; [17]F; [79]F; [85]F; [86]F; [87]F; [90] | 48 | 59 | 42 | 0 | 17 | 42/59 | 71.2 | ++ | 35.1 | 48.6 | 16.2 | |
| Family | [7]; [27]M/F; [31]; [34]; [14]F; [40]F; [41]; [43]M; [49]F; [53]F; [55]F; [62]F; [69]; [77]M/F; [78]; [80]; [82]; [83]M; [90] | [35]; [85]F | [59]; [29]F; [13]M/F; [14]M; [43]F; [67]; [79]F; [81]F; [83]F; [85]M | 27 | 34 | 21 | 2 | 11 | 21/34 | 61.8 | ++ | 36.8 | 42.1 | 21.1 |
| Siblings | [4]; [14]M/F; [45]; [54] | [30]; [64]; [65]; [67]; [87]F; | 9 | 10 | 5 | 0 | 5 | 5/10 | 50.0 | ?? | − | − | − | |
| Teacher | [28]; [72]; [17]F | [27]M/F; [41]; [47]; [58]M; [67]; [88] | 9 | 10 | 3 | 0 | 7 | 7/10 | 70.0 | 00 | 83.3 | 16.7 | 0.0 | |
Reference citations in brackets; SS, social support; No.S, number of studies; No. IS, number of independent samples; n/N = proportion of independent samples by source of social support; Cod, code summary of association; M, male; F, female; aDistribution of the level of quality of the studies was shown as ++ and 00.
The results showed that there is no association (‘00’) between physical activity and social support from teachers. The evidence for an association between social support from the mother and siblings and higher overall physical activity was inconsistent, with no clear definition of the direction of the measures of association found (‘??’). In both cases, 50% of the results showed a positive association and 50% showed no significant association between physical activity and social support.
When analyses were stratified by physical activity domain and intensity, the results of independent samples showed variations for associations between social support and physical activity. For leisure-time physical activities, social support of parents, father, mother and friends was positively and consistently (++) associated with physical activity. For commuting physical activities, only social support from friends was positively and consistently (++) associated with higher levels. In analysis of physical activity intensity, fathers, mothers and friends were positive sources of social support consistently (++) associated to vigorous physical activity (data not reported in tables).
Eleven studies analyzed the association between different types of social support and physical activity in adolescents. Of these, 10 [5, 7, 14, 17, 49, 51, 60, 67, 82, 89] found a significant association between some type of social support from the instrumental/direct dimension (e.g. participation in activities with other people, transportation and invitation to participate) and eight [4, 5, 17, 49, 60, 67, 82, 89] with some type of psychological/emotional dimension (e.g. encouragement, watching, praise) and the level of physical activity in adolescents. No significant association was found between types of support related to the instructional/informative dimension (e.g. comments on the benefits of exercise and how to correctly perform them) and physical activity in adolescents (data not reported in tables).
When social support was provided by the parents, the most frequent types of support associated to physical activity in adolescents were: encouragement (6 of 11 articles) [5, 17, 49, 67, 82, 89], do activity with (4 of 11) [7, 17, 51, 60] and transportation (3 of 11) [7, 67, 89]. When social support was provided by friends, encouragement (3 of 11 articles) [5, 26, 30] and do activity with (2 of 11) [49, 82] were the types most frequently associated with physical activity in adolescents. Watching [4], praising [60] and helping [17] were also positively associated to physical activity in adolescents (data not reported in tables).
Of the nine studies [34, 44, 59, 69, 70–72, 89] with longitudinal design that assessed the relationship between the social support provided by family members (parents, father and mother) and friends and physical activity in adolescents, eight [34, 44, 69, 70–72, 89] observed that increasing and/or maintaining social support on the part of these sources is associated with increasing and/or maintaining physical activity in adolescents (data not reported in tables). However, due to the low number of studies (fewer than three independent samples for each source of social support), it was impossible to determine if the longitudinal associations between social support and physical activity varied according to the sex and age of the adolescent, or with the domain or intensity of physical activity (data not reported in tables).
Discussion
The main findings of this systematic review showed a consistent and positive association between the provision of overall social support by parents, father, friends and family and more involvement of adolescents in overall physical activity. Encouragement and do activity with were the most frequent types of social support associated to physical activity in adolescents. With respect to leisure physical activities, associations were positive and consistent for social support provided by parents, father, mother and friends.
The use of a reference guide to conduct this systematic review, the searches in different electronic databases, clear definition of ratings used to summarize the study results, independent assessments by two reviewers at all stages of the study (search for and selection of articles, quality assessment and data extraction) and evaluation of article quality contributed to the quality of this review.
Over 90% of the studies analyzed were published in the last decade, predominantly in the last 6 years (2006–11). The increasing number of investigations of the factors associated with physical activity in adolescents, including social support, can be explained by the need and importance that has been given to identifying and understanding the mechanisms by which these factors influence their participation in this type of activity [1, 8–11].
The use of non-probabilistic samples in 58.7% of studies and the fact that most were concentrated in North America and Europe, may limit generalizability of the results. Due to economic, environmental and sociocultural differences between countries with different levels of development, the results can not be directly applied to low and middle income countries. Moreover, the use of non-probabilistic samples makes the study more susceptible to selection bias, increasing the likelihood of producing estimates that do not really correspond to associations existing in the population of reference [94].
Quality assessment showed that 80% of the studies selected for this review were classified as medium to high quality. Nevertheless, indicators such as sample representativeness and statistical power exhibited very low average values, indicating the absence of these items in 52 and 84% of the studies, respectively. These factors may contribute to greater susceptibility to selection bias and the possibility of type II error.
In general, it was consistently observed that adolescents who received more social support had higher levels of overall physical activity, particularly when this support was provided by parents, father, friends and family, reinforcing the importance of these social groups in adolescent participation in physical activity. Close family members (e.g. father, mother and siblings) and friends are those that interact most with teenagers [15] and social groups may have the most influence on adolescents’ adopting health-related behaviors, including physical activity [26]. Parents can encourage their children to engage in physical activity through different means, such as providing sports equipment and transportation [4–7]. On the other hand, friends tend to provide greater social support through invitations and participation in physical activities [16].
Friends were the source of social support that showed the greatest consistency for an association between overall physical activity and social support. These associations were also observed for leisure-time and commuting physical activity, findings that highlight the importance of friends for physical activity in this social group. Studies have shown that established social norms among adolescents may be an important factor in promoting lifestyle changes, including physical activity [34, 95]. The reciprocal influences between physically active friends (to engage in physical activities together), the incentive and/or invitation for physical activity as well as the strengthening of friendships due to the higher frequency of being together in places that are favorable for sports (courts, fields, squares and gyms) and leisure, are factors that may be linked to greater social support from friends with respect to physical activity in adolescents.
An intriguing result identified in this review was the inconsistent association between social support provided by mothers and overall physical activity of adolescents. Some factors may explain this finding: in studies that identified a significant association between social support and mothers and physical activity in adolescents [5, 14, 17, 26, 51], it was found that specific types of social support, such as logistic support for enrolling into sporting events or physical activities, the purchase of sportswear, transportation to sporting venues and incentives were the most prevalent in assessing social support, whereas studies that did not identify significant associations most often resorted to an overall assessment score of social support (sum of various types of support).
However, after results were stratified according to the leisure domain, it was observed that, in addition to social support from parents, father and friends, the social support of mothers was also positively and consistently associated with leisure-time physical activity, demonstrating their importance in increasing the physical activity levels of adolescents in this domain. Results stratified by commuting domain demonstrated that only three sources of social support (parents, friends and family) showed a minimum number of studies (three or more independent samples by source of social support) that analyzed this relationship, and only social support provided by friends was positively and consistently associated to active commuting. This finding can be explained by the fact that the scales which are usually designed to measure social support for physical activity in adolescents are primarily directed to evaluating the influence of social support for leisure-time or overall physical activity [1, 8, 9, 11]. Their items do not contain questions aimed at measuring social support for commuting.
With respect to physical activity intensity, it was found that the father, mother and friends were the most important sources of social support for engaging in vigorous physical activity. The low number of studies precluded analysis of the association between different types of social support and varying intensities of physical activity and possible variations as a function of adolescent characteristics (sex and age). However, analysis of the only two studies [32, 50] that investigated separately the association between social support and moderate and vigorous physical intensity demonstrated that the general social support score (support from family and friends) was significantly associated to vigorous but not moderate physical activity. The greater consistency of the associations between social support and vigorous activities can be explained by the nature of these activities: they are generally structured activities that require greater support from fathers in taking their children to the venue, as well as more stimuli for adolescents to participate, are generally paid and need specific equipment and settings.
In relation to types of social support, due to the small number of studies (fewer than three independent samples per sources of social support), it was impossible to analyze the association between different types of social support, provided by various groups (parents, friends, relatives and others) and physical activity or if these associations vary with the sex and age of the adolescents, domains and intensity of physical activity or between days of the week and weekend. However, types of social support provided by parents and friends, as well as their association with a global measure of physical activity, were assessed. The social support of parents and friends in the form of encouragement and do activity with were the types of social support most frequently associated to physical activity in adolescents. Another type of social support provided by parents proved to be important for the participation of adolescents in physical activity was transporting their children to the location of the activity.
Variations in the associations between diferent types and sources of social support and physical activity can also be observed according to the adolescent’s age. Duncan et al. [4], observed that older adolescents had higher perceived social support provided by parents and siblings when it was transmitted by encouragement and talking about physical activity, whereas their younger counterparts were more sensitive to social support involving watching their activity. Wilson and Dollman [17] conducted a study to identify specific types of social support (giving direct assistance, do activity with and encouraging the activity) associated with different types of physical activity (assessment for MET, moderate to vigorous and only vigorous physical activities) according to the source that provided the social support (father, mother, friend or teacher). These results suggest that certain types of support may be more important than others, depending on the physical activity and the source of social support. This reinforces the need to expand studies analyzing different types and sources of social support for specific activities.
Given the heterogeneity of the methods and statistical analyses used in the studies, it was impossible to determine the effect size in order to measure the association between social support and physical activity in adolescents. However, in a study conducted with Canadian adolescents, Duncan et al. [4] found that the higher the number of different types of social support provided simultaneously by parents and friends, the more the likelihood of adolescents’ being physically active. This result demonstrates that the more social support adolescents receive, especially a combination of different sources and types, the higher the likelihood of their being more physically active, and maintaining their activity levels. This evidence has important practical implications, because, taking into account that adolescents are generally involved simultaneously in several physical activities, coinciding with the help received (amount and diversity of types and sources of social support), they more easily adopt and/or maintain a regular practice of physical activity [5].
The results demonstrate that <12% of the studies evaluated variations in the relationship between physical activity and social support over time. In general, studies with a longitudinal design [34, 44, 69, 70–72, 89] exhibit similar results to those of cross-sectional investigations, which consistently find that increasing and/or maintaing social support from parents and friends was associated to greater adolescent involvement in physical activity and/or maintaing their physical activity levels over time. The small number of studies precluded analyses by type of social support, variations in associations between the domains or physical activity intensity and the sex of adolescents. Moreover, a longitudinal study carried out by Davison and Jago [70] showed that in the early stages of adolescence the effect of social support on physical activity is directly related to the greater influence of parents, whereas the influence of friends on physical activity increases in the later stages. Intervention [37, 79] and longitudinal studies [71, 89] also showed that, in addition to becoming more physically active, adolescents who received more social support exhibited lower reductions in physical activity levels over time. Taken together, these findings demonstrate that social support is an important factor not only for involving adolescents in physical activities, but also for their continued practice. Thus, more studies are needed to evaluate the relationship between social support and physical activity over a wider age range.
In addition to having a direct influence on adolescents’ participation in physical activity, social support can also have an indirect influence by promoting an increase in perceived self-efficacy in adolescents. Social Cognitive Theory [96] suggests that strong social support networks increase an individual’s self-efficacy in overcoming barriers to being physically active. Studies have demonstrated that adolescents with high levels of social support also exhibited elevated perception of self-efficacy, and this, in turn, is related to higher levels of physical activity in this population group [2, 71]. Dishman et al. [71] showed that female adolescents with high social support generally experienced lower declines in physical activity levels when they also had high self-efficacy. However, when adolescents perceived reductions in social support over time, they decreased their physical activity, even when their self-efficacy was high.
In general, the association between social support and physical activity in adolescents was positive and consistent, indicating that it is an important construct for engaging in physical activity, and should be included in intervention programs in order to increase physical activity levels in this group. Thus, these programs should consider social support from parents and friends as an important strategy to promote physical activity in adolescents. Despite the absence of investigations on the dose–response relationship between social support and increased physical activity, a number of studies have demonstrated that the higher the social support provided by parents and friends (provided simultaneously by different sources and under different forms), the higher the levels of physical activity in adolescents.
Certain limitations should be considered when interpreting the results of this review. Some studies that analyzed the association between physical activity and social support and met inclusion criteria may not have been identified by the search methods. However, this was minimized by the assortment of databases and procedures used in the study searches. Furthermore, it is believed that inclusion of these studies would not significantly affect the results obtained. It is impossible to disregard the presence of publication bias, where studies that found no significant association were not published. Although it is very unlikely that this occurred, if it did, it is believed that this phenomenon did not affect the results obtained.
Another limitation is related to the need to summarize the results of different studies. Due to the variety of methods for measuring physical activity and social support as well as the different study designs and analysis strategies employed, it was necessary to use a semi-quantitative method to summarize the results, rather than a meta-analysis. Furthermore, arbitrary definitions were adopted to classify the consistency of the results of the associations between physical activity and social support. However, comparable methodologies were applied in other similar reviews [1, 11, 12].
As only cross-sectional studies were reviewed, causal relationships cannot be established between physical activity and social support. It is not possible to rule out the presence of reverse causality in the results found, that is, people who received more social support are those who were already active. However, the possibility that this relationship is bi-directional must also be considered, that is, that inactive people who receive social support also become more active or maintain their physical activity levels. Finally, the consistency of associations identified in the studies was analyzed, but not their magnitude, due to the variety of statistical procedures used.
With respect to the findings of this systematic review, it is important to underscore that even with hetereogeneous ways of measuring social support (differences in the number and types of social support measured), this construct was shown to be consistently associated to higher levels of physical activity in adolescents, indicating that it is a key factor for the participation of these individuals in physical activities.
Conclusions
In general, cross-sectional and longitudinal studies showed that social support provided by parents, father, mother, friends and relatives was positively and consistently related to higher physical activity levels in adolescents. The social support from these sources was consistently associated to physical activities performed in leisure settings as well as vigorous activities, mainly when social support came from parents and friends. Other important evidence obtained in this review was the characterization of social support from parents and friends when provided in the form of encouragement, do activity with and transport to the venue. Thus, intervention programs should develop strategies to increase social support from parents, father, mother and friends for physical activity in adolescents, prioritizing motivational measures, such as support through encouragement as well as instrumental actions, such as do activity with the adolescent and provision of transport to the venue, the types of social support most frequently associated to physical activity in adolescents.
Future investigations on physical activity and social support should: (i) invest in studies with representative samples of the adolescent population; (ii) be performed in low- and middle-income countries, such as Brazil; (iii) use previously tested instruments and suitable psychometric properties for measuring physical activity (more studies with objective measures of physical activity such as an accelerometer) and social support; (iv) analyze the effect of different types and sources of social support (simultaneous to the provision of different types and sources), considering physical activity domains (e.g. leisure-time, school, commuting), intensity (e.g. moderate versus vigorous) and organization of activities (e.g. sports, structured versus unstructured); (v) standardize social support measures for physical activity in adolescents (e.g. establish the minimum number of items and the main types of social support); (vi) develop and/or adapt social support scales in accordance with the physical activity domain under study. For example, a social support scale for leisure physical activity should be different from the social support instrument for active commuting; (vii) use a longitudinal design to evaluate the association between social support and physical activity and (viii) test interventions that use social support as a mediator of the effects of the intervention on the physical activity levels of adolescents.
Acknowledgements
We would like to thank Coordenação de Aperfeiçoamento de Pessoal de Nível Superior (CAPES), for study and research grants.
Authors’ contributions: G.M. participated in all stages of the study, including the conception and structuring of the study, search, selection, extraction, quality assessment, data analyses, literature review and writing of the manuscript. L.A.C. participated in the search, selection, extraction, quality assessment, data analysis and review of the study, E.N.M. participated in the conception, structuring and review of the study and J.C.F.J. participated in the conception and structuring of the study and critical review of the manuscript.
Conflict of interest statement
None declared.