


Abstract
To better characterize and understand the nature of a very conservative definition of ‘avoidable’ emergency department (ED) visits in the United States to provide policymakers insight into what interventions can target non-urgent ED visits.
We performed a retrospective analysis of a very conservative definition of ‘avoidable’ ED visits using data from the National Hospital Ambulatory Medical Care Survey from 2005 to 2011.
We examined a total of 115 081 records, representing 424 million ED visits made by patients aged 18–64 years who were seen in the ED and discharged home.
We defined ‘avoidable’ as ED visits that did not require any diagnostic or screening services, procedures or medications, and were discharged home.
In total, 3.3% (95% CI: 3.0–3.7) of all ED visits were ‘avoidable.’ The top five chief complaints included toothache, back pain, headache, other symptoms/problems related to psychosis and throat soreness. Alcohol abuse, dental disorders and depressive disorders were among the top three ICD-9 discharge diagnoses. Alcohol-related disorders and mood disorders accounted for 6.8% (95% CI: 5.7–8.0) of avoidable visits, and dental disorders accounted for 3.9% (95% CI: 3.0–4.8) of CCS-grouped discharge diagnoses.
A significant number of ‘avoidable’ ED visits were for mental health and dental conditions, which the ED is not fully equipped to treat. Our findings provide a better understanding of what policy initiatives could potentially reduce these ‘avoidable’ ED visits to address the gaps in our healthcare system, such as increased access to mental health and dental care.
Introduction
The rhetoric surrounding ‘avoidable’ emergency department (ED) visits in the United States has been contentious. Since the Deficit Reduction Act of 2005, states may impose mandatory cost-sharing for non-urgent ED visits for Medicaid patients. Most recently, Indiana set copayments for ‘non-emergency care’ delivered in the ED as part of its Medicaid expansion waiver in 2015. Health plans, too, have emphasized the importance of avoiding the ED to reduce costs. Estimates of ‘avoidable’ ED visits run as low as 4.8% [1] and as high as 90% [2], and come from various methodologies to determine what constitutes a necessary versus unnecessary ED visit. Defining what is ‘non-urgent’, ‘unnecessary’ or ‘inappropriate’, is perhaps the first problem, as these terms are often conflated due to the lack of a consensus for a standard definition of a non-urgent visit and the complex nature of its categorization [3–5].
Current literature use retrospective diagnoses [3, 5], hospital admissions [2], triage scores [3] and patient self-reported data [6], among others, to define ‘avoidable’. However, using chief complaints derived from diagnoses, which are determined post hoc, can be dangerous because visits that are eventually determined to be non-emergent after physician examination and diagnostic testing are virtually indistinguishable from emergent visits [7]. Additionally, triage scores, while correlated with the true severity of disease, are notoriously poor predictors [3, 8].
Because of these difficulties, creating broad policy initiatives to deter potentially avoidable visits could be risky. However, even advocates against restricting ED access for non-urgent visits admit that a sub-population of ED patients can be better treated elsewhere at lower costs. To address this issue, we sought to present a characterization of a very restrictive definition of ‘avoidable’ ED visits, creating a baseline for which many practitioners would agree potentially would not warrant an ED visit, and providing insight as to why these patients present to the ED and some direction for policymakers to better target interventions in the US.
Methods
Our retrospective analysis used the National Hospital Ambulatory Medical Care Survey (NHAMCS) for years 2005–2011. NHAMCS is a national sample survey conducted by the National Center for Health Statistics and represents 136 million visits in the US annually [9], providing information on ED visits to non-federal, general and acute care hospitals in the United States. We examined visits by patients aged 18–64 years, the population affected by the current and potential Medicaid cost-sharing increases, seen and discharged from the ED to characterize and determine the proportion of non-urgent visits, using our proposed definition of ‘avoidable’.
We conservatively defined ‘avoidable’ ED visits as discharged ED visits not requiring any diagnostic tests, procedures or medications. Diagnostic tests included imaging (x-rays, CT scans, MRI), blood tests (CBC, BUN/creatinine, electrolytes) or other tests (cardiac monitor, EKG/ECG, toxicology). Procedures included IV fluids, suturing/staples and nebulizer therapy. Medications included over-the-counter and prescription medications administered or prescribed.
We excluded patients admitted for observation, hospitalized, transferred, died in the ED or were dead on arrival. Because NHAMCS has been known to underreport diagnostic testing and procedures, we excluded visits where any stated reason was coded as diagnostic tests (3300–3399), other screening and preventive procedures (3400–3499), medications (4100–4199), preoperative and postoperative care (4200–4299), specific types of therapy (4400–4499) or specific therapeutic procedures (4500–4599). We also excluded visits where tests or procedures were blank/missing and those that did not receive care, including patients who left before triage, medical screening, or being seen, walked out, were not seen by a physician, left against medical advice, were not authorized to received treatment, were transferred to another facility, or saw another specialist. Overall, 115 081 records representing 424 million visits met our selection criteria.
We analyzed the primary International Classification of Disease, Ninth Revision (ICD-9) discharge diagnosis and the Healthcare Cost and Utilization Project's (HCUP) Clinical Classification Software (CCS) grouping of primary ICD-9 discharge diagnoses for ‘avoidable’ visits, as well as the rate of avoidable visits. The University of California, San Francisco deemed this study exempt from human subjects review.
Results
We found that 3.3% (95% CI: 3.0–3.7) of all ED visits met our definition of ‘avoidable’ (Fig. 1). The average age of patients was 36, with 52% female, 70% white, 25% black, 33% privately-insured, 28% uninsured, 22% Medicaid-insured and 8% Medicare-insured. And 14% of these visits arrived by ambulance. The top five chief complaints were toothache, back pain, headache, other symptoms/problems related to psychosis and throat soreness. The top three ICD-9 diagnoses of ‘avoidable’ visits included alcohol abuse, dental disorders and depressive disorders.
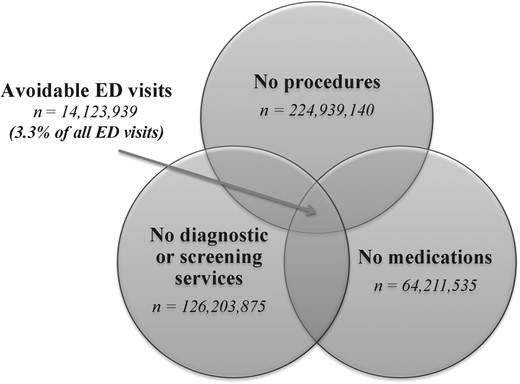
Study sample of avoidable ED visits 279 × 215 mm2 (300 × 300 DPI).
When examining the diagnoses using HCUP's CCS, we found that alcohol-related and mood disorders (depression and anxiety) accounted for 6.8% (95% CI: 5.7–8.0) of all ‘avoidable’ visits, and disorders of the teeth and jaw accounted for 3.9% (95% CI: 3.0–4.8) (Table 1).
Top 10 reasons for visit and discharge diagnoses for avoidable emergency department visits
| Rank | Number of observations | Weighted population count | % Of total avoidable ED visits {weighted} (95% CI) | % Of diagnosis considered avoidable {weighted} (95% CI) | |
|---|---|---|---|---|---|
| Reason for visit | |||||
| Toothache | 1 | 108 | 432 741 | 3.1 (2.3–3.8) | 5.2 (3.9–6.4) |
| Back pain, ache, soreness, discomfort | 2 | 103 | 396 712 | 2.8 (2.1–3.5) | 2.4 (1.8–3.0) |
| Headache, pain in head | 3 | 98 | 384 081 | 2.7 (2.1–3.4) | 2.4 (1.7–3.1) |
| Other symptoms/problems related to psychosis | 4 | 116 | 353 534 | 2.5 (1.8–3.2) | 17.3 (12.7–21.9) |
| Throat soreness | 5 | 90 | 332 736 | 2.4 (1.8–3.0) | 4.0 (2.9–5.2) |
| Skin rash | 6 | 77 | 286 802 | 2.0 (1.4–2.6) | 5.8 (3.9–7.7) |
| Abdominal pain, cramps, spasms (not otherwise specified) | 7 | 81 | 261 816 | 1.9 (1.3–2.4) | 1.0 (0.7–1.4) |
| Injury, multiple or unspecified | 8 | 61 | 258 071 | 1.8 (1.0–2.7) | 12.7 (7.2–18.3) |
| Earache, pain | 9 | 72 | 256 575 | 1.8 (1.3–2.4) | 5.2 (3.6–6.8) |
| Anxiety and nervousness | 10 | 83 | 247 119 | 1.8 (1.3–2.2) | 10.2 (7.3–13.2) |
| Discharge diagnosis (ICD-9) | |||||
| Alcohol abuse (unspecified) | 1 | 118 | 429 199 | 3.0 (2.1–4.0) | 11.3 (8.1–14.5) |
| Dental disorder | 2 | 84 | 338 086 | 2.4 (1.7–3.1) | 6.1 (4.5–7.8) |
| Depressive disorder (not elsewhere classified) | 3 | 96 | 282 919 | 2.0 (1.4–2.6) | 19.0 (14.2–23.8) |
| Acute upper respiratory infections of unspecified site | 4 | 72 | 231 750 | 1.6 (1.0–2.3) | 4.6 (2.8–6.4) |
| Acute pharyngitis | 5 | 51 | 218 865 | 1.6 (1.0–2.1) | 3.8 (2.5–5.1) |
| Hypertension (unspecified) | 6 | 39 | 190 781 | 1.4 (0.8–1.9) | 6.9 (4.2–9.5) |
| Open wound of unspecified site | 7 | 42 | 186 455 | 1.3 (0.6–2.0) | 8.6 (4.6–12.7) |
| Anxiety state (unspecified) | 8 | 64 | 184 873 | 1.3 (0.9–1.7) | 6.1 (4.3–8.0) |
| Pain in limb | 9 | 58 | 182 993 | 1.3 (0.9–1.7) | 4.5 (2.9–6.1) |
| Abdominal pain (unspecified site) | 10 | 46 | 170 222 | 1.2 (0.8–1.6) | 1.0 (0.6–1.3) |
| Discharge diagnosis (CCS; single level) | |||||
| Superficial injury; contusion | 1 | 246 | 983 744 | 7.0 (6.0–7.9) | 4.1 (3.4–4.8) |
| Sprains and strains | 2 | 167 | 668 036 | 4.7 (3.8–5.6) | 2.3 (1.7–2.8) |
| Other upper respiratory infections | 3 | 155 | 555 492 | 3.9 (3.1–4.8) | 3.4 (2.5–4.2) |
| Disorders of teeth and jaw | 4 | 142 | 553 162 | 3.9 (3.0–4.8) | 4.9 (3.9–6.0) |
| Alcohol-related disorders | 5 | 148 | 507 956 | 3.6 (2.5–4.7) | 10.4 (7.7–13.1) |
| Spondylosis; intervertebral disc disorders; other back problems | 6 | 131 | 458 453 | 3.3 (2.6–3.9) | 2.5 (1.9–3.1) |
| Mood disorders | 7 | 185 | 457 172 | 3.2 (2.6–3.9) | 16.9 (13.5–20.2) |
| Other injuries and conditions due to external causes | 8 | 124 | 438 827 | 3.1 (2.4–3.8) | 4.8 (3.7–5.8) |
| Skin and subcutaneous tissue infections | 9 | 96 | 386 340 | 2.7 (2.0–3.4) | 2.8 (2.1–3.5) |
| Other connective tissue disease | 10 | 112 | 385 472 | 2.7 (2.1–3.3) | 4.0 (3.0–5.0) |
While the main analyses examined the proportion of total ED visits that would be ‘avoidable’ by diagnosis grouping, we also determined the percentages of each diagnosis grouping that met our definition of ‘avoidable’. We found that 10.4% (95% CI: 7.7–13.1) of visits diagnosed with alcohol-related disorders, 16.9% (95% CI: 13.5–20.2) of mood disorders and 4.9% (95% CI: 3.9–6.0) of disorders of the teeth and jaw met our criteria of ‘avoidable’.
Discussion
Our analysis using a very restrictive definition of ‘avoidable’ showed that 3.3% of all ED visits in the US did not require any diagnostic testing, procedures or medications. The 6.8% of these visits were for alcohol-related and mood disorders and 3.9% for disorders related to the teeth and jaw. We also found that alcohol-related and mood disorders and disorders of the teeth and jaw had the highest percentages of ‘avoidable’ visits. At the same time, the vast majority of visits with alcohol-related and mood disorders and disorders of the teeth and jaw were not deemed ‘avoidable’, and therefore, it would be an incorrect assumption that all patients with these conditions should be not seen in the ED.
While previous studies have examined the appropriateness of ED use [2, 3], accurate classification of non-urgent visits has remained a challenge. One study using triage scores estimated 10.1% of visits to be ‘non-urgent’ [3], higher than our estimate of 3.3%. Ours is a more conservative estimate, using a purposefully more restrictive definition of ‘avoidable’ by excluding visits that involved the use of diagnostic tests, procedures and medications. International studies evaluating non-urgent ED visits [10–13] found that a large proportion of visits (ranging from 10 to 70%) could be more suitably treated in primary care settings. These studies all defined ‘non-urgent’ differently, which highlight the importance of having a very conservative baseline definition to isolate a small cohort of ‘avoidable’ visits that is likely more acceptable than using triage scores, self-report, physician reports or discharge diagnoses. By using a very restrictive definition and finding what could be just a proportion of truly avoidable ED visits, potentially policy interventions could be initiated on a small group of patients for which less harm is possible, given that they required no imaging, diagnostics, procedures or medications.
Our most striking finding is that a significant number of avoidable visits are for conditions the ED is not equipped to treat. Emergency physicians are trained to treat life- and limb-threatening emergencies, making it inefficient for patients with mental health, substance abuse, or dental disorders to be treated in this setting. One potential mechanism to more appropriately direct limited healthcare resources could be to increase access to mental health and dental care, which have traditionally been treated as separate categories of healthcare. For example, of the 46 states in the US that offer dental coverage for non-pregnant adult Medicaid enrollees, 28 provide coverage for preventive services and 18 provide emergency services only [14]. Although providing dental coverage is a step towards increasing access to dental care, less than half of dentists treat any Medicaid-insured patients [15]. Mental health and substance abuse patients similarly face difficulty in gaining access to healthcare due to insurance-imposed restrictions, and while the Mental Health Parity and Addiction Equity Act of 2008 has begun to address these disparities, not all avoidable ED visits are related to mental health, substance abuse or dental disorders, highlighting a need for greater access to care.
Our study has several limitations. First, because NHAMCS does not code some minor procedures, our definition conservatively overestimates the number of patients receiving no tests, procedures or medications. Second, NHAMCS data is based on survey responses from EDs in the sample, which can introduce potential for error. However, NHAMCS thoroughly investigates and reconciles any discrepancies. Finally, some literature shows underreporting of medications, which could apply to procedures or diagnostic testing. As NHAMCS statisticians have stated, reported excess are perhaps more accurate than underreports [12]. However, even if our findings are an overestimate, it lends even more credence that a very small proportion of patients could be identified as ‘avoidable’.
Our findings serve as a start to addressing gaps in the US healthcare system, rather than penalizing patients for lack of access, and may be a better step to decreasing ‘avoidable’ ED visits.
Acknowledgements
The authors thank Sarah Sabbagh, MPH, and Joanna Guo, BA for editorial and administrative assistance.
Funding
None.
