


Abstract
effective strategies are required to support the nutritional status of patients.
to evaluate a foodservice nutrition intervention on a range of participant outcomes and estimate its cost.
parallel controlled pilot study.
subacute hospital ward.
all consecutively admitted adult patients were eligible for recruitment under waiver of consent.
the intervention was a modified hospital menu developed by substituting standard items with higher energy options. The control was the standard menu. All participants received usual multidisciplinary care. Outcomes were change in weight and hand grip strength (HGS) between admission and day 14 and; energy and protein intake and patient satisfaction with the foodservice at day 14. The additional cost of the intervention was also estimated.
the median (interquartile range) age of participants (n = 122) was 83 (75–87) years and length of stay was 19 (11–32) days. One-third (38.5%) were malnourished at admission. There was no difference in mean (SD) HGS change (1.7 (5.1) versus 1.4 (5.8) kg, P = 0.798) or weight change (−0.55 (3.43) versus 0.26 (3.33) %, P = 0.338) between the intervention and control groups, respectively. The intervention group had significantly higher mean (SD) intake of energy (132 (38) versus 105 (34) kJ/kg/day, P = 0.003) and protein (1.4 (0.6) versus 1.1 (0.4) g protein/kg/day, P = 0.035). Both groups were satisfied with the foodservice. The additional cost was £4.15/participant/day.
in this pilot, the intervention improved intake and may be a useful strategy to address malnutrition. Further consideration of clinical and cost implications is required in a fully powered study.
Introduction
A therapeutic foodservice (catering system) working in parallel to the nutrition care pathway should facilitate optimal intake of patients, but often fails to do so leading to poor health outcomes and increased healthcare costs [1–3]. A number of strategies to increase the nutrient content of hospital menus have been trialled [4]. Importantly, results reported in these studies largely lack clinically meaningful outcomes such as anthropometry, function or cost. There is currently insufficient evidence supporting mid-meal snacks [5, 6] and hot breakfasts [7, 8]. Food fortification appears to successfully increase patients’ energy and protein intake compared with standard meals alone [8–13]. Incorporating high energy ingredients into meals is time and labour intensive and may be incompatible with modern foodservice systems where meals are produced offsite and/or pre-packaged. Novel, effective ways of providing patients with nourishing food are required.
The current study pilots a new menu higher in energy and protein and nourishing mid-meal service under usual foodservice and multidisciplinary care conditions in the subacute setting. The objectives were (i) to investigate its effect on nutrition-related and clinical outcomes, and patients’ satisfaction and (ii) to estimate the additional cost.
Materials and methods
Study design
This was a non-randomised non-blinded parallel controlled pilot study. The Institution Review Boards of Eastern Health and Monash University approved this study and waived the need for written informed consent from participants, in order for all eligible patients to be included. This study was registered on the Australian New Zealand Clinical Trials Registry (trial identification: ACTRN12613001076763) as a randomised controlled trial; however, true randomisation was determined not to be feasible in the clinical environment prior to study commencement.
Subjects and setting
This study was conducted in Australia, in a 32-bed Geriatric Evaluation and Management ward [14]. The foodservice system was bulk prepared cook-chill meals sourced from an external central production kitchen, heated and plated in a local kitchen. Patients’ completed a paper menu ahead of meal service for main meals (breakfast, lunch and dinner). Drinks and snacks at mid-meals (morning and afternoon tea, and supper) were offered by foodservice staff at the patient's bedside. Diet codes and dietitian prescribed items were managed through a computerised menu system.
All consecutively admitted patients were eligible. Exclusion criteria were as follows: having a documented weight loss goal; admitted for palliative care; having complex food requirements that could not be catered for by the intervention menu (e.g. allergen diets, smooth puree, minced and moist, texture modified fluids) or; receiving only enteral or parenteral nutrition. Participants were withdrawn if they became palliative or developed a need for a specialised diet. Sample size was based on a time delineated recruitment period of 4 months. All participants received standard multidisciplinary clinical care that included dietetics through the usual referral pathway.
Intervention
The intervention had the capacity to provide up to 3,680 kJ/day and 24 g protein/day more than the standard menu, dependant on patient selection (see Supplementary Table S1, available in Age and Ageing online), and it had more choice. Less energy dense items were removed (e.g. broth, tea, coffee, side salad and toast), enabling energy density to be increased by adding items at breakfast (e.g. pikelets and omelettes) and mid-meals (e.g. hot chocolate, muffins and cake). New items were pre-packaged rather than cooked on site, consistent with the foodservice system. The default menu was modified so that at lunch a hot meal instead of a sandwich was provided. The focus was on increasing energy density on the basis that maintaining energy balance would preserve fat and muscle mass. A visual menu was used at mid-meals to communicate all food and drink options available. Foodservice staff were asked to encourage patients to choose a food and drink item at mid-meals.
Control
The control group received the standard menu (see Supplementary Table S1, available in Age and Ageing online), including the following items available at mid-meals: tea, coffee, milo (malted milk drink), cheese (one portion) and biscuit (one portion), fruit cake and sweet biscuits. Usual mid-meal services were provided and did not utilise a visual menu or encourage patients to make a selection.
Group allocation
Rooms on half the ward were classified as intervention or control for the duration of the study. Room classification was preserved, therefore bed moves for clinical reasons (e.g. infection control) had the potential to result in group change. Participants were allocated to a group based on their room assignment, which was determined as per usual hospital protocol independent of this research. It was intended to cross over room classification halfway through recruitment (as detailed in the ACTRN12613001076763 register) but this did not occur due to logistical challenges. The intervention or control (usual care) were provided for the entire length of stay (LOS), unless group change occurred.
Outcome measures and data collection
Within 72 h of admission patients were assessed for eligibility by the researcher (J.C.) and enroled participants’ demographic information and baseline measurements were obtained. Outcome data for weight, hand grip strength (HGS), energy and protein intake were collected within ± one day of defined times. All data, with the exception of weight and Functional Independence Measure (FIM), were collected by a single, trained research dietitian (J.C.) who was not blinded due to the type of intervention and nature of group allocation.
Change in weight and HGS between admission and day 14 were included as objective indicators of nutritional status. Weight (kg) was measured using calibrated seated scales or self-reported or obtained from medical notes at baseline if unable to be measured. HGS was measured with a Jamar® Plus + Hand Dynamometer (Sammons Preston Rolyan, Bolingbrook, IL, USA) on the dominant hand [15], with the mean (kg) of three attempts recorded. Actual HGS results were compared with reference values [16, 17] to calculate percentage (%) of predicted HGS, where 100% of predicted HGS was equivalent to the average normal HGS for the reference group.
Daily energy (kJ) and protein (g) intake at day 14 (including oral nutritional supplements, ONS) were estimated from plate waste data using Foodworks1 Version: 7.0 (Xyris Software, Australia). Standard serve sizes and nutrient content of most food and drink items were known as they were packaged or sourced from the central production kitchen [18]. For fresh items (e.g. vegetables and fruit) and miscellaneous items (e.g. cream and sauces) nutrient information was sourced from AUSNUT database (2007) using recommended serve sizes [19]. Previous internal audits confirmed the actual weight of meals portioned by foodservice staff were within ±10% of recommendations [19]. All meals and mid-meals (including ONS and other items prescribed by the dietitian) on 1 day were observed and plate waste was visually estimated for each item using a validated six-point scale [20].
Patient satisfaction with the foodservice was evaluated at day 14 using a verbally administered validated questionnaire [21]. Scores were derived for four domains (food quality, meal service, staffing and service, physical environment), with scores closer to 1.0 indicating higher levels of satisfaction.
The validated FIM tool [22] was completed by trained nursing staff at admission and discharge and change in FIM score was calculated. Higher levels of independence with activities of daily living are indicated by higher FIM scores. LOS (days) and discharge destination (acute hospital, home, aged care facility, or other) were determined from participants’ medical records at discharge. A worse outcome was considered to be a discharge destination that provided a higher level of care in comparison to preadmission residence.
Assessing the cost of implementing the intervention menu accounted for: new equipment; additional foodservice staff labour (hours/day @ £11.11 [23] + 22% on-costs) and; food and drink costs (difference in cost/person/day between a default intervention and standard menu, see Supplementary Table S1, available in Age and Ageing online). Labour costs including the additional time foodservice staff spent preparing, plating and delivering the intervention menu (including encouraging intake and using the visual menu at mid-meals). ONS were not captured in cost analyses. All costs were determined in April 2014 and converted to pounds using a currency converter (www.oanda.com/currency/converter/).
Participant characteristics (age, gender, impaired cognition, diagnosis and diet code) were obtained from medical histories. Cognitive status was abstracted from documentation by medical staff. On admission, the trained researcher (J.C.) completed the Malnutrition Screening Tool (MST) [24] and the Subjective Global Assessment (SGA) [25] for participants at risk of malnutrition (MST score ≥2).
Statistical analysis
Statistical analyses were completed using IBM SPSS (Version 20, Chicago, IL, USA). P < 0.05 was considered statistically significant. Data were utilised up until the time of group change or withdrawal for participants in these circumstances. Median and interquartile range (IQR) were reported for non-parametric data and Mann–Whitney U test was used for between-group comparisons. Mean and standard deviation (SD) were reported for normally distributed data and analysed with independent t-test. Chi2 test was used to compare proportions between groups for categorical variables. Linear regression modelling determined if group (intervention or control) predicted change in FIM score and LOS. The model for change in FIM score controlled for age, LOS, FIM score at admission and impaired cognition and the model for LOS controlled for age, FIM score at admission, change in FIM score and impaired cognition.
Results
Between December 2013 and March 2014, 124 eligible patients were recruited (n = 62 intervention group, n = 62 control group), with a final sample of 122 (see Supplementary Figure S1, available in Age and Ageing online). Data were not available at day 14 for 51 participants (41.1%). Characteristics of all participants at admission and those remaining at day 14 are reported and compared in Table 1 and Supplementary Table S2, available in Age and Ageing online, respectively. There were no differences between the characteristics of participants who did not provide data at day 14 and those remaining, with the exception of age (median (IQR) age, n = 51, 79 (68–85) years versus n = 71, 84 (79–88) years, P = 0.005).
Comparison of demographic characteristics and outcome data at admission between intervention and control participants (n = 122).
| Characteristic | Control, n = 61 | Intervention, n = 61 | P value |
|---|---|---|---|
| Age (years), median (IQR) | 80 (75–87) | 84 (75–88) | 0.255 |
| Male, n (%) | 32 (52.5) | 29 (47.5) | 0.587 |
| Cognitive impairment, n (%) | 27 (44.3) | 29 (47.5) | 0.716 |
| Birthplace, n (%) | |||
| Australia | 37 (60.7) | 36 (59.0) | 0.853 |
| Other | 24 (39.3) | 25 (41.0) | |
| Language, n (%) | |||
| English | 54 (88.5) | 57 (93.4) | 0.343 |
| Other | 7 (11.5) | 4 (6.6) | |
| Primary diagnosis, n (%) | |||
| Stroke/neurology | 2 (3.3) | 1 (1.6) | – |
| Orthopaedic | 20 (32.8) | 18 (29.5) | |
| Functional/cognitive decline | 10 (16.4) | 17 (27.8) | |
| Oncology | 0 | 2 (3.3) | |
| Amputation | 2 (3.3) | 0 | |
| Respiratory | 7 (11.5) | 5 (8.2) | |
| Cardiology | 4 (6.6) | 3 (4.9) | |
| GI/Hepatic | 7 (11.5) | 6 (9.8) | |
| Other | 9 (14.8) | 9 (14.8) | |
| Diet code, n (%) | |||
| Full ward diet | 33 (54.1) | 43 (70.5) | – |
| Soft | 6 (9.8) | 5 (8.2) | |
| Diabetic | 21 (34.4) | 13 (21.3) | |
| Vegetarian | 1 (1.6) | 0 (0.0) | |
| Nutritional status at admission, n (%) | |||
| Well nourished | 37 (60.7) | 38 (62.3) | 0.448 |
| Mild/moderate malnutrition | 16 (26.2) | 19 (31.1) | |
| Severe malnutrition | 8 (13.1) | 4 (6.6) | |
| FIM score at admission, mean (SD) | 74 (20) | 72 (18) | 0.484 |
| HGS (kg) at admission, mean (SD) | 38.7 (17.2) | 36.9 (16.2) | 0.572 |
| Weight (kg) at admission, median (IQR) | 67.70 (55.70–77.60) | 59.80 (49.90–69.65) | 0.032 |
Well nourished, SGA = A, MST < 2; mild/moderate malnutrition, SGA = B; severe malnutrition, SGA = C.
Between groups, there was no difference in change in HGS or weight from admission to day 14 (Table 2). Total daily energy and protein intake (inclusive of ONS) at day 14 of inpatient stay was significantly higher among those receiving the intervention when adjusted for weight to take into account this difference at baseline (Table 2). There was no difference in the proportion of participants consuming ONS (intervention n = 14, 45%; control n = 17, 44%, P = 0.895), but energy and protein intake from ONS were significantly higher in the control group (Table 2). Independent of ONS intake, total daily energy and protein intake adjusted for weight remained significantly higher in the intervention group compared with control (data not shown). Selection of higher energy menu items is described in the Supplementary data.
Comparison between groups of HGS and weight change and energy and protein intake of subacute patients.
| Control | Intervention | P value | |
|---|---|---|---|
| HGS change, mean (SD) | n = 38 | n = 30 | |
| kg | 1.4 (5.8) | 1.7 (5.1) | 0.798 |
| % predicted normal | 5 (21) | 9 (23) | 0.509 |
| Weight change (%), mean (SD) | n = 36 | n = 30 | |
| 0.26 (3.33) | −0.55 (3.43) | 0.338 | |
| Total energy intake, mean (SD) | n = 39 | n = 31 | |
| kJ/day | 7,217 (1,903) | 7,795 (1,978) | 0.218 |
| n = 37 | n = 30 | ||
| kJ/kg/day | 105 (34) | 132 (38) | 0.003 |
| Total protein intake, mean (SD) | n = 39 | n = 31 | |
| g/day | 76 (23) | 80 (27) | 0.598 |
| n = 37 | n = 30 | ||
| g/kg/day | 1.1 (0.4) | 1.4 (0.6) | 0.035 |
| Energy intake from mid-meals, median (IQR) | n = 33 | n = 29 | |
| kJ/day | 1,113 (660–1,976) | 1,320 (742–2,085) | 0.489 |
| n = 37 | n = 30 | ||
| kJ/kg/day | 15 (12–29) | 25 (14–36) | 0.163 |
| Protein intake from mid-meals, median (IQR) | n = 39 | n = 31 | |
| g/day | 9.7 (5.3–19.3) | 9.8 (5.0–15.0) | 0.507 |
| n = 37 | n = 30 | ||
| g/kg/day | 0.1 (0.1–0.3) | 0.2 (0.1–0.3) | 0.940 |
| Energy intake from ONS, median (IQR) | n = 17 | n = 14 | |
| kJ/day | 2,011 (1,864–2,080) | 1,341 (1,040–2,011) | 0.039 |
| kJ/kg/day | 91 (32) | 120 (37) | 0.001 |
| Protein intake from ONS, median (IQR) | n = 17 | n = 14 | |
| g/day | 19.9 (19.1–25.0) | 13.3 (11.9–19.9) | 0.012 |
| g/kg/day | 1.0 (0.4) | 1.3 (0.6) | 0.019 |
HGS and weight change between admission and day 14 of inpatient stay.Energy and protein intake adjusted for body weight at day 14 of inpatient stay.Total sample size at day 14 is 39 for control group and 31 for intervention group.
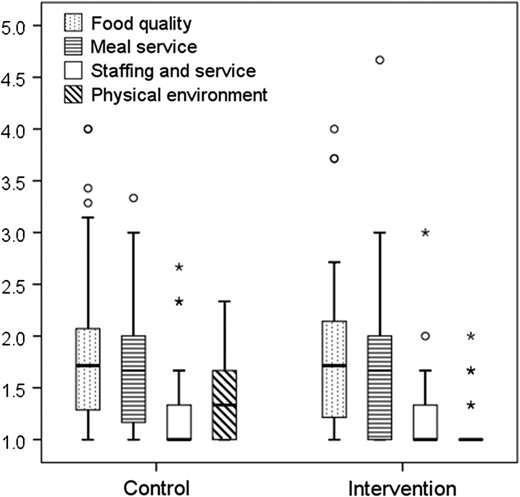
Comparison of satisfaction scores for foodservice domains between the intervention (n = 28) and control (n = 32) groups. Box plot displays median and IQR, circles represent outliers and stars represent extreme outliers.
LOS, change in FIM score when controlling for influencing factors (reported in methods) (see Supplementary Table S3, available in Age and Ageing online), and discharge destination was similar for the two groups (discharged to higher level of care intervention n = 23, 53.5%; control n = 20, 43.5%, P = 0.345). Analyses for LOS, discharge destination and change in FIM score included all participants, who had varying LOS (and consequently duration of intervention or control).
The ongoing additional cost of the intervention was estimated to be £4.15/participant/day, consisting of labour (1.25 hours/day for 16 participants costing £16.94/day) and food and drink costs (£3.09/participant/day cost difference between a default intervention and standard menu described in Supplementary Table S1, available in Age and Ageing online). New equipment were visual menus costing £12.90, incurred once.
Discussion
Evidenced-based innovations to support nutritional status in elderly subacute patients are needed [26]. This study describes an intervention designed to increase energy and protein intake by utilising the existing foodservice system, received for the entire LOS in addition to usual care. Overall, there was an increase in energy and protein intake (adjusted for weight) with no reduction in patient satisfaction with the foodservice, which provides positive preliminary data of the intervention's success. As a pilot study, there was insufficient power to detect an effect on the clinical outcomes measured, particularly due to the variable LOS of patients.
Higher energy and protein intake was achieved through food sources, independent of ONS. This was clinically meaningful in the context of evidence-based estimates of energy [27] and protein requirements [28] for the elderly, emphasising the role of hospital foodservice in providing therapeutic treatment for patients. The micronutrient content of either menu, or participants’ micronutrient intake was unable to be considered in this pilot. In contrast to ONS that are nutritionally complete, it is unlikely that the intervention menu will provide equivalent amounts calcium, folate, vitamin C, B12, iron and zinc which are particularly important for elderly populations [29].
While food-based interventions appear to have lower labour, product and total costs than ONS [5], in this study, the increase in time and cost of the intervention occurred in addition to ONS provided as part of usual dietetic care. Given the economic climate in which health services operate, this may be prohibitive to wider roll out or long-term implementation. If the intervention were adopted, there is the potential for cost reductions through labour efficiencies, alternate or bulk purchasing practices and menu forecasting associated with economies of scale.
The findings are generalisable to patients with a LOS of at least 14 days in subacute settings where foodservice and usual care practices are similar. A particular challenge was natural attrition occurring due to discharge, together with attrition due to withdrawal or group change. This affected the final sample size and the equivalence of age between groups at day 14. Representativeness was enhanced by a waiver of consent. Contamination risk existed because the intervention and control occurred simultaneously on one ward. This may result in an underestimation of the effect of the intervention if participants in the control group received items from the new menu. It was observed that the fidelity of the intervention was breached, with some participants in the intervention group receiving items that were not included in this menu (e.g. tea and coffee). We did not aim to control for the contamination that may have resulted from food brought into the Health Service as this is part of a patient's hospital experience.
Alternate study designs that would circumvent some of the bias associated with this study design were not feasible or were limited in other ways. While a blinded randomised controlled trial conveys the highest level of evidence, the logistical and ethical challenges of providing different menus to patients within one ward meant true randomisation was unrealistic. A case series (i.e. before and after) with non-concurrent controls conveys a lower level of evidence than a parallel study, and there was no other equivalent ward at the same site. The lack of blinding potentially introduced bias to outcomes’ assessment, particularly plate waste, and usual care provided by the dietitian. Environmental factors (i.e. proximity to nurses’ station, number and size of rooms) were not altered and were the same for both groups. It is unlikely that this influenced group characteristics and cannot help to explain the difference in satisfaction with the physical environment.
Further evaluation of this intervention or other foodservice strategies will assist in fully understanding their potential role in practice. This pilot study provides important learnings for consideration in future studies. Objective outcomes (e.g. weight, HGS and LOS) and cost analyses are important endpoints and should be included in studies that are ideally methodological of high quality and fully powered. Future studies will need to consider the variable LOS, particularly due to early discharge, and nutritional status of patients to adequately power large randomised control trials to identify effect on clinical outcomes. In this pilot, it was more feasible to measure HGS than weight in an elderly subacute population. In addition, HGS is not influenced by fluid shifts and therefore may be a more robust outcome measure. Outcome data need to be collected at a time point that allows sufficient time for detectable change to occur, yet minimises drop out. Interventions that continue beyond discharge may provide a longer duration for detectable and meaningful change in weight and HGS and are worthy of consideration.
In this pilot, a blanket change to the hospital menu was implemented as it is an efficient way of providing an intervention to a large number people. However, the overall effect may be diluted because it is received by a patient population that is heterogeneous with regard to age, clinical condition, cognition and nutritional status, all of which may influence intake and requirements. Additionally, the onus was on patients to select items from the menu. This occurred poorly for particular items (e.g. juice) and at supper time. Targeted or prescriptive provision of the intervention may have greater benefit.
Conclusion
This pilot study demonstrated that a modified hospital menu can improve the energy and protein intake of elderly patients in subacute care, but comes with additional cost. Further investigation of the clinical implications in a larger sample, using objective outcome measures, is required to assess effectiveness and to strengthen practice recommendations.
A hospital menu higher in energy and protein can increase food intake of elderly subacute patients.
Introducing an alternate menu did not affect patient satisfaction with foodservice.
This pilot was underpowered to detect a change in weight or hand grip strength after 14 days of intervention.
Increased cost and labour time incurred by foodservice may influence feasibility in practice.
Supplementary data
Supplementary data are available at Age and Ageing online.
Acknowledgements
We would like to acknowledge Anita Wilton (Associate Director Allied Health—Dietetics) and Graham Walker (Manager Support Services), the foodservice, nursing and allied health departments for supporting the development, implementation and evaluation of the intervention. We would also like to acknowledge Beth Van Lier, Gloria Leung and Andrea Soh for their assistance with the study as part of the Monash University vacation project program.
Statement of authorship
All authors contributed to the conception and design of this research. J.C. collected and analysed data and wrote the manuscript. K.H., J.P. and H.T. assisted with data analysis and interpretation provided supervision and reviewed the article. All authors approved the final version of the manuscript.
Conflict of interest statement
J.P. was an employee of the health service where this research was conducted. All other authors declare no conflict of interest.
Funding
J.C. is the recipient of an Australian Postgraduate Award (APA) scholarship. Funding for the project was provided by the Dietetics and Foodservice departments of Eastern Health. Funding for vacation project scholarships was provided by the Department of Nutrition and Dietetics, Monash University.

Comments