


Abstract
This study examined the longitudinal relationships between subjective age (SA) and future functional status in later life, via depressive symptoms. Additionally, we assessed the role of subjective nearness to death (SNtD) as a potential moderator within these pathways.
Older adults (average age 81.14 years at T1) were interviewed once a year for 3 consecutive years (N = 224 at T1, N = 178 at T2, and N = 164 at T3). Participants reported their SA, SNtD, depressive symptoms, and functional status. Additionally, grip strength was employed as an objective measure of functional status.
Data analysis revealed distinct pathways leading from T1 SA to T3 functional status through T2 depressive symptoms. Moreover, T1 SNtD was found to significantly moderate most of these indirect pathways, so that the mediation model of T1 SA–T2 depressive symptoms–T3 functional status was mostly significant among those who felt closer to death.
The findings contribute to our understanding of the underlying mechanism through which SA predicts long-term functioning sequelae by underscoring the indirect effect of depressive symptoms. They further indicate the importance of gauging the effects of SNtD on these longitudinal relationships. Present results may further contribute to establishing an integrative model for predicting long-term functional outcomes based on older adults’ earlier subjective views of aging.
Subjective age (SA), the extent to which people feel younger or older than their chronological age, could be used to learn about one’s present status or to foresee future deterioration (Alonso Debreczeni & Bailey, 2021; Kotter-Grühn et al., 2016). A growing body of research has shown SA’s superiority, relative to chronological age, in predicting various health developments of later years. These include cognitive functioning and impairment (Stephan et al., 2014, 2016), physical functioning (Ihira et al., 2015), self-rated health (Takatori et al., 2019), and even mortality (Rippon & Steptoe, 2015). This may be due to the ability of subjective views of aging to better reflect the rich array of personality and health-relevant behavioral styles whose ramifications may ultimately manifest in the increased heterogeneity noted as chronological age increases (Stone et al., 2017).
Various scholars have attempted to synthesize the growing body of research related to subjective views of aging into integrative models (Diehl et al., 2014). Noteworthy is the comprehensive theoretical framework presented by Westerhof and Wurm (2015). According to their heuristic model, an individual’s subjective aging (an umbrella term that includes SA) may determine the extent to which one may utilize psychological resources, ultimately affecting future age-related health outcomes. Germane to their model is the idea that different aspects of subjective aging may lead to distinct coping responses, ultimately affecting functional outcomes. Research is still needed to further substantiate and elucidate this model and its specific components.
An individual’s subjective nearness to death (SNtD) is an additional subjective measure through which aging-related processes may be evaluated. Though not a novel concept, its descriptive abilities have also gained prominence in recent years as a potential basis for evaluating developmental processes, particularly those related to later life (Kotter-Grühn, 2014). SNtD appears to be particularly sensitive to future fears and threats. A recent study found that individuals who felt closer to the end of their life reported higher levels of aging, dying, and death anxieties (Bergman et al., 2018).
Though both SA and SNtD present subjective views of aging, their varying temporal anchoring points may distinguish between them. SA, predominantly expressing the perceived distance from life’s beginning to one’s present time, may be particularly suitable in expressing perceived current coping. SNtD, on the other hand, utilizing future mortality as its point of reference, may be more suitable to reflect an individual’s perceived coping resources as related to future threats. Later life is unique in that it may combine both perspectives prominently, accrued life experience alongside the growing salience of decline or loss. Indeed, recent research supports evaluating these variables independently (Avidor et al., 2021; Benyamini & Burns, 2020; Deeg et al., 2021).
In order to further understand the interaction between these two measures empirically, Shrira et al. (2014) observed SA and subjective distance to death (which could be considered a related concept to SNtD) against the backdrop of levels of reported psychological distress within a single time frame in a sample of older adults (age range 50–86). They found that subjective distance to death significantly moderated the relationship between SA and psychological distress, such that distress was highest when an older SA was coupled with an enhanced perception of proximity to death. These results demonstrate that both SA and a variant of SNtD were related to psychological distress independently, and that each subjective measure may mitigate or enhance the impact of the other measure. Later, Hoffman et al. (2016) reported that a greater SNtD moderated the positive relationship between an older SA and posttraumatic stress symptoms within a predominantly younger adult sample (mean age = 36.97; SD = 13.62). These findings, again, seem to reflect the divergent nature of these measures in expressing perceived coping regarding the future threat.
Returning to the aforementioned model of Westerhof and Wurm (2015), one’s subjective aging is indeed expected to contain self-perceptions regarding coping with a future decline in health or function. Nevertheless, SNtD was not included within their selection of relevant subjective views of aging (a limitation explicitly noted by Diehl et al. (2014) when referring to their own proposed theoretical framework). This absence is noteworthy because this view may significantly alter or even nullify the effects of SA (Shrira et al., 2014).
The current paper sought to view longitudinal associations between SA and future functional status in later life. Regarding specific pathways through which subjective views of aging may contribute to future outcomes, it is reasonable to examine the role of depressive symptoms. Previous studies have found that one’s subjective views of aging may be associated with depressive symptoms (Choi & DiNitto, 2014; Keyes & Westerhof, 2012; Spuling et al., 2013). Furthermore, though feeling older was related to increased future depressive symptoms, the converse pathway from depressive symptoms to future SA disappeared once covariance was accounted for (Rippon & Steptoe, 2018; Spuling et al., 2013). We therefore observed the potential mediating role of depressive symptoms between SA and functional status within our longitudinal model.
Additionally, we were interested in further understanding the interactions between SA and SNtD, longitudinally. Assessing the interaction between the two views is consistent with recent conceptualizations of subjective views of aging as multidimensional (Kornadt et al., 2020), in addition to previously described findings that support viewing the two as being of divergent nature (Benyamini & Burns, 2020; Deeg et al., 2021). We therefore opted to view each measure independently: SA as the baseline measure for future depressive symptoms and SNtD as a potential moderator. SA was chosen as the independent variable following Westerhof and Wurm’s (2015) model and based on SA (or similar constructs) currently being the most substantiated empirically within the research of subjective views of aging (Alonso et al., 2021; Westerhof et al., 2014).
In the current study, consistent with the model of Westerhof and Wurm (2015), functional status served as the measure of outcome. Functional status, generally, pertains to two separate domains: functional limitation and disability. The former relates to difficulties in utilizing specific physical capacities; the latter to limitations affecting the ability to perform activities of importance to self-maintenance (Guralnik & Ferrucci, 2003; Shrira & Litwin, 2014). Though deterioration of functioning may not overtly present itself in earlier years, the increasing salience of such difficulties in later life may be viewed as reflecting broad and cumulative lifelong processes relating to physical and emotional well-being (Shrira & Litwin, 2014). In this vein, it is possible that the capacity of measures of subjective aging, such as SA and SNtD, to predict changes in functioning lies in their ability to capture insidious processes (e.g., depressive symptoms) which may ultimately become manifest in the decline of functioning. Indeed, previous research has indicated that subjective views of aging may reflect not only the extent of preoccupation with future risk, but also concurrent functional status (Rippon & Steptoe, 2015; Stephan et al., 2015; Westerhof et al., 2014). Furthermore, subjective views of aging have been found to predict functional health measures better than these health measures predict subjective views of aging (Sargent-Cox et al., 2012). It is for this reason that we have employed future functioning as an outcome measure rather than as an antecedent of future change, consistent with the main tenets of Westerhof and Wurm’s (2015) model. Nevertheless, as the model allows for feedback from health to SA, the potential converse pathway will be tested in Supplementary Analyses.
Research regarding functional status in later life has often utilized measures of functioning based upon self-reports. Some research has shown the advantages of independently including objective markers as well (Stephan et al., 2015). We therefore employed three self-reported measures of functional status (covering both functional limitation and disability) alongside grip strength, serving as an objective measure of functioning. Measuring the force an individual is able to exert upon a hand-held dynamometer is an objective method employed to assess physical decline and frailty, resulting from age-related loss of muscle mass and strength (Dodds et al., 2016; Fried et al., 2001). Experimentally induced younger SA was related to greater grip strength (Stephan et al., 2013). Additionally, because research has indicated that death-related thoughts are also relevant to hand grip strength (Peters et al., 2005), we could expect to find an interaction effect for SA and SNtD on grip strength as well.
In summary, though a growing body of research exists linking SA and important health outcomes among older adults; nevertheless, the potential moderating role of SNtD as a measure particularly relevant to later years has currently been understudied (Bergman et al., 2018, which targeted middle-aged adults), specifically via the way it may interact with SA during later years. Finally, research regarding indirect longitudinal pathways leading from SA toward future health outcomes is currently sparse and, to the best of our knowledge, almost nonexistent as related to SNtD. Understanding these pathways could further illuminate the mechanism by which SA longitudinally predicts future function.
This article, therefore, utilized the overarching model presented by Westerhof and Wurm (2015), while adding SNtD as an additional subjective view of aging. Upon this theoretical backdrop, we aspired to expand the previous cross-sectional studies of Shrira et al. (2014) and Hoffman et al. (2016) regarding the ability of SNtD to moderate SA. We sought to evaluate a longitudinal pathway incorporating and assessing simultaneously both measures of subjective views of aging and future functional status among older adults. Additionally, in order to better understand the pathways through which these measures of subjective views of aging may affect later coping, depressive symptoms were entered as a possible mediator. Based upon Westerhof and Wurm’s (2015) model, we hypothesized that SA would predict future functional status via the mediating role of depressive symptoms. We further hypothesized that SNtD would moderate the relationship between SA and depressive symptoms, thus moderating the mediation effect of depressive symptoms upon the link between SA and functional status measures over time, consistent with the results of Shrira et al. (2014) and Hoffman et al. (2016).
Method
Participants and Procedure
The study comprised a convenience sample of older adults. Approximately a third were living in nursing homes; the remainder within the community. Participants were interviewed at three time points, with 12 months between interviews. The number of participants at T1 was 224, 178 at T2 (79.4% of those interviewed at T1), and 164 at T3 (73.2% of those interviewed at T1). The data presented in this article relate to individuals who participated in all three interviews. This study received approval from the ethical review committee of the Faculty of Social Welfare & Health Sciences, Haifa University (approval number 049/15). All participants gave their informed consent. Attrition analysis was performed for participants who did not participate at T2 or T3 (Supplementary Material).
Demographic characteristics of the final sample (N = 164) are presented in Table 1. The mean age at T1 was 81.14 (SD = 6.82, range = 66–97), most were female (n = 122, 74.4%), most had completed high-school or academic education (mean years of education = 14.73, SD = 3.85), and more than half were widowed (n = 87, 53.7%).
Descriptive Statistics and Correlations for the Study Variables
| M/% | SD | 1 | 2 | 3 | 4 | 5 | 6 | 7 | 8 | 9 | 10 | 11 | |
|---|---|---|---|---|---|---|---|---|---|---|---|---|---|
| 1. Subjective age T1 | 2.28 | 0.71 | — | ||||||||||
| 2. Subjective nearness to death T1 | 2.27 | 1.29 | 0.35*** | — | |||||||||
| 3. Depressive symptoms T2 | 3.14 | 3.09 | 0.44*** | 0.41*** | — | ||||||||
| 4. Grip strength T3 | 14.73 | 6.99 | −0.20* | 0.004 | −0.27** | — | |||||||
| 5. Functional limitations T3 | 1.63 | 0.77 | 0.45*** | 0.24** | 0.54*** | −0.38*** | — | ||||||
| 6. ADL T3 | 0.42 | 1.25 | 0.28*** | 0.24** | 0.37*** | −0.20* | 0.67*** | — | |||||
| 7. IADL T3 | 1.45 | 1.58 | 0.27** | 0.09 | 0.42*** | −0.38*** | 0.72*** | 0.62*** | — | ||||
| 8. Grip strength T1 | 16.64 | 8.09 | −0.17* | −0.03 | −0.15* | 0.75*** | −0.31*** | −0.16* | −0.36*** | — | |||
| 9. Functional limitations T1 | 1.61 | 0.85 | 0.43*** | 0.22** | 0.48*** | −0.32*** | 0.74*** | 0.59*** | 0.56*** | −0.38*** | — | ||
| 10. ADL T1 | 0.45 | 1.17 | 0.41*** | 0.27*** | 0.46*** | −0.20* | 0.63*** | 0.75*** | 0.51*** | −0.19* | 0.69*** | — | |
| 11. IADL T1 | 0.74 | 1.27 | 0.19* | 0.18* | 0.29*** | −0.21** | 0.50*** | 0.56*** | 0.57*** | −0.18* | 0.50*** | 0.59*** | — |
| 12. Age T1 | 81.14 | 6.82 | 0.06 | 0.09 | 0.09 | −0.23** | 0.26* | 0.18* | 0.28*** | −0.28*** | 0.25** | 0.13 | 0.18* |
| 13. Gender (women) | 74.4 | — | 0.16* | −0.01 | 0.01 | −0.60*** | 0.12 | −0.03 | 0.09 | −0.63*** | 0.13 | 0.01 | −0.01 |
| 14. Years of education T1 | 14.73 | 3.85 | −0.16* | −0.13 | −0.23** | 0.21** | −0.39*** | −0.21** | −0.33*** | 0.26** | −0.27*** | −0.20* | −0.04 |
| 15. Marital status (married) T1 | 37.6 | — | −0.08 | 0.01 | −0.18* | 0.43*** | −0.35*** | −0.22** | −0.37*** | 0.50*** | −0.24** | −0.21** | −0.18* |
Notes: ADL = activities of daily living; IADL = instrumental activities of daily living. N ≤ 164. Correlation values represent Pearson coefficients except for coefficients for gender and marital status that represent point‐biserial coefficients.
*p < .05, **p < .01, ***p < .001.
Trained research assistants interviewed participants in their homes or in quiet public places. The interview lasted approximately 1 h.
Measures
Subjective age
SA at T1 was assessed by a four-item scale that referred to mental, physical, behavioral, and appearance-related aspects of age identity (Barak & Schiffman, 1981). Each aspect was rated on a 5-point scale (1 = feeling much younger than my age to 5 = feeling much older than my age). Ratings were averaged, with higher scores reflecting an older age identity. The Hebrew version of the scale was used in previous studies (Bodner et al., 2021). Internal reliability was good (α = 0.84).
Subjective nearness to death
SNtD at T1 was examined with a single item: “I have a feeling that my life is approaching its end,” as suggested by Kotter-Grühn et al. (2010). Participants were asked to rate their agreement on a scale ranging from 1 (not at all) to 5 (very much). The Hebrew version of the item was used in previous studies (Bodner & Bergman, 2019).
Depressive symptoms
Depressive symptoms at T2 were assessed by the Geriatric Depression Scale (GDS)-15 questionnaire (Sheikh & Yesavage, 1986). This scale is a 15-item instrument, designed specifically to assess depression in geriatric populations. Its items require a yes/no response. Ratings were summed, with higher scores reflecting greater levels of depression. The Hebrew version of the GDS-15 was used in previous studies (Zalsman et al., 1998). Internal reliability was good (Kuder–Richardson’s ρ = 0.83).
Grip strength
Grip strength at both T1 and T3 was assessed by giving participants a dynamometer (Smedley, S Dynamometer, 100 kg; TTM, Tokyo, Japan) and asking them to squeeze it as hard as they could while standing or sitting with their elbow at a 90° angle pressed against their body. Grip strength was recorded twice for each hand, the final value used for the analysis was the maximal grip strength obtained from any of these trials. Values were recorded as missing if the measurement differed by more than 20 kg for one hand, or if only a measurement of one hand was obtained. Valid values were defined as greater than zero and as smaller than 100 kg. Values outside this range were defined as missing (Andersen-Ranberg et al., 2009).
Functional limitations
Functional limitations at both T1 and T3 were measured by asking respondents to rate difficulties in performing five activities (adapted from Nagi, 1976), including stooping, kneeling, or crouching, reaching or extending arms above shoulder level, pulling or pushing heavy objects, lifting or carrying heavy weights, and picking up a small coin from a table. Each activity was rated on a scale from 1 (not difficult to perform at all) to 4 (extremely difficult to perform). The final score was based on the average of answers, with higher scores reflecting greater disability. The Hebrew version of the scale was used in previous studies (Shrira et al., 2014). Internal reliability was good (α T1 = 0.86; α T2 = 0.85).
Activities of daily living
Activities of daily living (ADLs) at both T1 and T3 were measured by asking respondents to rate their difficulties in six domains (adapted from Katz et al., 1970), including dressing, crossing a small room, getting in or out of bed, and toileting. Each function was rated with a dichotomized answer (not having difficulties/having difficulties). The final score was based on the sum of difficulties. The Hebrew version of the scale was used in previous studies (Shrira et al., 2016). Internal reliability was good (Kuder–Richardson’s ρ T1 = 0.83; Kuder–Richardson’s ρ T2 = 0.90).
Instrumental activities of daily living
Instrumental activities of daily living (IADLs) at both T1 and T3 were measured by asking respondents to rate difficulties in nine domains (adapted from Katz et al., 1970), including using a map, preparing meals, daily shopping, using the telephone, taking medications, doing housework, handling personal finances, leaving the house independently and accessing transportation services, and washing personal laundry. Each function was rated with a dichotomized answer (not having difficulties/having difficulties). The final score was based on the sum of difficulties. The Hebrew version of the scale was used in previous studies (Shrira et al., 2016). Internal reliability was good (Kuder–Richardson’s ρ T1/T2 = 0.72).
Background characteristics
Background characteristics included age, gender, years of education, and marital status.
Data Analyses
Data analysis was conducted in three stages. First, we analyzed descriptive statistics. In the second stage, ordinary least squares regression analyses were performed, separately for each of the functional status outcomes (i.e., grip strength, functional limitations, ADL, and IADL), with T1 SA as the predictor and T2 depressive symptoms as the mediator. Separate regressions were employed to independently test associations between SA and each of the functional status indices as previous studies showed that SA showed stronger associations with subjective indices of health relative to objective indices (Stephan et al., 2015). We entered the baseline level of each functional status outcome at T1 in Step 1, background characteristics (i.e., age, gender, years of education, and marital status) in Step 2, T1 SA in Step 3, and T2 depressive symptoms in Step 4. In the third stage, parallel mediation analyses (Model 4) and moderated mediation analyses (Model 7) were conducted using the PROCESS (version 3.1) macro for SPSS 25 (Hayes, 2018), which estimated 95 percentile bootstrap confidence intervals (CIs) for indirect effects based on 5,000 bootstrap samples. In the moderated mediation analysis (Figure 1), we tested whether the mediation models, particularly the T1 SA–T2 depressive symptoms association, were moderated by T1 SNtD. In other words, this moderation (SA and SNtD) should reveal the conditions under which the mediation models hold. These analyses also controlled for baseline functional status and background characteristics. Across variables with missing values, 0–4.9% cases were missing. Little’s test revealed that the data were missing completely at random, χ 2 (136) = 158.50, p = .09.
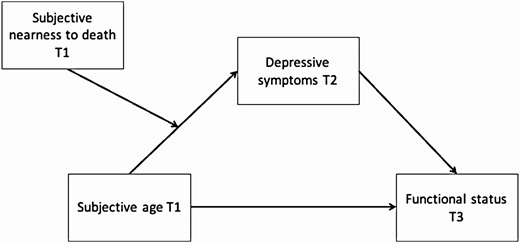
Specifications of the study model.
Results
Descriptive Statistics
Table 1 presents descriptive statistics and bivariate correlations. Feeling older was associated with feeling closer to death (r = 0.35, p < .0001). Noteworthy is the fact that neither SA nor SNtD at T1 was significantly associated with chronological age. Feeling older at T1 was associated with higher depressive symptoms at T2 (r = 0.44, p < .0001) and worse functional status at T1 (|r| ranged 0.17–0.43, p < .05) as well as at T3 (|r| ranged 0.20–0.45, p < .05). Feeling closer to death at T1 was similarly associated with higher depressive symptoms at T2 (r = 0.41, p < .0001), yet it had weaker associations with functional status at T1 (|r| ranged 0.03–0.27) as well as at T3 (|r| ranged 0.004–0.24), showing significant correlations mostly with functional limitations and ADL. Depressive symptoms at T2 correlated significantly with all functional status measures at T1 (|r| ranged 0.15–0.48, p < .05) as well as at T3 (|r| ranged 0.27–0.54, p < .05).
Regression Models
Table 2 displays that T1 SA did not predict T3 grip strength when other covariates were controlled for. T2 depressive symptoms predicted lower grip strength at T3. The parallel mediation analysis revealed a significant indirect effect for T2 depressive symptoms (B = −0.53, 95% CI [−1.14, −0.09]). Feeling older at T1 predicted more functional limitations at T3 and so did T2 depressive symptoms. The indirect effect for T2 depressive symptoms was significant (B = 0.05, 95% CI [0.002, 0.12]). Neither T1 SA nor T2 depressive symptoms predicted ADL at T3. The indirect effect was also nonsignificant (B = 0.01, 95% CI [−0.06, 0.11]). Finally, feeling older at T1 predicted more difficulties in IADL at T3 and so did T2 depressive symptoms. The indirect effect for T2 depressive symptoms was significant (B = 0.16, 95% CI [0.02, 0.36]), indicating that feeling older at T1 led to feeling more depressed at T2, which in turn led to worse functioning.
Ordinary Least Squares Regression Model Coefficients for T3 Functional Status Outcomes
| Outcomes | Grip strength T3 | Functional limitations T3 | ADL T3 | IADL T3 | ||||
|---|---|---|---|---|---|---|---|---|
| Predictors | B (SE) | β | Coefficient (SE) | β | Coefficient (SE) | β | Coefficient (SE) | β |
| Step 1 (ΔR2) | (0.57***) | (0.53***) | (0.53***) | (0.29***) | ||||
| Functional status measure T1 | 0.64*** (0.04) | 0.75 | 0.66*** (0.05) | 0.73 | 0.75*** (0.05) | 0.7 | 0.67*** (0.08) | 0.54 |
| Step 2 (ΔR2) | (0.04**) | (0.06***) | 0.02 | (0.14***) | ||||
| Age T1 | −0.13* (0.06) | −0.13 | 0.001 (0.006) | 0.01 | 0.01 (0.01) | 0.06 | 0.02 (0.01) | 0.09 |
| Gender (women) | −3.69** (1.14) | −0.23 | −0.09 (0.10) | −0.05 | −0.25 (0.16) | 0.06 | −0.12 (0.23) | −0.03 |
| Years of education T1 | −0.03 (0.10) | −0.01 | −0.03** (0.01) | −0.16 | −0.01 (0.01) | −0.03 | −0.08** (0.02) | −0.21 |
| Marital status (married) T1 | 1.14 (0.91) | 0.08 | −0.25* (0.10) | −0.16 | −0.19 (0.16) | −0.08 | −0.69** (0.23) | −0.22 |
| Step 3 (ΔR2) | -0.01 | (0.02**) | 0 | (0.03**) | ||||
| Subjective age T1 | −0.87 (0.53) | −0.08 | 0.18** (0.06) | 0.17 | −0.01 (0.10) | −0.01 | 0.36** (0.13) | 0.17 |
| Step 4 (ΔR2) | (0.02*) | (0.02**) | 0 | (0.03**) | ||||
| Depressive symptoms T2 | −0.34* (0.13) | −0.15 | 0.04** (0.01) | 0.16 | 0.01 (0.02) | 0.03 | 0.10** (0.03) | 0.2 |
| Model R2 | 0.62*** | 0.62*** | 0.53*** | 0.47*** | ||||
Note: ADL = activities of daily living; IADL = instrumental activities of daily living.
*p < .05, **p < .01, ***p < .001.
Moderated Mediation Models
Before testing the interaction between T1 SA and SNtD, we wanted to assess the added value of including T1 SNtD and its interaction with SA within our model. To assess the added value of T1 SNtD, we regressed T2 depressive symptoms on the covariates and T1 SA only and then added T1 SNtD and its interaction with T1 SA to the model. The model with T1 SA only explained 18.9% of the variance in T2 depressive symptoms. The model with T1 SA, T1 SNtD, and their interaction explained only 30.8% (i.e., the latter model explained an additional 11.9% variance). It is worth noting that both T1 SA (B = 1.31; p < .0001) and T1 SNtD (B = 0.71; p < .0001) significantly predicted T2 symptoms.
The moderated mediation analysis revealed a significant interaction (T1 SA × T1 SNtD interaction term, B = 0.65, 95% CI [0.16, 1.15]) of moderated mediation (for T2 depressive symptoms the moderated mediated index was B = −0.22, 95% CI [−0.59, −0.005]). Such results indicate that the indirect effect of T1 SA on T3 grip strength via T2 depressive symptoms was moderated by T1 SNtD. Specifically, T2 depressive symptoms mediated the T1 SA–T3 grip strength link only for participants with at least average SNtD levels at T1 (Table 3).
Results for the Moderated Mediation Analyses for T1 Subjective Age and T3 Functional Status Outcomes via T2 Depressive Symptoms, as Moderated by T1 Subjective Nearness to Death
| Subjective nearness to death T1 | ||||||
|---|---|---|---|---|---|---|
| −1 SD | Mean | +1 SD | ||||
| Conditional indirect effect | 95% CI | Conditional indirect effect | 95% CI | Conditional indirect effect | 95% CI | |
| Grip strength T3 | −0.0016 (0.1942) | [−0.4034, 0.4015] | −0.2924 (0.1976) | [−0.7813, −0.0199] | −0.5832 (0.3444) | [−1.4030, −0.0733] |
| Functional limitations T3 | −0.0231 (0.0219) | [−0.0690, 0.0289] | 0.0231 (0.0219) | [−0.0037, 0.0819] | 0.0602 (0.0410) | [0.0023, 0.1619] |
| ADL T3 | −0.0018 (0.0177) | [−0.0430, 0.0328] | 0.0131 (0.0268) | [−0.0346, 0.0757] | 0.0279 (0.0530) | [−0.0649, 0.1426] |
| IADL T3 | 0.0104 (0.0645) | [−0.1172, 0.1518] | 0.1160 (0.0699) | [0.0155, 0.2857] | 0.2215 (0.1158) | [0.0459, 0.4952] |
Notes: CI = confidence interval; ADL = activities of daily living; IADL = instrumental activities of daily living. Values represent unstandardized coefficient estimates, with standard errors in parentheses for conditional indirect effects. Significant results are marked in bold, p < .05.
When referring to T3 functional limitations, the moderated mediation index was significant as well (B = 0.02, 95% CI [0.0006, 0.07]). Table 3 displays that T2 depressive symptoms mediated the T1 SA–T3 functional limitations link only among those who felt closer to death (with SNtD at +1 SD). The moderated mediation index was not significant in predicting T3 ADL (B = 0.01, 95% CI [−0.02, 0.06]). Moreover, Table 3 displays that the mediation effect of T2 depressive symptoms was not significant at any level of T1 SNtD. Finally, the moderated mediation index was significant when T3 IADL was the outcome (B = 0.08, 95% CI [0.01, 0.19]). Table 3 presents that T2 depressive symptoms mediated the T1 SA–T3 IADL link only among individuals whose SNtD was average or high, but not among those whose SNtD was low.
In order to further assess whether an opposite pathway emerged, leading from functional status at T1 to SA at T3, we performed supplementary analyses (Supplementary Material).
Discussion
In this study, we examined whether subjective views of aging would predict subsequent functional status and if depressive symptoms mediated this prediction. For the most part, zero-order correlations showed that both SA and SNtD were associated with measures of functioning, such that an older SA and greater SNtD corresponded to worse functioning. Similarly, depressive symptoms also correlated with indices of functioning, such that a higher level of depressive symptoms was associated with worse functioning. After controlling for demographic covariates, SA at T1 was significantly related to functional limitations and IADL. In addition, significant mediating effects emerged, whereby depression at T2 indirectly mediated the longitudinal relationship between SA at T1 and the various T3 functioning measures (except for ADL). Thus, the existence of depressive symptoms at T2 accounted for the extent to which SA predicted later functioning. Finally, SNtD moderated this significant indirect pathway, such that a higher SNtD (i.e., feeling closer to death) at T1 accentuated the extent to which depressive symptoms mediated the relation between SA at T1 and future functioning at T3 for all measures, except for ADL.
Viewing these results more specifically, the first major finding, whereby depressive symptoms played a mediating role within the ability of an earlier measure of the subjective view of aging to predict future functioning, is consistent with our first hypothesis. These findings provide empirical support for Westerhof and Wurm’s (2015) theory-driven assumptions, by showing that a specific measure of subjective views of aging (SA) predicted later functional outcomes through a specific longitudinal mechanism (depressive symptoms). However, as Westerhof and Wurm (2015) did not consider the possibility that one measure of subjective views of aging (SNtD) may attenuate another such measure (SA), the present findings also expand their model by demonstrating that the role of SA in predicting later functional outcomes may significantly vary depending on an individual’s SNtD. Future studies aimed at further substantiating the Westerhof and Wurm’s (2015) model would do well to incorporate this additional dimension within their research model. Furthermore, because our focus was on only two measures of subjective views of aging and one potential indirect pathway, future research should incorporate additional measures and pathways as well.
Our second major finding that SNtD was found to moderate the aforementioned indirect pathway is consistent with this study’s second hypothesis, as well as with earlier research of Hoffman et al. (2016) and Shrira et al. (2014), described above. Here too, the present findings may be seen as further expanding these earlier results in a number of ways. Primarily, the current research, having employed a longitudinal structure, delineated the predictive ability of these two combined measures of aging over time. Our results may further highlight the important role of SNtD as an indication of latent processes in later life. This may be due to the unique nature of later adulthood. This stage has been found to reflect a greater extent of heterogeneity within an array of psychological domains (Stone et al., 2017), as outcomes of lifelong practices become more explicit. Our findings may be seen to reflect the interplay between ongoing processes related to aging and the growing preoccupation with present or future-related functional concerns associated with dying. As previously suggested, SA may be more suitable for assessing aging-related processes (Shrira et al., 2014), whereas SNtD may be more suitable for capturing opposing processes related to the perceived presence (or absence) of threat in general (Hoffman et al., 2016) or, more specifically, the threat of actual death. Viewing the role of SNtD as a measure sensitive to perceived threat may gain further support by the fact that the presence of an SNtD moderating effect emerged only among those with moderate or high levels of SNtD (Table 3). This polarized view regarding the distinctive nature of these two subjective views of aging could plausibly be offered as the underlying mechanism through which SNtD may moderate SA.
Regarding measures of functional status, the absence of longitudinal relationships with ADL is noteworthy. Presumably, this is a result of our sample being comprised primarily of community-dwelling individuals, creating an apparent floor effect for the basic tasks that comprise ADLs. Future studies with a greater representation of clinical populations may yield different results. Of the remaining three measures of functional status, all displayed relatively similar mediating and moderating effects. Our choice to differentiate between objective and subjective indices of functional status proved to be informative. It should be further noted that, of the T3 measures of functioning, grip strength was the only one that related to an earlier SA (at T1) solely via an indirect pathway, with a relatively higher coefficient that linked it with T2 depressive symptoms. These findings are consistent with recent reports regarding the importance of grip strength as a prominent general objective marker for functioning in older age (Bohannon, 2019), and more specifically, as a possible indicator of the presence or absence of depression (Marques, 2020). Regarding the possibility of an opposite pathway from functional status to SA, our supplementary analyses showed that baseline functional status predicted T3 SA, but mainly indirectly by affecting T2 depressive symptoms (with the exception of IADL that had a direct effect on T3 SA; Supplementary Material).
Our findings should be viewed in light of its limitations. A complex statistical model that controls at times for both mediating and moderating effects while controlling covariates may reduce the power of each specific relationship, particularly in a relatively small sample. It is possible that additional significant findings would have emerged had the sample been larger. Nevertheless, the size of the sample does not undermine the finding that actually emerged. Additionally, as respondents were recruited as a convenience sample, overrepresentations may have confounded the results reducing generalizability, the lack of a greater representation of less functionally independent individuals has also been previously noted. Our longitudinal findings may suggest a plausible pathway through which to infer causality, but in order to establish true causality experimental designs are still required. Finally, future studies are needed to replicate our findings while utilizing SA as a measure of years, in addition to the operationalization that we used.
In conclusion, to the best of our knowledge, this study is the first to observe an indirect relationship between SA and future functional status while concurrently observing for moderating effects of SNtD, among older adult participants. These results support the theoretical model of Westerhof and Wurm (2015) while extending it to stress the importance of SNtD as a critical moderator of the association between SA and subsequent functioning. Additionally, our results highlight the significant role that depressive symptoms may play within these longitudinal pathways as well as the advantages of using grip strength as a broad age-related measure. The current results, demonstrating that subjective measures of aging may predict change in functional status 3 years later among older adults, could be of importance for the individual as well as for policymakers, as views of aging may potentially be modifiable through intervention (Stephan et al., 2013).
Funding
This work was supported by the Israel Science Foundation (grant 1234/14).
Conflict of Interest
None declared.
Data Availability
Data, analytic methods, and study materials will be made available to other researchers upon request from the corresponding author. The study was not preregistered.

