


Abstract
Inequalities between poorer and wealthier people in accessing healthcare services have been widely studied, but the mechanisms generating them are still to be fully understood. Among these, there is still a lack of evidence of relationships between health prevention/health promotion policies, welfare systems and social differences. We analysed 68 201 females from the PASSI Italian surveillance system for the years 2007–2010. The prevalence of women undergoing Pap testing was used as an example of access to preventive services. An odds ratio gradient was found with regard to different welfare system clusters: the probability of undergoing a screening test is higher for more advanced welfare systems. A strong association was found between having received a letter from the local health unit and having undergone the screening test. Significant differences still exist between high- and low-income women and their access to Italian preventive public services. As we expected, social determinants play an important role in health disparities, as these are also strongly influenced by typologies of welfare systems and by health policies.
INTRODUCTION
In Italy, like in many other developed countries, access to healthcare appears to favour the better-off (Masseria and Giannoni, 2010; Damiani et al., 2012). Among the social determinants of health, the scientific debate has pointed out that the role of welfare systems is a major one (Dahlgren and Whitehead, 1991; Wilkinson and Marmot, 2003; Cannon, 2008). In this framework, the study of the contribution played by welfare, individual social determinants (such as income or education), healthcare systems and health inequalities is an important path of present and future research. Moreover, there is an inverse association between the income level and the use of hospitalization (Schifano et al., 2009), and women with a lower socio-economic status (SES) have a significantly lower rate of ever having undergone Pap tests than women with a higher SES (Ronco et al., 1991; Minardi et al., 2011).
These differences occur not only in access to healthcare services, but also in mortality, where relative inequalities have increased (Mackenbach et al., 2003) and differences between socio-economic groups have widened (Michelozzi et al., 1999). Globally, the differences between richer and poorer people (both economically and culturally), as well as the inequalities among population groups, have increased in the last decade (CSDH, 2008); healthcare access is not equally distributed (van Doorslaer et al., 2006), and there is a positive association between social capital and better health (Islam et al., 2006; van Groezen et al., 2011).
Although the connections between health status and social determinants have been seriously investigated (Wilkinson, 2006; Wilkinson and Pickett, 2009), the mechanisms that generate different levels of inequalities and, particularly, the possible connections between disease prevention and health promotion actions, the contextual environment and the effects on the relationship between social determinants and health, need further analysis. Furthermore, there is still a lack of evidence concerning the effects of the welfare state health-policy dimension on these complex relationships. In recent reviews (Beckfield and Krieger, 2009; Bambra, 2011), divergent findings on the associations between the welfare state health systems and the reduction or the increase in health inequalities were found. Moreover, the effects of interventions on health inequalities are not yet clear (Bambra et al., 2010), and there is still a lack of knowledge about healthcare access in the general population (Martikainen et al., 2004; Zambon et al., 2006). Income-related health inequalities vary according to welfare state regimes, in particular in the liberal countries (the UK and Ireland) that have the most considerable differences, while the least significant diversity is found in the so-called Social Democratic welfare regimes (Denmark, Sweden, Norway; Navarro et al., 2006; Chung and Muntaner, 2007) or, for other authors, in the countries with a Bismarckian welfare regime (Germany, France, Austria, Belgium and Netherlands; Eikemo et al., 2008). Finally, there is still a lack of knowledge concerning the process that links preventive actions to social inequalities and welfare system as a whole causal path (Whitehead, 2007).
The major aim of our work is to investigate possible relationships between social determinants, welfare systems, health promotion activities and disease prevention services access. Our study is focused on Italy, where—given the rescaling of health and social services (Kazepov, 2010)—different welfare systems are present. One general preventive service (the Pap smear test) has been taken into consideration because it is freely and widely offered to the female population, so a difference in the prevalence of access is consequently only due to varying cultural and social attitudes and the presence/effectiveness of specific health promotion actions that could support an higher use of such preventive services. Considering that this service is offered in the same way and with the same propagation (in terms of local availability) throughout the country, different health promotion actions to encourage the service are carried out in different regions and local areas. As known, these actions, typically targeted to the general population, are not always capable of reducing inequalities, even, sometimes (Frohlich and Potvin, 2008), favouring their increase.
Data obtained from the national surveillance system—covering all the regions of the country—have been used to evaluate the access to the service and to relate it to some social determinants variables and to proxy information on the promotion of the service. In particular, we have analysed data from the PASSI (Italian acronym for Progress in the Italian local health units) surveillance system (Baldissera et al., 2011), collected in the 2007–2010 period.
We have had to deal with the fairly obvious limitations connected to a standardized system with a fixed internationally validated questionnaire, with questions and variables that only partially cover the subjects we have been investigating (e.g. we have only used education and a proxy of income for social determinants, the acknowledgement of having received a letter from the health promotion board for health promotion activities etc.). Another major limitation, which is quite frequent in these types of studies, is that we relied on self-declared variables. The definition of the typology of welfare system is given by the region of the respondent, associated with specific typologies of welfare systems, as defined in previous studies (Bertin, 2013).
The general aim of our work deals with questions that have a direct impact on policy. By specifically examining the above-mentioned relationships, we were able to answer the following substantial policy questions more easily: (i) are there still inequalities in the access to some preventive services, among the different regions in Italy, even if they are free and widely available? (ii) do inequalities depend on regional welfare systems or are they homogeneous throughout the country? (iii) do promotion initiatives influence the access and the inequalities in the access to preventive services?
METHODS
The PASSI Italian Behavioural Risk Factor Surveillance system is conducted by participating local health units, which use a common questionnaire and data collection methods. The number of local health units participating in PASSI varies from region to region. For 17 (of 21) Italian regions, the participation rate was of 100%, for two regions was over 70%, being only for Lombardia and Molise as low as 30%. This system covers more than 80% of the Italian population. Each month, local health units' staff interview (via telephone) a random sample of resident adults aged 18–69. The response rate was higher than 80% for each year considered. The sample for the 2007–2010 years was made up of 134 494 subjects. The percentage of females was equal to 50.7%, and consequently, the total number of subjects analysed in our study was 68 201.
The questionnaire covers a variety of topics related to health behaviour and prevention, all of which are considered priorities in the National Health Plan (Italian Ministry of Health, 2011). The fixed core modules (a standard set of 114 questions) were asked by all participating local health units. These questions deal with self-perceived health and quality of life, smoking habits, alcohol consumption, cervical and breast cancer screening (only for women), colorectal cancer screening, diet and nutritional status, physical activity, mental health, cardiovascular risk factors, influenza and rubella vaccination (the latter only for women), prevention of traffic accidents and domestic injuries and other socio-demographic aspects. Since the local health units differ considerably in terms of population sample size, a weight specific to each local health unit stratum (defined by sex and age groups) is added to each record. This weight takes into account the number of interviews performed in each of the six strata of the local health unit's sample and the size of the corresponding strata in the local health unit's target population [for a detailed description of the sampling strategy and other technical issues of the system, refer to Baldissera et al. (Baldissera et al., 2011)].
To define high- and low-income subjects, we used the response given to the question ‘with the financial resources you have at your disposal (either from your income or from the family income), how do you manage to get to the end of the month?’ The subjects that replied ‘very easily’ or ‘quite easily’ were considered medium-/high-income subjects; those who replied ‘with some difficulties’ were considered medium-low-income subjects; and those replying ‘with a lot of difficulties’ were considered low-income subjects. We used the prevalence of women who had undergone the Pap test (in the last 3 years) as an indicator of access to healthcare services.
Racial and citizenship differences among non-Italian respondents were not considered, since these subjects were less than 5% of the total sample size. We defined three age classes: 18–34, 35–49 and 50–69 years old subjects.
We calculated usual descriptive statistics [percentages, means and relative confidence intervals (CIs)] and, where appropriate, p-values for testing significances in differences. To estimate odds ratios (ORs) corrected for potential confounders, we used a logistic regression model, which took into account interactions between outcome and confounders (we have reported the interactions detailed output in the electronic supplementary material). All the CIs have been computed at a 95% confidence level. Data were analysed with STATA 12 software (StataCorp. 2011. Stata Statistical Software: Release 12. StataCorp LP, College Station, TX), using appropriate commands to take account of the survey design.
The definition of welfare system models and their clustering has been derived from previous studies (Esping-Andersen, 1990; Wood and Gough, 2006; Bertin, 2012), and it is briefly described in the next paragraph.
Italian welfare systems and social inequalities
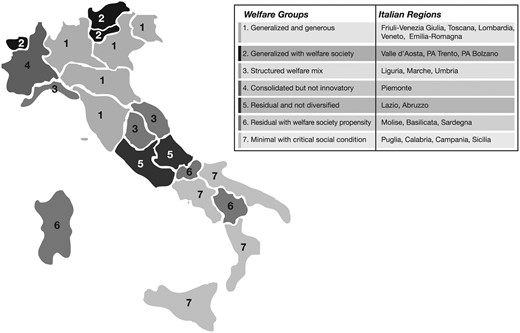
In Italy, like in many other countries, there is a great territorial diversification of welfare systems, which reflects the actions of public and private actors producing public policies. In this paper, we considered the regional dimension as the most appropriate variable to explain territorial differences (there are 21 administrative regions in Italy), because the public health system is regionalized and regions have substantial autonomy in organizing public health services. A categorization of the geographical areas into homogeneous groups was consequently considered (Murray et al., 1999). Using a set of variables that took into account the management and distribution of services, as well as the different contexts and the social cohesion of territories, we ran a cluster analysis (Bertin, 2013) that classified the administrative regions into seven different types of welfare system clusters (Figure 1).
Welfare clusters definition.
The cluster analysis was carried out by using six factors derived from analyses run on several (more than 30) indicators, available in official databases (Istat, 2009). The factors summarizing the set of indicators were the following: ‘structured welfare mix’, ‘welfare society’, ‘shared rights’, ‘territorial services’, ‘social cohesion’ and ‘social risks’. The structured welfare mix factor defines the different offers of services given by a different combination of public, private and third sector actors. Conversely, the welfare society primarily refers to the presence of third sector or non-governmental actors. The shared rights factor is made up of variables that describe the offer of public services, such as pensions and invalidity pensions. The territorial services factor is defined by variables that measure the supply of home assistance and the number of nursery schools in the different regions considered. The social cohesion factor measures the social capital of each region, the non-profit organizations territorial diffusion and the reliance on public institutions. Finally, the social risks factor takes into account the household poverty index, the unemployment rate of young people, the percentage of young people that did not complete the compulsory education cycle and the Gini index.
After finding a definition for these factors, we ran a hierarchical cluster analysis that led to the aggregation of regions in homogeneous clusters. Hierarchical clustering is a statistical procedure that assigns each unit of a sample (in our case each region) to a subset of the sample itself, assessing proximity among units. The algorithm finds the most similar units (regions in our case) according to a specified proximity measure and merges them into clusters. The main purpose of this technique is to gather and select meaningful information from vast aggregates of data. The group that displayed the most developed welfare system was defined as ‘generalized and generous’ and it is characterized by a widespread and abundant offer of services, meaning that it pays particular attention to the development of territorial services. This welfare system cluster seems to be in transition with a prominent mixture of public and private actors, but also with clear indications of societal-like processes. It is also worth noting that this cluster revealed that it had a moderate social cohesion, reflecting its relatively low social risks. The administrative regions included in this cluster are Friuli-Venezia Giulia, Toscana, Veneto, Emilia-Romagna and Lombardia.
Conversely, the less structured system was defined as ‘minimal with critical social conditions.’ This cluster is characterized by a scarce presence of public and voluntary or non-profit services, a limited offer system with a relatively low diffusion of territorial services, and it is faced with high social risks and a low level of social cohesion. The Puglia, Calabria, Campania and Sicilia regions constitute this cluster.
The ‘generalized with welfare society’ group of regions shows a relevant presence of public and third sector actors, supported by an integrated and cohesive civil society. In this case, the offer system is spread over a wide area, but the social risks are still quite high. Valle d'Aosta, the Autonomous Provinces of Trento and Bolzano (the latter two constitute the Trentino-Alto Adige region) are included in this cluster.
The ‘structured welfare mix’ group is characterized by a mixture of welfare society and a strong welfare system and also by a propensity for territorial services development. The welfare system presents an average offer of services, the social cohesion is medium-low and the social risks are also low. The Liguria, Marche and Umbria regions constitute this cluster.
The ‘consolidated but not innovatory’ cluster features a public–private mixture of actors with a small societal presence. The offer system is developed and consolidated, but the diffusion of territorial services is limited. The social risks and the social cohesion are both relatively low. There is only one region with these features: Piemonte.
The ‘residual and not diversified’ group presents a relatively scarce and not diversified offer of services, as well as a low propensity for the welfare society. The propensity to develop a territorial services system is in line with the national average, but there is a low social cohesion and a medium-low level of social risks. Lazio and Abruzzo define this cluster.
The ‘residual with welfare society propensity’ group is characterized by a limited presence of public and private offer and by a relatively inadequate territorial development, as well as a mild social cohesion and a presence of ongoing societal processes. The Molise, Sardegna and Basilicata regions belong to this cluster.
RESULTS
Socio-demographic characteristics of the sample considered are reported in Table 1. The PASSI surveillance system shows strong differences between lower- and medium-/high-income classes in several variables, from education to diseases and risk factors: university or higher education courses of study are completed by 21.5% (95% CI 20.9–22.1) of medium-/high-income women and only by 6.5% (95% CI 5.8–7.2) of lower-income women; among lower-income women 10.3% (95% CI 9.6–11.2) are divorced, compared with 3.8% (95% CI 2.3–2.7) of the medium-/high-income class women.
Socio-demographics of females for different income classes (medium/high, medium/low, and lower income) from the PASSI survey, 2007–2010
| Lower income (n = 8903) | Medium/low income (n = 27 903) | Medium/high income (n = 31 144) | |
|---|---|---|---|
| Age classes (years) | |||
| 18–34 | 24.7 (23.6, 25.9) | 29.0 (28.4, 29.6) | 32.3 (31.7, 32.9) |
| 35–49 | 33.9 (32.7, 35.1) | 34.8 (34.2, 35.5) | 33.4 (32.8, 34.0) |
| 50–69 | 41.3 (40.1, 42.6) | 36.2 (35.6, 36.8) | 34.3 (33.8, 34.9) |
| Higher study title achieved | |||
| Primary school or lower | 26.3 (25.2, 27.5) | 16.0 (15.5, 16.6) | 8.4 (8.1, 8.8) |
| Middle school | 37.3 (36.0, 38.7) | 32.3 (31.6, 33.0) | 21.0 (20.4, 21.6) |
| High School | 29.9 (28.7, 31.2) | 42.0 (41.3, 42.8) | 49.1 (48.4, 49.8) |
| University or higher | 6.5 (5.8, 7.2) | 9.7 (9.2, 10.1) | 21.5 (20.9, 22.1) |
| Nationality | |||
| Italian | 95.1 (94.6, 95.6) | 96.0 (95.8, 96.3) | 97.5 (97.3, 97.7) |
| Other | 4.9 (4.4, 5.4) | 4.0 (3.7, 4.2) | 2.5 (2.3, 2.7) |
| Marital status | |||
| Married | 58.5 (57.1, 59.8) | 64.0 (63.3, 64.7) | 61.6 (60.9, 62.3) |
| Not Married | 23.7 (22.5, 24.9) | 26.0 (25.3, 26.6) | 31.3 (30.7, 32.0) |
| Widow/Widower | 7.6 (6.9, 8.3) | 4.4 (4.1, 4.7) | 3.3 (3.0, 3.6) |
| Divorced | 10.3 (9.6, 11.2) | 5.7 (5.4, 6.1) | 3.8 (3.6, 4.1) |
Percentages (95% CI) are calculated on income class totals.
Income is also strongly associated with the main diseases: 8.3% (95% CI 7.7–8.8) of women in the lower-income class are diabetic, compared with 2.6% (95% CI 2.5–2.8) of women in the medium-/high-income class; and there is a 20.7% (95% CI 19.5–21.9) prevalence of depression in the lower income class, which is more than three times that of the medium-/high-income class at 6.8% (95% CI 6.4–7.2). A similar magnitude of difference was found for asthma, bronchitis and other respiratory problems, as well as for heart disease. Finally, smokers are also more prevalent in the lower-income class where 31.0% (95% CI 29.7–32.3) are smokers compared with 21.0% (95% CI 20.4–21.6) in the medium-/high-income class.
Pap test prevalence in each cluster is reported in Table 2. There is a difference of more than 10% between this prevalence in low-income and medium-/high-income classes; the difference is still present within clusters, but it is attenuated in the southern regional clusters (6 and 7 in particular) and widened for the northern ones (2, 3 and 4). The combination of the two factors shows a prevalence of access to Pap tests for women in the wealthier group with a more advanced welfare system that is higher than 80%, whereas the prevalence is around 50% in the most disadvantaged group, with a less developed welfare system and poorer population. The prevalence of women undergoing a Pap test for different factors and their relative adjusted ORs are reported in Table 3. There is a clear significant negative ORs gradient effect associated with different welfare systems, meaning that the adjusted probability of undergoing a Pap test is significantly lower in the last four clusters that relate to most of the southern regions in Italy.
Prevalence of females that underwent a Pap test in the last 3 years for different income classes and welfare system clusters from the PASSI survey, 2007–2010
| Welfare system | Lower income | Medium/low income | Medium/high income | Total |
|---|---|---|---|---|
| 1 | 73.3 | 80.1 | 82.8 | 80.9 |
| 2 | 71.0 | 76.8 | 84.4 | 81.2 |
| 3 | 66.2 | 74.7 | 78.7 | 75.7 |
| 4 | 70.2 | 78.8 | 83.0 | 79.8 |
| 5 | 66.4 | 74.2 | 79.5 | 74.8 |
| 6 | 56.5 | 56.7 | 61.9 | 58.4 |
| 7 | 51.1 | 56.6 | 60.0 | 56.3 |
| Total | 61.4 | 69.9 | 77.4 |
Percentages (95% CI) are calculated on the basis of the total number of subjects for each income class that underwent the clinical test.
Female percentages, adjusted ORs (95% CI), of having versus not having undergone Pap tests for different factors
| Women (%) | Pap test (n = 39 833) | |
|---|---|---|
| Welfare system | ||
| 1 | 34.3 | 1 |
| 2 | 2.2 | 1.4 (0.8, 2.6) |
| 3 | 8.2 | 1.0 (0.7, 1.4) |
| 4 | 8.5 | 0.6 (0.4, 0.8)a |
| 5 | 14.3 | 0.7 (0.5, 0.9)a |
| 6 | 3.0 | 0.4 (0.3, 0.6)a |
| 7 | 29.4 | 0.5 (0.4, 0.7)a |
| Income | ||
| Lower | 14.6 | 1 |
| Medium/low | 42.6 | 1.3 (1.1, 1.4)a |
| Medium/high | 42.8 | 1.3 (1.2, 1.4)a |
| Nationality | ||
| Italian | 96.7 | 1 |
| Not Italian | 3.3 | 0.5 (0.4, 0.5)a |
| Age classes (years) | ||
| 18–34 | 29.8 | 1 |
| 35–49 | 34.0 | 1.3 (1.2, 1.4)a |
| 50–69 | 36.2 | 0.6 (0.6, 0.7)a |
| Higher study title achieved | ||
| Primary school or lower | 14.3 | 1 |
| Middle school | 28.2 | 1.9 (1.7, 2.2)a |
| High School | 43.3 | 3.0 (2.6, 3.4)a |
| University or higher | 14.3 | 3.3 (2.8, 3.9)a |
| Letter reminder | ||
| Not received | 46.0 | 1 |
| Received | 54.0 | 3.5 (3.2, 4.0)a |
| Marital status | ||
| Married | 62.1 | 1 |
| Not Married | 27.9 | 0.5 (0.4, 0.5)a |
| Widow | 4.4 | 0.6 (0.5, 0.7)a |
| Divorced | 5.6 | 0.9 (0.8, 1.0)b |
Reference profiles are indicated with an OR equal to 1.
ap < 0.001.
bp < 0.05; if nothing is specified, the parameter is not statistically significant.
A positive association has been found between higher income and access to healthcare services. The same is true for middle aged (35–49 years) women (OR = 1.3, 95% CI 1.2–1.4). Foreign citizens are less likely to undergo a Pap test (OR = 0.5, 95% CI 0.4–0.5), and the same was found for women aged 50–69 years (OR = 0.6, 95% CI 0.6–0.7). A positive association was also found regarding education, because the greater the proportion of people who had pursued a higher education course of study was, the higher the probability was of having access to preventive services.
There is also a strong association between having received a letter from the local health units inviting women to undergo a free Pap test and having done the test (Pap test, OR = 3.5, 95% CI 3.2–4.0). In fact, in several Italian regions, the question concerning the letter reminder is a proxy of a relatively developed health promotion policy that invites citizens to participate in screening programs after they have received a letter, or often after several reminders, to take part in specific campaigns. A negative association between not being married (not married, widowed, and divorced) and the access to Pap testing has also been found (OR = 0.5, 95% CI 0.4–0.5; OR = 0.6, 95% CI 0.5–0.7; OR = 0.9, 95% CI 0.8–1.0, respectively).
There are significant interactions between having received an invitation to undergo the Pap test and belonging to different welfare systems. This is true for all welfare groups (p < 0.001), except for group 4 (p > 0.05), and for group 6 where there is a mild association (p = 0.06).
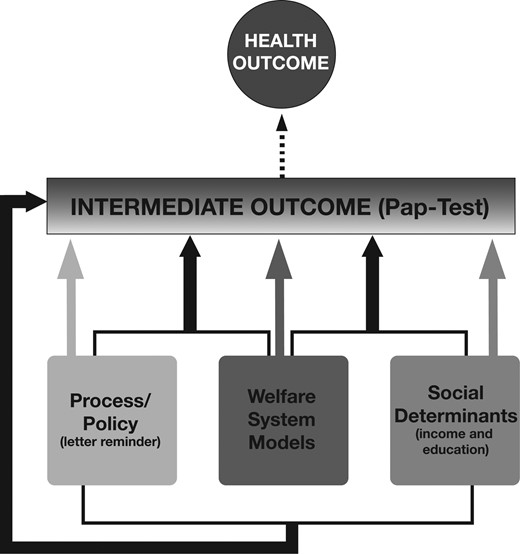
For the sake of brevity, interactions have not been reported in the table and are only available in the electronic supplementary material section of the paper. Figure 2 synthetically shows the results of the interactions among the factors influencing access to the Pap test. All the three major components (welfare system group, social determinant ‘education and income’ and process/policy ‘sending a letter to invite for the screening’) continue to directly influence access to preventive services.
Graph analysis (resulting from log-linear regression once interactions have been considered, solid lines) of the main factors influencing access to Pap testing.
Some interactions are of particular interest: for example, the effect of the letter (i.e. a developed health promotion activity) is much greater in some welfare system clusters, and the social determinants affect the Pap test access differently in different welfare system clusters. Moreover, the letter reinforcement policy has a different effect on different education groups, which quite interestingly reduces the social determinants disparities (once all the other effects have been considered).
DISCUSSION
Several research reports (CSDH, 2008) underline the relationship between general population health status and social determinants, often measured by variables that define an individual social status, such as income, type of work, gender and course of study. Mechanisms that generate this relationship and particularly how disease prevention and health promotion can intervene in effectively influencing them are still under study, and they could also possibly have different effects in different contexts (Link and Phelan, 1995; Woodward and Kawachi, 2000; Adler and Conner Snibbe, 2003; von Wagner et al., 2011). Among major contextual aspects, welfare systems can play an important role in reducing (or not) the possible effects of social determinants, particularly when the key outcome variable is linked to social and cultural factors, such as the access to health services.
Our work has considered the condition of health as a consequence of a lifetime path along which individuals experience events connected with their milieu. The physical environment (with etiologic factors connected to pollution or infective pathogenic elements), and the social sphere (with relational and socio-economic dynamics), can trigger critical events that require a physical, psychological and/or social response from the individual. Individuals respond by using the resources at their disposal, which can be psychological (stress management skills), physical (the immune defense system) or social (the use of social capital). A person's background influences the type and the amount of resource at the disposal of an individual for use in overcoming critical events. The complexity and multidimensionality of the correlation between psycho/sociological mechanisms and loss of health is well described in the work of Wilkinson and Pickett (Wilkinson and Pickett, 2009).
In addition to that, social determinants are correlated with both the frequency of critical events that an individual can manage and the amount of resource that the individual can use (Mechanic and Tanner, 2007). The relationship between lifestyles and social determinants is well established in literature; particularly, how much social determinants can influence risk factor behaviour (Marmot, 2005).
The processing of lifetime experiences also depends on macro factors connected to socio-economic dynamics and to the WS, both of which determine the context in which the person acts; to this end, Bourdieu uses the field concept (Bourdieu, 1996).
Our work delves into the relationship between macro- and micro-processes, and in our specific case, the access to preventive services. We have followed two main research lines that examine: (i) practices that are associated with social conditions or can build up a relationship with citizens regardless of their social condition and (ii) welfare systems which can reduce, or enhance, social inequalities.
Although the results reported here are limited to a specific preventive service and have some limitations, the importance of the role played by both WSs and health promotion policies in influencing access to the healthcare services we have taken as our case study is quite evident. A preventive service, although offered freely and widely, can have substantially different access rates if it is not supported by health promotion actions (in the Italian experience the ‘I have received a letter’ variable is a proxy measure of the presence of developed health promotion programs). Similar substantial differences are produced by more or less ‘health promoting’ welfare systems; it is worthwhile to remember that the provision of such services is mandatory for all the local health units in Italy, independently from the region in which they are located, so the observed differences cannot be caused by a different presence of such services in regions with different welfare systems. Notably, the interaction among these two variables (health promotion activities and welfare systems) is highly significant: not only these two factors are associated with an increase in access per se, but, being more likely that health promotion activities are organized in more ‘promoting’ and advanced welfare systems, the combination of the two effects can generate the substantial differences observed in the Italian geographical regions.
Furthermore, we showed that social determinants can produce (different) inequalities inside different welfare systems. As this is one of the most well-established preventive services in Italy, we believe that the results we found in our study could be extended to other areas of the health services, at least in the Italian context. Starting from these findings, it would be interesting to study how welfare systems and social determinants interact and affect the access to health services in other European and non-European countries.
In the Italian context, a health promotion policy, such as the actions to promote an important preventive service such as the Pap test, with acknowledged evidence of efficacy (Tseng et al., 2001; Stone et al., 2002; Taplin et al., 2004; Stein et al., 2005; Baron et al., 2010; Vernon et al., 2010; Everett et al., 2011; Hansen et al., 2011) has increased its access rate, reaching international and national targets (at least 65% of women undergoing the test in the last three years), at a country level. Major differences are still present: the lower-income population, as well as the population living in regions with less developed welfare systems, do not meet the target. The combination of the two conditions produces even more important inequalities, which, according to our data, could most probably be lowered through health promotion interventions aimed to explain the importance of these preventive services and to eliminate possible cultural and social barriers to their access. When one considers the interactions, another lesson to learn seems to appear: the same health promotion intervention can have different effects, directly on the outcome variable (in our case, the access to a preventive service) and indirectly on social determinants effects, when applied in different welfare systems. This should of course be confirmed by subsequent, less limited studies, and from our point of view, it is still an interesting hypothesis for researchers and policy makers to work on, particularly now when a fast moving evolution is taking place in western country welfare systems. Their typology can play a fundamental role—all other factors standing constant—in health promotion and health prevention activities, especially with regard to health inequalities.