


Abstract
Background: Most people prefer not to die in a hospital, and for those with palliative care needs, doing so may result in inappropriate care and poor outcomes. We examined place of death and factors associated with hospital death in a population eligible for palliative care. Methods: We used death certificate data to identify deaths from conditions eligible for palliative care and to examine place of death and demographic, socioeconomic and environmental characteristics associated with hospital death in Belgium in 2008. Results: Of all people eligible for palliative care (N = 44 229, i.e. 43.5% of all deaths), 51% died in hospital, 25% at home and 24% in long-term care settings. Of those officially living at home at the time of death, hospital death occurred in >60%; of those living in long-term care settings, this was 16%. Nine percent of those living at home alone at the time of death died in long-term care settings; of those living with others, this was 5%. In both, those living at home and those living in long-term care settings, hospital death was more likely in areas with higher availability of hospital beds and less likely in areas with higher availability of skilled nursing beds in long-term care settings. Conclusions: Hospital death is still common among those eligible for palliative care. The significant proportion of people living at home and dying in long-term care settings indicates the need for additional inpatient beds for terminal care in palliative care institutions.
Introduction
Within the context of patient-centred palliative care, the place of death is considered an indicator of the quality of end-of-life care, given the substantial proportion of people with chronic life-limiting conditions, who express a preference for dying in familiar surroundings.1,2 In many developed countries, a majority of terminally ill people die in hospital, however.2 Hospital death is often related to poorer care and poorer outcomes for patients and their relatives. People dying in hospitals were found to be less likely to receive emotional support and to be treated with respect and less satisfied with the levels of autonomy, physical care and emotional support they experience there; moreover, relatives were less likely to receive emotional support and useful information.3–5 In-hospital end-of-life care and death was shown to result in higher health care expenditure.6
Health care policies in many countries aim to reduce end-of-life hospital admissions and hospital mortality.7,8 Palliative care services were introduced >2 decades ago in Belgium and aimed at supporting usual caregivers in providing palliative care to patients in all care settings and preventing hospital death wherever possible.7 Family physicians are, in principle, responsible for the care of patients residing at home or in a long-term care setting; most Belgian long-term care settings have a mix of skilled nursing beds and residential beds without permanent skilled nursing. In or near hospitals, small-scale home-like inpatient palliative care units were established.7 In 2007, there were 379 beds in 51 palliative care units.
Although studying patterns of place of death can be valuable in informing end-of-life care strategies, there have been few nationwide studies of place of death in populations with conditions eligible for palliative care. Moreover, deaths of people living at home at the time of death and those living in long-term care settings were often not studied separately, though both populations differ significantly with respect to sociodemographic and clinical characteristics, care needs and the caring capacity of the health care setting where they reside.9,10
To date, the risk for those officially living at home of dying in a long-term care setting has not been studied in detail, though previous research indicates that this is a growing group despite long-term care settings not being intended to provide short-term care to the dying.11 Additionally, it has not been possible to study regional variations in place of death at a population level in Belgium, as recent death certificate data were unavailable for the Walloon Region.12 Belgium is divided into three regions, Flanders, Wallonia and Brussels-Capital Region (Brussels), with a large degree of autonomy in health care policy. Previous studies have shown substantial regional variation in care at the end of life in Belgium and in medical end-of-life decision-making between Dutch- and French-speaking physicians.13–15
The aim of this study is to examine place of death and factors relating to hospital death in all those who died from diseases eligible for palliative care in Belgium in 2008. The research questions are as follows. (i) What is the place of death of people with chronic life-limiting conditions who were either living at home or in long-term care settings? (ii) Which factors are associated with hospital deaths in those subpopulations?
Methods
Design
A study was conducted including data of all deaths in Belgium in 2008 of people aged ≥1 year who died from a chronic life-limiting condition eligible for palliative care using death certificate data. In Belgium, death certificates contain information about place of death, cause of death, demographic and socioeconomic characteristics of the deceased, marital status and living arrangement. Information about place and underlying cause of death is completed by a physician.16 The civil register of the municipality of the place of residence of the deceased completes the part of the death certificate about demographic and socioeconomic characteristics, including marital status and living arrangement (living at home alone, living at home with others or living in a long-term care setting). The underlying cause of death is coded according to the international classification of diseases (10th revision: ICD10) by special coding teams, and both medical information and other information are checked by government agencies.17
Population
The study population consists of people who died from a chronic life-limiting condition eligible for palliative care. This so-called minimum palliative subset is selected based on the ICD10 codes for underlying cause of death and includes deaths from cancer, heart failure, renal failure, liver failure, respiratory disease, neurodegenerative disease and HIV/AIDS.9
Variables
Dependent variable in our analysis is the place of death recoded into four categories: home, hospital (including inpatient palliative care units), long-term care setting and elsewhere. The independent variables are the underlying cause of death, age and sex, educational attainment, social support (living arrangement and marital status), urbanization level of the municipality of residence, region of residence (Flanders, Brussels and Walloon Region), the number of available hospital beds per 1000 inhabitants and available residential and skilled nursing beds in long-term care settings per 1000 inhabitants ≥65 years of age in the proximity of the deceased.
Data analysis
Associations between characteristics of the deceased and place of death were tested using χ2-tests. The multivariate association between those characteristics and place of death was examined using multinomial logistic regression analysis for those living at home (hospital vs. home vs. long-term care setting) and binomial logistic regression analysis for those residing in long-term care settings (hospital vs. long-term care setting). In both regression models, a forward stepwise selection method of variables was used.
Results
Of all deaths of people aged ≥1 year in 2008 (N = 101 685), 44 229 (43.5%) died of a disease eligible for palliative care (table 1). Of those, 62% died of cancer, 35% were between 75 and 84 years of age, 52% were men, 55% were living in a multiperson household, 46% were married, 61% were living in a strongly or very strongly urbanized area and 60% were living in Flanders.
Population characteristics and place of death of people eligible for palliative care who died in Belgium in 2008 (N = 44 229)
| Population characteristics | n (%)b | %c | P-value | |||
|---|---|---|---|---|---|---|
| Total | Hospital | Home | LTCa | Elsewhere | ||
| All deaths | 101 685 | 50.5 | 23.9 | 23.2 | 2.4 | |
| Deaths of people eligible for palliative care | 44 229 (43.5) | 50.8 | 24.8 | 23.8 | 0.6 | |
| Underlying cause of death | <0.001 | |||||
| Neoplasm | 27 601 (62.4) | 59.2 | 28.6 | 11.6 | 0.6 | |
| Heart failure | 4463 (10.1) | 34.2 | 23.8 | 41.1 | 1.0 | |
| Renal failure | 1161 (2.6) | 49.4 | 15.9 | 34.0 | 0.6 | |
| Liver failure | 75 (0.2) | 69.3 | 17.3 | 13.3 | 0.0 | |
| Respiratory disease | 4604 (10.4) | 53.5 | 21.5 | 24.3 | 0.8 | |
| Neurodegenerative disease | 6275 (14.2) | 23.3 | 13.2 | 62.9 | 0.6 | |
| AIDS | 50 (0.1) | 76.0 | 18.0 | 2.0 | 4.0 | |
| Age | <0.001 | |||||
| <65 years | 8174 (18.5) | 63.6 | 32.9 | 2.5 | 1.0 | |
| 65–74 years | 8304 (18.8) | 62.4 | 29.5 | 7.5 | 0.5 | |
| 75–84 years | 15 633 (35.3) | 51.3 | 24.1 | 24.1 | 0.6 | |
| 85+ years | 12 118 (27.4) | 33.5 | 17.0 | 48.9 | 0.5 | |
| Sex | <0.001 | |||||
| Male | 22 974 (51.9) | 55.6 | 28.4 | 15.3 | 0.7 | |
| Female | 21 255 (48.1) | 45.5 | 21.0 | 33.0 | 0.5 | |
| Educational attainment | <0.001 | |||||
| Other or unknown | 17 973 (40.6) | 47.7 | 25.8 | 26.0 | 0.6 | |
| No formal or elementary | 11 227 (25.4) | 47.9 | 20.9 | 30.4 | 0.8 | |
| Secondary | 12 841 (29.0) | 57.1 | 25.6 | 16.8 | 0.5 | |
| Higher | 2188 (4.9) | 53.8 | 32.6 | 12.8 | 0.8 | |
| Living arrangementd | <0.001 | |||||
| Single | 9343 (21.5) | 69.4 | 21.2 | 8.8 | 0.7 | |
| Multiperson household | 23 940 (55.0) | 58.4 | 35.8 | 5.3 | 0.5 | |
| LTC setting | 10 229 (23.5) | 16.2 | 2.1 | 80.9 | 0.8 | |
| Marital statusd | <0.001 | |||||
| Unmarried | 3582 (8.1) | 50.8 | 20.0 | 26.6 | 2.6 | |
| Married | 20 463 (46.3) | 56.4 | 33.3 | 9.9 | 0.4 | |
| Widowed | 16 625 (37.6) | 41.6 | 16.2 | 41.8 | 0.4 | |
| Divorced/separated | 3509 (7.9) | 61.1 | 21.5 | 16.6 | 0.8 | |
| Urbanization leveld | <0.001 | |||||
| Very strong/strong | 26 813 (60.6) | 54.0 | 21.4 | 24.1 | 0.5 | |
| Average/weak | 17 415 (39.4) | 45.8 | 30.1 | 23.3 | 0.8 | |
| Region of residence | <0.001 | |||||
| Flanders | 26 339 (59.6) | 50.7 | 24.7 | 24.0 | 0.5 | |
| Brussels capital region | 3698 (8.4) | 58.1 | 16.2 | 25.0 | 0.6 | |
| Walloon region | 14 192 (32.1) | 49.0 | 27.2 | 23.0 | 0.8 | |
| Hospital beds/1000d | <0.001 | |||||
| ≤Median | 22 667 (51.3) | 49.0 | 26.5 | 23.7 | 0.8 | |
| >Median | 21 561 (48.7) | 52.6 | 23.1 | 23.8 | 0.5 | |
| Residential beds in LTC/1000 > 65 yearsd | <0.001 | |||||
| ≤Median | 24 117 (54.5) | 51.1 | 25.2 | 23.2 | 0.5 | |
| >Median | 20 111 (45.5) | 50.3 | 24.4 | 24.4 | 0.8 | |
| Nursing beds in LTC/1000 > 65 yearsd | <0.001 | |||||
| ≤Median | 22 084 (49.9) | 50.7 | 27.1 | 21.4 | 0.7 | |
| >Median | 22 144 (50.1) | 50.8 | 22.5 | 26.1 | 0.6 | |
a: LTC: long-term care setting.
b: Presented percentages are column percentages.
c: Presented percentages are row percentages.
d: Missing values: living arrangement n = 717 (1.6%); marital status n = 50 (0.1%); urbanization level, hospital beds and beds in LTC n = 1 (0.0%).
Fifty-one per cent died in hospitals, 25% at home and 24% in long-term care settings. Of those living in long-term care settings, 81% died there and 16% died in hospitals. Of those living at home alone, 21% died at home, 69% in hospitals and 9% in long-term care settings; of those living at home together with others, 36% died at home, 58% in hospitals and 5% in long-term care settings.
Hospital death was significantly more common in people with cancer or liver failure, younger people, males, those living at home alone, divorced or separated, living in strongly urbanized places, living in Brussels and living in areas with higher availability of hospital beds. Home death was significantly more common in cancer patients, those aged <75 years, males, with higher education, living in a multiperson household, married, living in average or weakly urbanized areas, in the Walloon Region and in areas with lower availability of hospital beds or skilled nursing beds in long-term care settings. Death in long-term care settings was significantly more common in people who died from a neurodegenerative disease or heart failure, aged ≥85, female, with only elementary or no formal education, widowed and living in areas with higher availability of skilled nursing beds in long-term care settings.
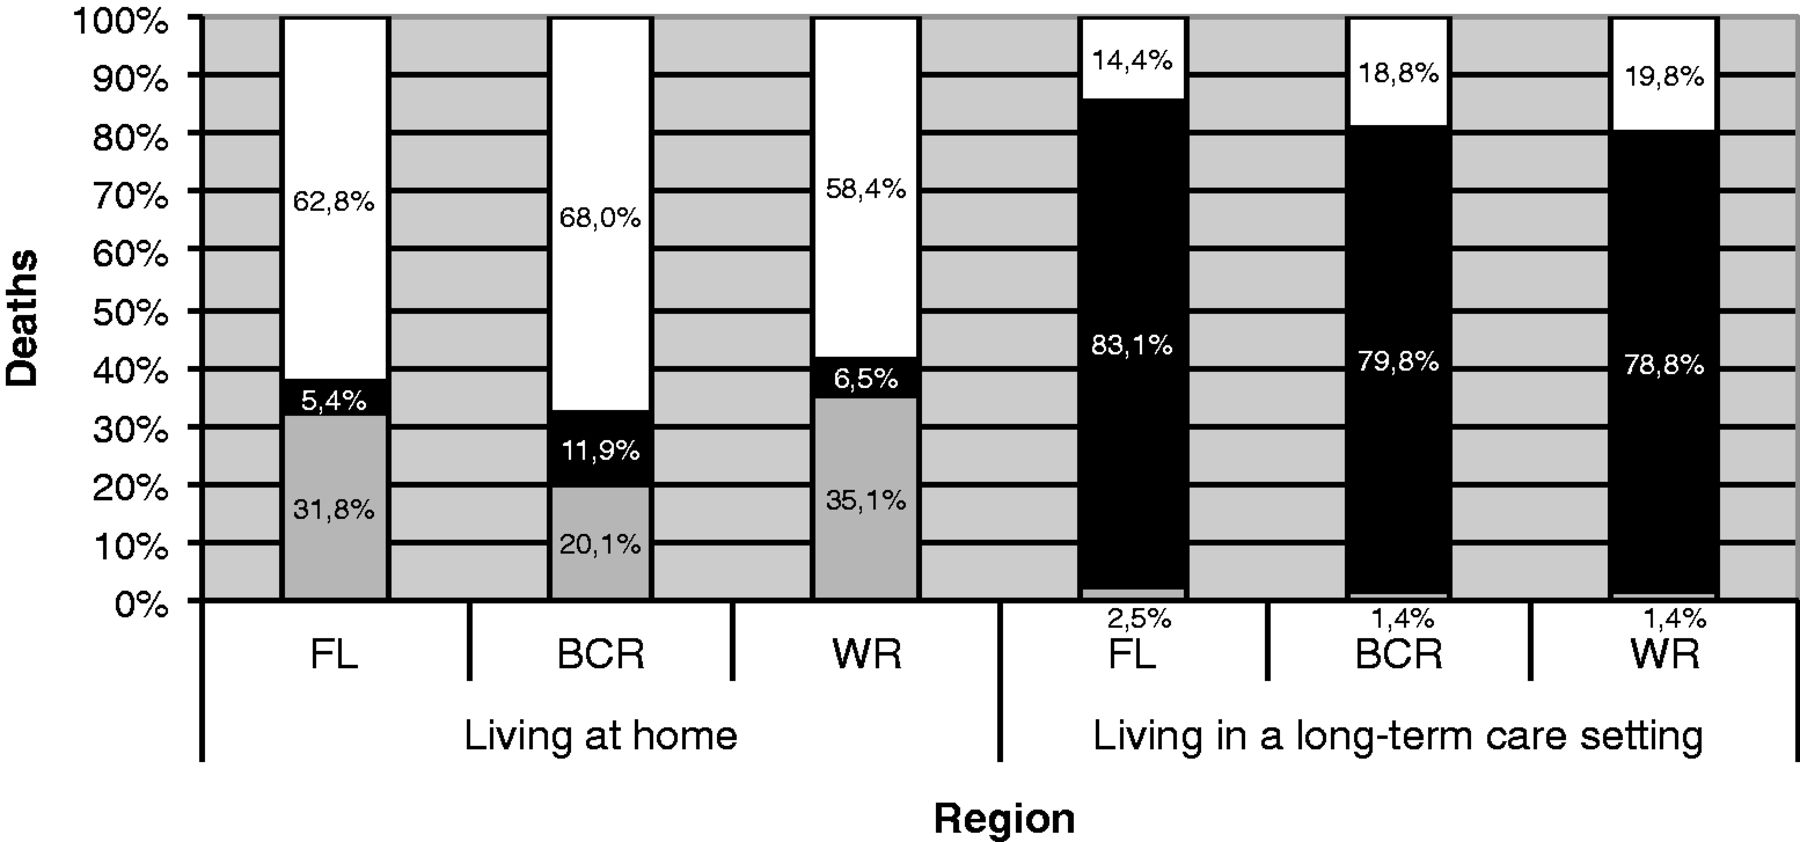
Of those living at home, residents of the Walloon Region were most likely to die at home and least likely to die in hospital, whereas the residents of Brussels were least likely to die at home and most likely to die in hospital or in a long-term care setting (P < 0.001, figure 1). Of those residing in long-term care settings, hospital death was least likely in Flanders (P < 0.001).
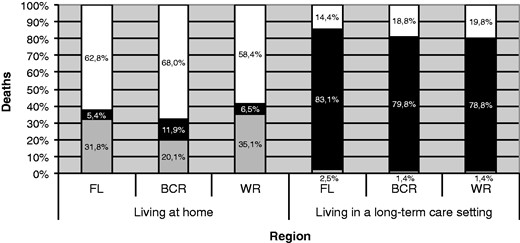
Place of death by living arrangement and region of residence in Belgium (2008). P-value of χ2-test for association between region of residence and place of death: P < 0.001 for those living at home; P < 0.001 for those living in care homes. FL: Flanders; BCR: Brussels Capital Region; WR: Walloon Region. White colour: deaths in hospital, Black colour: deaths in long-term care setting, Grey colour: deaths at home
Controlled for other factors considered in this study, for people still living at home at the time of death, hospital death was significantly more likely in those who died from cancer or organ failure compared with neurodegenerative disease, who were ≤85 years of age, had less than higher educational attainment, living alone, in a very strongly or strongly urbanized area and in areas with more available hospital beds or fewer available skilled nursing beds in long-term care settings (table 2). Those living in Brussels had a significantly higher chance of dying in hospital than those in Flanders, who, in turn, were significantly more likely to die in hospital than those in the Walloon Region. Death in a long-term care setting in individuals still living at home at the time of death was significantly more likely in those with a neurodegenerative disease, who were ≥85 years of age, female, living alone, living in a strongly urbanized area, living in Brussels or living in areas with, on average, more available hospital beds. In patients living in a long-term care setting at the time of death, hospital death was significantly more likely in those who died from cancer or organ failure, who were younger, males, with other or unknown educational attainment, living in strongly urbanized places and living in areas with more available hospital beds or fewer skilled nursing beds in long-term care settings. Residents of long-term care settings in Flanders had significantly lower chances of dying in hospital and higher chances of dying in the long-term care setting of residence than those in the Brussels or Walloon Region.
Factors associated with place of death of people eligible for palliative care who died in Belgium in 2008
| People living at home (N = 33 065) | People living in LTCa (age ≥65) (N = 9934) | ||
|---|---|---|---|
| Hospital vs. home deathb,c,f | LTC vs. home deathb,c,f | Hospital vs. LTCc,d,f | |
| AOR (95% CI)e | |||
| Underlying cause of death (vs. neurodegenerative disease) | |||
| Cancer | 1.29 (1.17–1.42) | 0.13 (0.11–0.15) | 2.04 (1.76–2.36) |
| Organ failure | 1.18 (1.06–1.31) | 0.25 (0.22–0.29) | 1.99 (1.73–2.31) |
| Age (vs. 85+) | |||
| <65 years | 1.20 (1.11–1.30) | 0.10 (0.07–0.13) | |
| 65–74 years | 1.31 (1.21–1.42) | 0.27 (0.22–0.32) | 2.57 (2.12–3.11) |
| 75–84 years | 1.24 (1.15–1.33) | 0.72 (0.64–0.80) | 1.44 (1.28–1.63) |
| Sex (vs. Female) | |||
| Male | 1.02 (0.97–10.7) | 0.76 (0.68–0.84) | 1.28 (1.14–1.44) |
| Educational attainment (vs. higher education) | |||
| Other or unknown | 1.02 (0.92–1.13) | 1.34 (1.03–1.73) | 0.71 (0.50–0.99) |
| No formal or elementary | 1.41 (1.26–1.58) | 1.18 (0.90–1.56) | 0.99 (0.70–1.39) |
| Secondary | 1.35 (1.21–1.50) | 1.27 (0.97–1.67) | 0.95 (0.68–1.35) |
| Living arrangement (vs. multiperson household) | g | ||
| Single | 1.97 (1.85–2.09) | 2.09 (1.87–2.34) | |
| Urbanization level (vs. average/weak/rural) | |||
| Very strong/strong | 1.54 (1.46–1.62) | 1.61 (1.44–1.80) | 1.19 (1.06–1.34) |
| Region of residence (vs. Walloon region) | |||
| Flanders | 1.12 (1.06–1.18) | 0.87 (0.77–0.98) | 0.68 (0.60–0.77) |
| Brussels capital region | 1.55 (1.38–1.73) | 1.72 (1.41–2.09) | 1.01 (0.79–1.29) |
| Healthcare resources | |||
| Hospital beds/1000 | 1.10 (1.07–1.13) | 1.19 (1.11–1.27) | 1.09 (1.02–1.17) |
| Nursing beds in LTC setting/1000 > 65 years | 0.993 (0.989–0.996) | 1.00 (0.99–1.01) | 0.99 (0.98–0.997) |
| Nagelkerke R2 | 0.16 | 0.06 | |
a: LTC: long-term care setting.
b: Variable ‘Marital status’ was not introduced in the model for reasons of multicollinearity with ‘Living arrangement’.
c: Variable ‘Residential beds in LTC/1000 > 65 years was introduced in the model but not withheld in the regression equation with the stepwise selection approach of variables.
d: Variable ‘Marital status’ was introduced in the model but not withheld in the regression equation with the stepwise selection approach of variables.
e: AOR: Adjusted odds ratio.
f: Parameter in italic: regression coefficient not significant at 5% significance level.
g: Variable not introduced in the model because living situation is a constant (i.e. long-term care setting) for all deceased residents.
Discussion
Of those who died in Belgium from a disease eligible for palliative care in 2008, half died in hospitals and nearly a quarter at home and in long-term care settings. Hospital was the place of death for nearly 70% of those living at home alone at the time of death and nearly 60% of those living at home with others. Of those living at home alone, 9% died in a long-term care setting. Of those living in long-term care settings, 16% died in hospital. Hospital death was independently related to the underlying cause of death, personal characteristics of the deceased, environmental characteristics and health care system factors. Regional differences in place of death in Belgium were significant.
In this study, all deaths considered eligible for palliative care, and not just a sample, were included, resulting in a population distribution of place of death and accurate and robust estimations of factors related to place of death. These factors were studied separately for those living at home at the time of death and those living in long-term care settings. In those living at home, the chances of dying in a long-term care setting were examined for the first time. This study is also the first to examine place of death for the whole of Belgium and to study variation in place of death between Flanders, the Walloon Region and Brussels. Unfortunately, deaths in inpatient palliative care units, small-scale separate units usually on a hospital campus, are recorded as deaths in hospital on Belgian death certificates. Our finding that cancer is a risk factor for dying in hospital for those living at home should, therefore, be interpreted with caution, as it has been shown that palliative care units serve a large proportion of cancer patients. Death certificate data have certain disadvantages. Some causes of death are not always registered accurately, as are certain sociodemographic characteristics. Death certificate data also provide no information on some factors for which there is evidence that they affect place of death such as the ethnicity of the deceased18; the higher risk of hospital death in Brussels may possibly be related to the higher proportion of people from ethnic minorities living there. Given the specificity of the Belgian health care system, our findings may not be generalizable to other countries.
In Belgium, the preference for hospital death was shown to be only 4.7% in a population of terminally ill as reported by their family physicians in a previous study.19 We found that hospital was the place of death of more than half of those eligible for palliative care, nearly two-thirds of those living at home at the time of death and 16% of those living in long-term care settings died in hospitals. It appears that the Belgian health care system fails to prevent hospital death in a large proportion of those who would qualify for palliative care; this is probably related to the insufficient or late orientation of care towards palliation and the late and inadequate involvement of specialist palliative care.20
In line with previous research, higher availability of hospital beds in the proximity was related to a higher risk of hospital death,18,21,22 both for those living at home and in long-term care settings, indicating that beds in acute hospital settings still function as the most easily accessible option in acute situations such as sudden worsening of symptoms or in cases where family carers cannot cope any longer. This also suggests that the Belgian health care system does not provide sufficient support to primary carers of the terminally ill in their familiar environment. Additionally, more inpatient options, such as inpatient palliative care units, for the terminally ill may be required.. It is not clear, however, why the risk of hospital death is also higher for residents of long-term care settings in regions with more hospital beds, given the permanent availability of skilled nursing care in most long-term care facilities. Family physicians, the principal caregivers in Belgian long-term care facilities, seem more likely to hospitalize residential patients, possibly under pressure from relatives, where there are more hospital beds in the neighbourhood. Unlike in other health care systems (e.g. The Netherlands), Belgian family physicians do not, in practice, have a strong gatekeeper role in hospital admissions.
Greater numbers of skilled nursing beds in long-term care settings in the proximity of the deceased, however, were found to reduce the risk of dying in hospital, both for those living in long-term care settings and those at home.11 It is clear that for the terminally ill already resident in a long-term care setting, a higher level of skilled nursing capacity is a factor in decreasing the risk of dying in hospital. That this was also true for those living at home may be surprising. We also found that a larger-than-anticipated proportion of people officially living at home at the time of death eventually died in a long-term care setting; in Brussels, this was nearly 12%. Apparently, a substantial proportion of terminally ill people living at home are admitted to long-term care settings at the very end of life, some of them possibly after being discharged from hospital. Seemingly, long-term care settings play a significant role in terminal care of people recently living at home; we hypothesize that under pressure of palliative care needs and a strong preference not to die in hospital, and because of the inadequacy of end-of-life care provision at home and the shortage of beds in inpatient palliative care units, long-term care settings are, intentionally or not, to some extent fulfilling the role of end-of-life care providers.
We found important regional differences within Belgium. The risk of dying in an institution, either hospital or a long-term-care setting, was significantly higher for residents of Brussels-Capital Region.23–25 Presumably, this can be partly explained by lower primary health care use, housing conditions less suited to the provision of terminal care and comparative lack of social networks outside the family compared with the rest of Belgium.23 In those living at home, we found a higher hospital death risk in Flanders compared with the Walloon Region; for those in long-term-care settings, the risk was lower in Flanders than in the Walloon Region. The first contrast correlates with previous research findings,26 and may be explained by regional cultural differences with respect to caring for a terminally ill relative at home. The higher hospital death risk in long-term care residents in the Walloon Region and Brussels is probably related to the higher proportions of privately owned and smaller long-term care facilities compared with Flanders27; private ownership status and smaller size were found previously to be related to lower quality of care in long-term care facilities and higher levels of in-hospital deaths of residents.28,29
Vulnerable populations living at home at the time of death were more likely to die in institutional settings, as has been shown before.18,30 Those with lower or unknown degrees of educational attainment were more likely to die in hospital or in long-term care settings. Since what little evidence there is indicating that those with lower educational attainment are less likely to prefer home death is conflicting,2,31,32 social inequity in dying in the place of preference cannot be ruled out.30 Similarly, those living alone were more likely to die either in hospitals or in long-term care settings. Although there is evidence that the widowed are more likely to prefer terminal care in an institutional setting,33 our finding may indicate that the health care system fails to provide adequate care to single people who want to be cared for at home until the end. Also, residents of strongly or very strongly urbanized areas, both living at home or in long-term care settings, were less likely to die in their familiar surroundings. The higher hospital death risk in those living at home may be related to the lower availability of social networks outside the family or the underuse of primary healthcare, which is considered to play a pivotal role in providing end-of-life care.23–25 The finding that long-term care residents in urbanized areas were also more likely to die in hospital may be related to poorer environmental quality and staffing issues, such as staff shortages and turnover, which may compromise quality of end-of-life care.34
In the Belgian health care system, hospital death is still common in people residing at home, and significantly so among those living in long-term care settings. Public health policies directed at strengthening the role of primary caregivers in end-of-life care and providing more capacity in new palliative care institutions or existing palliative care units may change this situation. Long-term care settings need to prepare to meet the needs of a growing palliative population. Policies targeting vulnerable groups are needed to avoid inequity.
Acknowledgements
The authors acknowledge the Flemish agency for care and health, the Brussels health and social observatory and the French Community of Belgium to provide the death certificate data. They acknowledge Jane Ruthven for manuscript editing. This work should be attributed to: End-of-Life Care Research Group, Vrije Universiteit Brussel and Ghent University, Brussels, Belgium.
Funding
This work was supported by the Vrije Universiteit Brussel. Joachim Cohen is a postdoctoral fellow of the Research Foundation Flanders. The funders had no role in study design, data collection and analysis, decision to publish or preparation of the manuscript.
Conflicts of interest: None declared.
Of all people eligible for palliative care who died in Belgium in 2008, 51% died in hospital, 25% at home and 24% in long-term care settings.
Hospital death was >60% in those living at home at the time of death and 16% in those residing in long-term care settings.
Nine percent of those living at home alone died in long-term care settings; of those living with others this was 5%.
Hospital death risk increased with higher availability of hospital beds, and decreased with higher availability of skilled nursing beds in long-term care settings in the proximity of the deceased.
More beds in existing palliative care units or additional palliative care institutions are needed to reduce death in hospital settings.

Comments