


Abstract
Only 40–50% of households in the United States are currently disaster prepared. In this intervention study, respondent-driven sampling was used to select a sample (n = 187) of low income, Latino residents of Los Angeles County, randomly assigned into two treatment conditions: (i) household preparedness education received through ‘promotora’ (community health worker) led small group meetings, and (ii) household preparedness education received through print media. Weinstein’s Precaution Adoption Process, a stage model appropriate for risk communication guided the intervention. Outcomes are conceptualized as stages of decision making linked to having disaster supplies and creating a family communication plan. Quantitative results showed a significant shift over time from awareness to action and maintenance stages for disaster communication plans and supplies in both study arms; however, the shift in stage for a communication plan for those in the ‘platica’ study arm was (P < 0.0001) than for those in the media arm. For changes in stage linked to disaster supplies, people in both media and ‘platica’ study arms improved at the same rate. Simple media-based communications may be sufficient to encourage disadvantaged households to obtain disaster supplies; however, adoption of the more complex disaster family communication requires interpersonal education.
Introduction
The threat of disasters has been an area of increased research and practice activity in public health over the past decade, as high profile disasters have brought disaster-related health impacts into view especially for vulnerable populations. The study of disasters’ impacts on population health is not new [1, 2]. Studies have shown that a more prepared public leads to faster and more effective recovery and response efforts after disasters occur [2] and prepared, educated and empowered populations assure more resilient communities before, during and after disasters [3]. Moreover, there is now greater awareness of how disasters can exacerbate social disparities. Minority ethnic communities are more vulnerable to public health disasters [4–6] because of economic disadvantages, cultural differences and limited resources.
At the household level, disaster preparedness, called hazards adjustments in the disaster literature, can also be defined as a form of individual health behavior that includes having sufficient disaster supplies, having a family communication plan and mitigating household hazards such as securing furniture or implementing structural enhancements to buildings so they are safer [7–9]. These elements align with basic disaster preparedness principles that include identifying hazards, developing strategies for disaster response and having sufficient resources to buffer the impact of disasters once they occur [2].
While disaster preparedness may differ in regards to geographic and community vulnerabilities to manmade or natural disaster [10], since the terrorist attacks of 11 September 2001, federal, state and local governments have mainly adhered to an all hazards approach, with numerous campaigns and initiatives by public health, emergency preparedness and voluntary agencies targeting improved disaster preparedness at the household level [11, 12].
Descriptive surveys at the national and local levels show that a minority of Americans is disaster prepared, and the public has not changed their level of preparedness dramatically despite Hurricane Katrina in 2005 and other highly publicized disasters [13–16]. A survey by the American Public Health Association in 2007 suggests that 40% of the public has taken steps in the past to prepare for emergencies, but many admit they have not maintained their preparedness plan or supplies [16]. Other more recent national studies confirm these trends [12, 17].
Studies conducted about individual household-level preparedness in California suggest that 6 out of 10 residents have disaster supplies ([18] based on ethnicity 63% of whites and 55% of Latinos have some supplies [19]). Fewer than half of people surveyed had a plan for family communication or disaster response with 51% of whites and 37% of Latinos saying] they had a plan, with age, income and education all positively correlated with being prepared [19]. A Los Angeles survey, reported that 48% of respondents had adequate disaster supplies and 40% had a family communication plan [20]. Rates were lower among ethnic minority groups including Latinos, persons with lower income and chronic illness. However even these types of overall statistics tend to be somewhat misleading as often people have some but not all supplies, and having a disaster communication plan is even less likely than having supplies [15].
It has been proposed that the capacity to hear and act on warnings and messages about risk is correlated with social factors that describe location in the larger society, personal experience and observations of what other group’s experience, thus helping explain why risk factors of minority or lower socioeconomic status exacerbate social disparities in disaster preparedness [4, 5, 7, 21–24]. For Latino populations studies show inconsistent results with some studies finding that Latinos who have experienced disasters are more prepared [25], whereas other studies have documented a lack of preparedness among Latinos living in the United States [26–28]. One viable explanation for lower compliance with disaster messages and behaviors is linked to cultural and linguistic isolation among Latinos with limited English proficiency [29], and it is known that consistent messaging over time is a key in creating a culture of disaster preparedness with more socially vulnerable groups less likely to hear or respond to those messages [1, 30].
Despite numerous mass media campaigns, there are few documented community-based interventions that demonstrate successful behavior change to increase household disaster preparedness. Specifically, the many mass media and internet-based household disaster preparedness campaigns conducted since 11 September 2001 have failed to produce a literature evaluating their effectiveness with specific target audiences. Moreover, a recent review of 301 websites that promote disaster preparedness behaviors suggests that many of the campaigns seem to be focused on populations with more resources, not disadvantaged households [31].
Despite lack of clear results for changing household preparedness behaviors based on broad directives, a focused and evaluated intervention for disaster preparedness was conducted in Southern California among homeowners in a suburban community in the late 1980s [32]. Using persuasive communications and a quasi-experimental design based on Rogers Protection Motivation Theory [33, 34], this study showed that increasing risk perceptions and positive attitudes about disaster preparedness increased preparedness behaviors among community participants. Two decades later there has been but a handful of small local localized studies to improve disaster preparedness conducted among minority communities. One study successfully used Community-Based Participatory Research (CPBR) techniques with ‘promotoras’ to enhance Latino community resilience in San Bernardino and Riverside counties in California [35]. Another study reported a similar approach among rural First Nations peoples in Canada [36]. The study to be reported in this article was a similar small scale evidence-based approach to promote disaster preparedness among low-income Latino families living in urban neighborhoods in Los Angeles. This theoretically guided community-based intervention used interpersonal and small media methods to increase levels of disaster preparedness at the household level. Study research questions asks whether a stages of changes model, in this case the Precaution Adoption Process [37, 38], measures effects of an intervention that uses targeted messages and methods, what level of treatment intensity is associated with those effects, and finally what predicts changes in stages of decision making for disaster preparedness among low-income Latinos.
Theoretical considerations
Stage theories of behavior change suggest that people are at different levels of awareness and motivation regarding their health conditions and behaviors. Thus outreach efforts must target messages to stages, and evaluation must consider how people pass through these different stages as they change beliefs and behaviors [39]. One variant of this type of theory, the Precaution Adoption Process [37, 38, 40] argues that people pass through seven distinct stages of decision making for health behavior including being unaware, becoming engaged, starting to make a decision, deciding to act, deciding not to act, acting and finally maintaining the behavior, each stage representing different patterns of behavior, beliefs and experience. Of importance are understanding transitions between stages, as this theory acknowledges that behavior change is complex as it is embedded within different types of social and communication environments.
Despite numerous social marketing campaigns using the mass media to promote disaster preparedness over the past decade, these efforts have not been very effective in improving preparedness at the population level [41]. Hence this study used a more focused community-based approach using stages of change theory, small media or narrowcast methods, along and community health workers (‘promotoras’), all methods used successfully in other behavior changes initiatives. We adapted the Precaution Adoption Process to categorize study participants as regards to their readiness to change. Use of interpersonal educational methods and targeted, culturally competent media materials, we addressed study research questions of showing how these methods are effective in changing stages of decision making among respondents linked to having a family communication plan and disaster supplies.
Method
Intervention
The study was conducted in Los Angeles from 2006 to 2007 in a low-income neighborhood with a high percentage of Latino households. Study objectives were to provide health education and training to encourage household members to learn about disasters and disaster preparedness, increase disaster supplies at the level of the household, and create a disaster communication plan for their families. Extensive formative research suggested that these populations were often misinformed about what essential disaster supplies were, how much to have on hand and what a family communication plan [28, 42, 43] comprised.
We used a randomized, longitudinal cohort design with two groups to test two different experimental conditions, a high-intensity group and a low-intensity group. The high-intensity group participated in 1 h face-to-face discussions about household-level disaster preparedness called ‘platicas’ (or discussion group) led by promotoras de salud, who are trained lay community health workers. Participants in these groups both received materials and discussed and practiced carrying out individual household preparedness actions over a four week period, meeting once a week in groups. The low-intensity group received mailed, culturally competent, print materials consisting of a pamphlet, a laminated shopping card, and six preprinted cards for disaster communication planning with instructions on how to fill it out. These mailings were repeated twice. Throughout the intervention activities were assessed for quality and fidelity to intervention objectives.
For this intervention, community disaster preparedness education and materials development were conducted by staff members of the Coalition for Community Health, a community-based organization that works in the neighborhoods where we were recruiting participants (see below). All of the staff was certified promotoras de salud, bilingual in English and Spanish. For this project they were trained by the American Red Cross over a four hour period on disaster preparation and disaster education. Materials and messages developed reflect principles learned as well as key messages about preparedness that the team wished to prioritize. Materials were in both Spanish and English, and consisted of basic instructions for household preparedness.
Sample
Participants were recruited using respondent-driven sampling (RDS), a peer recruitment sampling strategy to locate eligible respondents. RDS was developed to overcome the biases inherent in chain referral sampling, as well as recruitment of hard to reach respondents such as intravenous drug users [44, 45].
RDS sampling begins with an initial sample of people, sometimes called ‘seeds’, who represent the types of people to be recruited into the study sample. As adapted for this study, the first stage of the RDS sample survey consisted of identifying an initial group of community dwelling Latino immigrant adults who the ‘promotoras’ perceived as being socially extroverted. People could be seeds if they were at least 18 years old, had immigrated from South or Central America, and lived in Los Angeles County. Seven such individuals accepted the role of being ‘seeds’ for the survey and then worked to help identify the whole sample. These seven seeds moreover came from a diverse set of countries, namely Mexico, Guatemala, El Salvador and Honduras.
Recruitment and data collection
People identified as seeds filled out baseline survey questionnaires and then were trained to recruit others into the study. Seeds were given sets of coupons that had study information and unique codes that were given out to potential respondents. These potential respondents then called study numbers on the coupons to be assessed for study eligibility. Seeds were given a 25-dollar incentive for each eligible participant they recruited. Respondents thus recruited were eligible for the study if they self-identified as Latino, were at least 18 years old, were immigrants, and resided in Los Angeles County. Only one adult per household was eligible, and initial sample of 242 respondents was recruited.
Once recruited into the study, each participant was assigned to a block of 6–10 people based on their zip code, and a random number generated by computer was used to determine which arm of the trial they were randomly assigned to: the high or low-intensity conditions. Respondents participated in two telephone surveys, one at baseline and one three months after the intervention. Interviews took 45 min to complete and participants received $25 for each survey they completed. Based on these results, data are reported for the 187 individuals who completed both surveys with 87 in the high intensity ‘platica’ condition and 100 in the low-intensity media condition.
Dependent measures
For this study, we defined participants’ stage of decision making about household disaster preparedness based on respondents’ answers to three questions used for assessing the Precaution Adoption Process [38, 40]. A seven-stage changes of change schema was constructed based on respondents’ answers to three questions: (i) ‘Have you heard about a (family communications plans/or disaster kit?’) coded yes or no; (ii) Does your family have a (family communication plan/disaster kit)? coded yes or no; and (iii) Which of the following best describes your thoughts about a (family communication plan/disaster kit?), with 4 response categories including ‘I’ve never thought about it, I am undecided, I have decided I don’t want it and I have decided I do want it. Based on sets of answers respondents were initially categorized into seven stages of decision making outlined in Table I. However, based on findings that no respondents were in stage 4 (decided they do not want a communication plan or a disaster kit) and because of the small sample size, analysis to be reported here was based on a truncated version of this model with four stages: undecided (stages 1–4), decided but not yet acted (stage 5), acting (stage 6) and maintaining the behavior (stage 7).
Stages of decision making from the Precaution Adoption Process
| Hear | Have | Think | Stages definitiona | |
|---|---|---|---|---|
| Original seven stages | ||||
| Stage 1 | No | – | – | Unaware of preparedness |
| Stage 2 | Yes | No | Heard about but never thought about having one | Aware but not engaged |
| Stage 3 | Yes | No | Try to decide if should have one | Engaged and trying to decide what to do |
| Stage 4 | Yes | No | Decided don't want to have one | Decided not to act |
| Stage 5 | Yes | No | Decided want to have one but not started yet | Decided to act but not yet acted |
| Stage 6 | Yes | No | Started to make one but not completed | Acting |
| Stage 7 | Yes | Yes | Have made one | Maintaining the new behavior |
| New four stages | ||||
| Stages 1–4 | No/Yes | No | Unaware through engaged but undecided | Have not yet decided to act |
| Stage 5 | Yes | No | Decided want to have one but not started yet | Decided to act but not yet acted |
| Stage 6 | Yes | No | Started to make one but not completed | Acting |
| Stage 7 | Yes | Yes | Have made one | Maintaining the new behavior |
aThe definition was applied to communication plan and disaster supplies kit, respectively.
Initial data analyses used categorically scored measures of stage of decision making about household disaster preparedness. To use our stages of decision making measures as dependent variables for multivariate models we generated two variables (one for the communication plan and one for the supplies kit) that indicate respondents’ change among the four stages of preparedness between the pre-intervention and the post-intervention assessment. The two change variables were constructed by subtracting the pre-intervention score from the post-intervention score per each stage. A positive integer means a subject was assessed to be in a higher-order preparedness stage post-intervention, and vice versa. These measures were normally distributed.
Independent measures
In addition to treatment condition which was dummy coded, independent measures used in this study include socio-demographic measures of age, gender, marital status, children under 17 in the household, employment status, and household status (rent or own), country of origin, educational level, number of years in the United States and annual household income. By definition all respondents were Latino. Other measures included in this analysis were perceived health status, disaster experience.
Additionally, we generated four scales from respondents’ answers to questions indicating participants’ attitudes and beliefs about disaster preparedness related behaviors. These were (i) perceived self-efficacy (five questions) that asked where respondents could make the right decisions about household disaster preparedness, (ii) perceived benefits (five questions) that asked whether having disaster preparedness items was beneficial, (iii) perceived barriers (five questions) that asked about common reasons people do not prepare such as time money and effort and (iv) perceived responsibility (five questions) that asked about the locus of responsibility for disaster preparedness including government, voluntary organizations and household members themselves. The original answers to these questions were Likert coded as: 1 = strongly agree, 2 = mildly agree, 3 = neither agree nor disagree, 4 = mildly disagree, 5 = strongly disagree. Measures were also assessed for internal consistency reliability, or the pattern of inter-item correlations using Cronbach’s alpha [46]. For these four scales alphas ranged 0.70 to 0.88, all within the range of acceptability for use: for perceived self-efficacy (α = 0.80), for perceived benefits (α = 0.88), for perceived barriers (α = 0.70), and for perceived responsibility (α = 0.81).
Analysis
Univariate and bivariate statistics for categorical variables comprised Pearson’s chi-squared test or Fisher’s exact test were used to address study validity issues including assessing whether study arms were comparable on stages of decision making at baseline, as well as comparing subjects who completed the study with those lost to follow up. These types of statistics were also used to address research questions about whether there was a significant shift in stages of decision making over time moving from cognitive to action steps, and whether participants in the high-intensity intervention showed more change in stage of decision making towards actions of creating a family communication plan and collecting items for a disaster supply kit than participants in the low-intensity intervention. These sets of analyses are linked to the first two research questions which ask about the utility of using measures based on the Precaution Adoption Process as well as differential impact of a high and a low-intensity study arm.
Subsequently, we also conducted bivariate correlation analysis and linear regression analysis using the two continuous-scale variables that were generated from before and after scores on stages of decision making. These variables were used as used as dependent variables to assess what factors predict changes in stages of preparedness for having a (i) communication plan and (ii) supplies kit. Independent variables include study conditions, socio-demographic variables, disaster experience and the four multi item attitudinal scales. This set of analysis is linked to the third research question which addresses the relative importance of treatment condition, socio-demographic characteristics, disaster experience or attitudes towards disaster preparedness in predicting changes in stages of decision making.
It should be noted that RDS sampling techniques allow population inferences based on differential recruitments across groups and participant’s network size with population estimates calculated using RDS Analysis Tool (RDSAT). All tests were two sided, and all analyses were conducted using RDSAT and STATA.
Findings
The final sample of 187 people who completed both pre-test and post-test surveys comprised slightly more women (55%) had a mean age of 37 years, three quarters had a high school education or less, three quarters had an annual income of $20 000 or less, 64% were born in Mexico, and almost 30% of this group had been in the United States less than 10 years, these descriptive results reported in a prior publication [42]. Compared with a Los Angeles County survey conducted in 2004, participants in this study are poorer, and have spent less time in the United States than a representative population from a population-based survey conducted in Los Angeles prior to this study [25]. There are no significant differences between those who remained in the study and those who dropped out and at baseline there are no differences between the two randomly assigned treatment groups, ‘media’ and ‘platica’, on any of the socio-demographic variables suggesting random assignment strategy into two study arms was successful.
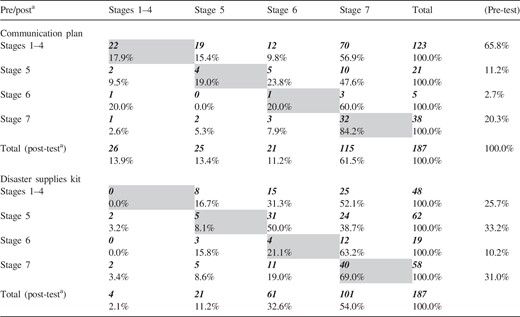
Table II presents an overview of stages of change in decision making for the entire sample, from pre-test to post-test. Specifically coefficients above the diagonal represent change from pre-test to post-test that support an increase in stage, while those below the diagonal indicate the opposite trajectory and coefficients on the diagonal are scores that do not change from pre-test to post-test. For the family communication plan, at pre-test 65.8% of respondents did not make a decision, while 20.3% were already in the maintenance stage, while at post-test the majority of respondents shifted and were in decision making(13.4%) action (11.2%) or maintenance stages (61.5%). For disaster supplies there was a similar shift, even though baseline preparedness was higher. Specifically at pre-test 25.7% are in the undecided stage, while at post-test 32.6% took action and 54% are in the maintenance stage. Using Pearson’s Chi-squared test we compared observed and expected frequencies to assess shifts over time for the whole sample in stages decision making for the communication plan and the disaster kit. Shifts are significant for both types decision making. For the communication plan (χ2 = 133.788, P < 0.000) and for the disaster supplies kit (χ2 = 99.698, P < 0.000).
Changes in stage of decision making from pre-test to post-test (n = 187)
 |
|
aA chi-squared test was used to assess changes over time (pre-test to post-test) in stages of decision making for the communication plan (χ2 = 133.788, P < 0.000)while for the disaster supplies kit (χ2 = 99.698, P < 0.000).
Changes in stage of decision making from pre-test to post-test (n = 187)
|
|
aA chi-squared test was used to assess changes over time (pre-test to post-test) in stages of decision making for the communication plan (χ2 = 133.788, P < 0.000)while for the disaster supplies kit (χ2 = 99.698, P < 0.000).
Exploring more completely shifts in stages of decision making between and within study arms in Tables III and IV, the sample was split into the two treatment conditions, ‘platicas’ and media to compare the differential impact of stage of decision making change between groups at both baseline and follow up and within groups considered over time. Specifically we conducted a bivariate analysis using Pearson’s chi-squared as well as Fisher’s exact tests for between groups analysis that compares distribution of Pre-test and Post test scores between study arms first at pre-intervention (Columns 1 and 2) then at post intervention (Columns 3 and 4). Within groups analysis compares stages of change distributions from pre-test to post-test within each study arm (Columns 1 and 3 then 2 and 4). As can be seen, at pre-test there are no significant differences between ‘platica’ and media groups in regards to stages of decision making for having a communication plan. However, at post-test the ‘platica’ groups show a distinct advantage in regards to shift in stage of decision making.
Stages of decision making by intervention condition from pre-test to post-test (between groups and within groups analysis)
| Pre-intervention | Post-intervention | |||||
|---|---|---|---|---|---|---|
| Total n (%) | Media | Platica | Between | Media | Platica | Between groups |
| 100 (%) | 87 (%) | groups | 100 (%) | 87 (%) | ||
| Communication plan | ||||||
| Stages 1–4 | 64 (64.0) | 59 (67.8) | χ2 = 1.57 | 22 (22.0) | 4 (4.6) | χ2 = 21.31 |
| Stage 5 | 11 (11.0) | 10 (11.5) | (P = 0.665) | 16 (16.0) | 9 (10.3) | (P = 0.000) |
| Stage 6 | 4 (4.0) | 1 (1.2) | FET | 15 (15.0) | 6 (6.9) | FET |
| Stage 7 | 21 (21.0) | 17 (19.5) | (P = 0.722) | 47 (47.0) | 68 (78.2) | (P = 0.000) |
| Within | Media pre to post | χ2 = 37.74 | (P = 0.000) | FET = | (P = 0.000) | |
| groups: | Platica pre to post | χ2 = 82.24 | (P = 0.000) | FET = | (P = 0.000) | |
| Disaster supplies kit | ||||||
| Stages 1–4 | 28 (28.0) | 20 (23.0) | χ2 = 4.23 | 3 (3.0) | 1 (1.1) | χ2 = 4.13 |
| Stage 5 | 34 (34.0) | 28 (32.2) | (P = 0.238) | 15 (15.0) | 6 (6.9) | (P = 0.248) |
| Stage 6 | 6 (6.0) | 13 (14.9) | FET | 32 (32.0) | 29 (33.3) | FET |
| Stage 7 | 32 (32.0) | 26 (29.9) | (P = 0.243) | 50 (50.0) | 51 (58.6) | (P = 0.269) |
| Within | Media Pre to Post | χ2 = 49.27 | (P = 0.000) | FET = | (P = 0.000) | |
| groups : | Platica Pre to Post | χ2 = 45.63 | (P = 0.000) | FET = | (P = 0.000) | |
Chi-squared test (χ2) and Fisher’s exact test (FET) were used.
Correlation matrix
| Variable | Change in stage for communication plan | Change in stage for disaster supplies kit | Study arm | Gender | Marital status | Perceived self-efficacy | Perceived self-responsibility |
|---|---|---|---|---|---|---|---|
| Change in stage for communication plan | 1.00 | ||||||
| Change in stage for supplies kit | 0.25 | 1.00 | |||||
| Study arm | 0.28 | 0.04 | 1.00 | ||||
| Gender | 0.14 | –0.01 | –0.01 | 1.00 | |||
| Marital status | 0.09 | 0.07 | –0.05 | –0.23 | 1.00 | ||
| Perceived self-efficacy | 0.19 | 0.15 | 0.17 | –0.02 | 0.11 | 1.00 | |
| Perceived self-responsibility | 0.27 | 0.04 | 0.17 | 0.07 | –0.04 | –0.04 | 1.00 |
A different pattern of significance emerges for having household disaster supplies. Here stages of decision making are similar between groups at baseline, and while both groups shift stages significantly there are no significant differences between groups in regards to the rate of shift: both groups progress in similar fashion through the stages of change in decision making model measured. Thus while the within groups analysis finds both groups shift towards actions steps for preparedness, the high-intensity intervention is linked to a more rapid shift for having a communication plan.
Predictors of changes in stages of preparedness for having a communication plan and a supply kit (n = 187)
| Change in stage for communication plana | Change in stage for disaster supplies kitb | |||||||
|---|---|---|---|---|---|---|---|---|
| Independent variables | Estimate | Std. Err | t | P > |t| | Estimate | Std. Err | t | P > |t| |
| Study arm | 0.599 | 0.198 | 3.02 | 0.003 | 0.014 | 0.203 | 0.07 | 0.943 |
| Gender | 0.426 | 0.213 | 1.99 | 0.048 | 0.019 | 0.219 | 0.09 | 0.929 |
| Marital status | ||||||||
| Not married/cohabiting | 0.434 | 0.259 | 1.67 | 0.096 | 0.303 | 0.265 | 1.14 | 0.255 |
| Separated | 1.002 | 0.302 | 3.32 | 0.001 | 0.420 | 0.309 | 1.36 | 0.175 |
| Divorced | –0.733 | 0.773 | –0.95 | 0.344 | –0.654 | 0.791 | –0.83 | 0.410 |
| Widowed | 0.413 | 0.563 | 0.73 | 0.464 | –0.088 | 0.576 | –0.15 | 0.878 |
| Never married | 0.63 | 0.278 | 2.27 | 0.025 | 0.330 | 0.284 | 1.16 | 0.248 |
| Perceived self-efficacy | 0.068 | 0.034 | 2 | 0.047 | 0.060 | 0.034 | 1.73 | 0.085 |
| Perceived self-responsibility | 0.058 | 0.016 | 3.54 | 0.001 | 0.010 | 0.016 | 0.64 | 0.525 |
| Constant | –2.2 | 0.865 | –2.54 | 0.012 | –0.93 | 0.886 | –1.05 | 0.295 |
aF (9177) = 6.01, P < 0.0000; R2 = 0.234, Adj. R2 = .195.
bF(9177) = 0.94, P = .487; R2 = 0.045, Adj. R2 = –0.003.
Prior to conducting the linear regression we generated a matrix of correlations among all key variables. In Table IV we report only on the variables included in our final model. For both the overall and the reduced set of variables the inter-correlations between variables are relatively low to moderate, with change scores significantly associated (r = 0.25), and study arm associated with changes in decision making for a communication plan. The correlation analysis does not suggest high correlations or multicollinearity among the key variables, thus justifying use of regression analyses.
In Table V OLS regression findings confirm and extend those from bivariate analyses. For changes in decision making for a communication plan, there are significant effects for the ‘platicas’ group compared with the media group. Additionally women, those not married, and those with higher perceived self-efficacy and self-responsibility are also more likely to shift to having a communication plan over the course of the study. The overall model shows a moderate degree of significance [F(9177) = 6.0, P < 0.000, adjusted r2 = 0.23) for changes in decision making for the communication plan. Findings for changes in stages of decision making for disaster supplies are barely significant. The only significant predictor is perceived self-efficacy, with a marginal P-value. The overall model itself is not significant.
Discussion
In this intervention study, we used variables based on the Precaution Adoption Process Model [38, 40]. To assess the degree to which an intervention using interpersonal methods of communication compared with media-based communication only. We hypothesized that while both methods could shift participants’ stage of decision making and actions relevant to household disaster preparedness, we also asked whether the more intense intervention would have a greater impact. Decision making shifts in a positive direction, thus supporting the utility of using the Precaution Adoption Process Model to frame this intervention research. Specifically the high-intensity group that received instruction in disaster preparedness with community-based ‘promotoras’ (‘platicas’) had more significant shifts in stages of decision making for the communication plan than the than the group that received media only communication information. One explication for these findings is that more complex behavior change, such as making a communication plan, requires more intensive education, whereas messages about supplies are simpler to comprehend and enact.
Needs assessment and formative research conducted prior to the intervention suggested that people are willing to invest in disaster preparedness as they see the advantage for their household in the event of a disaster [17, 28, 42]. However these same studies suggested that people especially in poor, immigrant and low-income neighborhoods did not know how to efficiently become disaster prepared [17].
As well many do not understand what creating a family communication plan for disaster preparedness actually means, as there have been many different variations in that message disseminated [15, 17]. Specifically some campaigns have said its having a pre-arranged meeting place for family members after a disaster, some have said it is have a list of important numbers and a plan for contacting each family member after a disaster, some have said that it is an evacuation route for a family during a disaster, and some have said it is a number of an out of state relative to call so that if telephone communications are down so the relative can monitor where different family members are [15]. To add to the confusion, some directives support the use of cell phones and handhelds, while other in the disaster community suggest that use of these devices is counterproductive as in recent disasters cell phone connectivity was hampered, notwithstanding the current reality that SMS-based disaster alerts systems are increasingly being implemented nationwide. The upshot of lack of consistency in messages and message delivery systems are that most people are confused, and adherence with this aspect of disaster preparedness is low in most survey research conducted [15, 25] the opposite of what most of the literature on disaster communication ‘best practices’ recommends [30].
Campaigns with disaster supply lists, often suffer from the same lack of consistency as those with fuzzy or undeveloped definitions of disaster communication plans [31]. While many families may actually have some basic items at home, and published disaster preparedness guidelines all promote basic items such as water, food, medications and a flashlight [46], these lists may not tell people the specific quantities of things to stock, so there is variation in what people believe is appropriate [17].
Another consistent finding in the disaster literature is that many people, particularly those in poor neighborhoods distrust the government and their ability to help them in the wake of a disaster [25, 47]. Subsequently people are receptive to the idea of assuring they are self-sufficient during and after a disaster [15, 17] despite incomplete adherence to the message. Thus implicit in the findings from this intervention was the importance of working with a trusted community-based organization, the Coalition for Community Health, who contacted participants either through mailed or in-person educational outreach activities. These ideas resonate with current notions in disaster preparedness about fostering community resilience, not simply individual household preparedness [3, 18, 22, 48].
The study had a few limitations. First, small sample size precluded using a more sophisticated multilevel modeling approach to data analysis. Second, the RDS sample design meant that the study participants were part of social networks, may be more homogenous than a randomly selected population. However, few health promotion interventions at the community-level interventions can select people at random to be in interventions, and given parity between treatment groups at baseline as well as similar population characteristics for survey research studies in the same area, deficiencies in external validity are more than compensated for with high internal validity.
Implications for research and practice
The study shows the benefit of using the Precaution Adoption Process Model, stages of change in decision-making theory, to measure intervention impact [38, 40]. In this community-based intervention study we also showed that clear consistent messages delivered through a community-based organization led to increased preparedness among households that were resource constrained. The study shows the utility of working with trusted community-based organizations to help translate disaster preparedness messages for disadvantaged households. Finally, the study implies that progress in increasing disaster preparedness is contingent on more focused community-based outreach than has heretofore been standard practice within this field. Often the reliance has been on mass-media campaigns to disseminate messages that may be inconsistent and that are not necessarily understood, recalled or interpreted in ways that lead to action at the level of households, especially in poor or immigrant communities.
Funding
The survey was supported by award No. 1 K01 CD000049-01 by the CDC to D.P.E. The manuscript's content is solely the responsibility of the authors and does not necessarily represent the views of the granting agency.
Conflict of interest statement
None declared.