


Abstract
Stereotype threat can impair older adults’ performance on clinical assessments for cognitive decline. We examined why this occurs. Based upon the regulatory focus account of stereotype threat, we predicted that the effects of stereotype threat should depend upon the assessments’ reward structure. Stereotype threat should be associated with poor performance when the assessment emphasizes gaining correct answers, but not when it emphasizes avoiding mistakes.
Healthy older adults completed a series of mental status examinations. Half of the participants completed these examinations under stereotype threat about their cognitive abilities. Monetary incentives were also manipulated. For half of the participants correct responding led to gains. For the remaining participants incorrect responding/forgetting led to losses.
Consistent with the regulatory focus account, stereotype threat was associated with poor performance when the mental status examinations had a gains-based structure, but not when they had a losses-based structure.
Older adults respond to stereotype threat by becoming vigilant to avoid the losses that will make them their worst. Researchers and clinicians can capitalize on this motivational change to combat stereotype threat’s negative effects. By using a loss-avoidance frame, stereotype threat’s negative effects can be attenuated or even eliminated.
Despite the fact that dementia is prevalent among older adults, clinicians often fail to detect it. In fact, between 29 to 75 percent of dementia cases are overlooked by primary care physicians ( Chodosh, et al., 2004 ; Olafsdóttir, Skoog, & Marcusson, 2000 ; Valcour, Masaki, Curb, & Blanchette, 2000 ). Although controversial ( Boustani et al., 2003 ), to combat this problem, clinicians could administer routine mental status examinations to all older adult patients; doing this increases the detection of cognitive impairment from 59 to 83 percent ( Borson, Scanlan, Watanabe, Tu, & Lessig, 2006 ). The practice of administering routine mental status examinations to healthy older adults will also become more common in the United States due to recent policy changes. As of 2011, the Patient Protection and Affordable Care Act added the Annual Wellness Visit as a Medicare benefit. As part of this visit, patients receive both a routine physical exam as well as a screening for cognitive impairment.
The current study examines the impact of stereotype threat on healthy older adults’ performance on such mental status examinations. Stereotype threat occurs when people realize that a stigmatized aspect of their identity may be used to evaluate their performance. As a result of this, people often underperform compared to their potential ( Steele, 1997 ). For example, when older adults take memory tests they may fear that poor performance on their part will confirm the stereotype that older adults have memory problems. This in turn often leads older adults to underperform on memory tests compared to their potential (for a review, see Barber & Mather, 2014 ).
Stereotype threat can also affect mental status examination performance. In one study, healthy older adults who self-categorized as “older” and who expected cognitive abilities to decline with age underperformed on a mental status examination. This in turn had clinical implications; 70% of these older adults met diagnostic screening criteria for dementia compared to about 14% of the older adults in the lower-threat conditions ( Haslam et al., 2012 ). This is similar to research examining “diagnosis threat.” In these studies, people with a history of mild head injuries were told that their medical history increased the likelihood that they would perform poorly on a mental status examination. In response to this, these patients underperformed compared with a control group who also had a history of mild head injuries but were not told that this would impact their performance ( Suhr & Gunstad, 2002 ; 2005 ).
Thus stereotype threat can impact mental status examination performance. The current study examines why this occurs. Although a large variety of mechanisms have been put forth to explain older adults’ stereotype threat effects ( Barber & Mather, 2014 ), the current study focuses solely on testing a motivational-based explanation of stereotype threat based upon regulatory focus theory. According to regulatory focus theory ( Higgins, 1997 ; 1998 ), people differ in their motivational orientations. People with a promotion focus are concerned with achieving their ideals; they work towards their goals with eagerness and are sensitive to the presence or absence of gains in their environments. In contrast, people with a prevention focus are concerned with fulfilling their obligations; they work towards their goals with vigilance and are sensitive to the presence or absence of losses in their environment. Although people differ in their dispositional focus, situational context can determine whether a person is in a short-term situational promotion or prevention state. It has been argued that stereotype threat is one such context ( Seibt & Förster, 2004 ). When people encounter stereotype threat they abandon the approach of eagerly approaching the gains that will make them their best and rather become vigilant to avoid the losses that will make them their worst. Thus, under stereotype threat people adopt a short-term prevention focus, in which they become sensitive to the presence or absence of losses in their environment.
Situational fluctuations in regulatory focus can in turn affect performance. People perform optimally when the tasks’ reward structure matches their current regulatory focus, that is, when there is a regulatory fit ( Higgins, 2000 ; Higgins, Idson, Freitas, Spiegel, & Molden, 2003 ). People with a promotion focus perform best on tasks that emphasize gains; people with a prevention focus perform best on tasks that emphasize losses. Importantly, research demonstrating stereotype-threat-related performance deficits can be reinterpreted as representing a lack of regulatory fit. As noted by Grimm and colleagues (2009) , most cognitive tasks have an implicit gains-based structure. For example, the assumed goal of a free-recall memory test is to gain as many correct answers as possible. Thus, under stereotype threat there is a poor fit between the individuals’ stereotype-threat-induced prevention focus and the free-recall tests’ implicit gains-based-reward structure. However, according to the regulatory focus account, the performance deficits typically associated with stereotype threat should be ameliorated when regulatory fit is obtained. That is, stereotype threat should not impair performance when the task emphasizes losses. Research with younger adults has supported this conclusion ( Chalabaev, Major, Sarrazin, & Cury, 2012 ; Grimm, et al., 2009 ).
Studies with older adults have also supported the regulatory focus account of stereotype threat. Although stereotype threat impairs older adults’ memory performance when gains are emphasized, it does not impair (and sometimes improves) their performance when losses are emphasized. This is true both for working memory performance ( Barber & Mather, 2013a ), and also free recall performance ( Barber & Mather, 2013b ). Furthermore, consistent with a loss-averse prevention focus, older adults under threat adopt a more conservative response criterion during a recognition test ( Barber & Mather, 2013b ), make fewer recall intrusions ( Barber & Mather, 2013b ), and respond more slowly but with higher accuracy during a letter-canceling task ( Popham & Hess, 2013 ).
In this study we examined the clinical relevance of these findings. Based on the regulatory focus account, we predicted that changing the framing of a clinical mental status examination from focusing on gains towards focusing on losses would ameliorate older adults’ stereotype threat performance deficits.
Method
Participants
We tested 80 older adults from the Los Angeles area. One participant had difficulty understanding task instructions and extremely poor performance. We excluded this participant and recruited a new older adult to replace him. However, reported results are unchanged when retaining this participant. Our final set of 80 participants (53.7% women) were on average 69.54 years old ( SD = 5.33; range = 61–80). Participants were highly educated having completed an average of 17.77 years of education ( SD = 2.13; range = 12–24). For the three participants who indicated they had “16+ years” of education we assumed 17 years of education. For the participant who indicated they had completed trade school we assumed 14 years of education. One participant did not answer this question. Stereotype threat effects are typically greater for older adults with high levels of education ( Hess, Hinson, & Hodges, 2009 ), thus this was expected to increase our observed effects. For more demographic information, see Table 1 .
Participant Characteristics as a Function of Stereotype Threat and Reward Structure Condition
| Gains-related | Losses-related | |||
|---|---|---|---|---|
| No-threat | Stereotype threat | No threat | Stereotype threat | |
| Age | 69.20 | 69.50 | 69.30 | 70.15 |
| Sex | 9 women, 11 men | 12 women, 8 men | 10 women, 10 men | 13 women, 7 men |
| Education (in years) a | 16.70 | 17.75 | 18.05 | 18.58 |
| Self-reported health | 7.55 | 7.40 | 7.85 | 8.05 |
| Self-reported stress | 3.20 | 4.08 | 2.90 | 3.48 |
| Reappraisal score | 30.05 | 27.55 | 28.95 | 29.10 |
| Suppression score | 11.40 | 12.65 | 12.20 | 11.50 |
| Age-group identification | 26.45 | 22.45 | 25.90 | 23.65 |
Note. Self-reported health was provided on a 1 (very poor health) to 9 (excellent health) scale. Self-reported stress was provided on 1 (very low) to 9 (very high) scale. Reappraisal and suppression scores came from the Emotion Regulation Questionnaire (Gross & John, 2003). The age-group identification score came from a questionnaire previously used by Garstka and colleagues (2004).
a For the three participants who indicated they had “16+ years” of education we assumed 17 years of education. For the participant who indicated they had completed trade school we assumed 14 years of education. One participant did not answer this question.
Participants were recruited through a list of research volunteers that was obtained via letters to University of Southern California alumni, newspaper and online ads, and fliers at senior centers and public places. No mental status examinations were administered during recruitment. Participants were compensated $15 per hr in addition to a performance-based monetary reward.
Design
Stereotype threat (threat vs. no-threat) and reward structure of the dependent measures (gains-based vs. losses-based) were manipulated between-subjects. As described below, there were three critical mental status examinations: The Word List Memory Test from the Consortium to Establish a Registry on Alzheimer’s Disease (CERAD; Welsh, Butters, Hughes, Mohs & Heyman, 1991 ), the Addenbrooke’s Cognitive Examination-Revised (ACE-R; Mioshi, Dawson, Mitchell, Arnold, & Hodges, 2006 ), and the Mini Mental State Examination (MMSE; Folstein, Folstein, & McHugh, 1975 ). Also described below, we included two baseline mental status examinations: A Control Word List Memory Test (which was formatted to be identical to the one from the CERAD) and the MMSE.
Critical Mental Status Examinations
Word List Memory Test from the CERAD.
The Word List Memory Test is part of a larger battery of tests that assess the cognitive processes affected by Alzheimer’s disease ( Morris, Mohs, Rogers, Fillenbaum, & Heyman, 1988 ; Welsh et al., 1991 ). During this test, participants view 10 concrete nouns, presented at the rate of one word every 2 s. They immediately recall aloud as many of the words as possible. This cycle is repeated two more times; words are shown in a different order each cycle. After a filled delay of 10min, participants again recall aloud as many of the 10 words as possible. Finally, participants complete a recognition memory test in which the 10 critical words are interspersed with 10 new words. There are many ways to score performance; we assumed a total of 10 points on each of the 5 sub-tests—the 10 words that could be recalled on each of the three initial study-test cycles, the 10 words that could be recalled on the delayed recall test, and the 10 hits on the delayed recognition test.
ACE-R.
This is a brief test of cognitive functions sensitive to the early stages of dementia. There are a total of 100 possible points that can be obtained on the ACE-R; 30 of which correspond to the MMSE ( Folstein, Folstein, & McHugh, 1975 ; Mioshi et al., 2006 ). Five cognitive domains are assessed. The first domain is verbal fluency. Here, participants complete a letter fluency task (generate words beginning with the letter “P” for 1min) and a category fluency task (generate names of animals for 1min). The second domain is orientation and attention (e.g., “What is the date today?”). The third domain is language abilities. Here, participants are asked to name line drawings, to comprehend sentences, to repeat words and phrases, and to write a sentence. The fourth domain is memory abilities. Participants are asked to learn three words as well as a name and address, and then recall that information after a delay. They are also asked to recall the names of famous individuals. We made two modifications to the ACE-R questions assessing memory abilities to accommodate our American participants. First, rather than ask participants to name the current Prime Minister of the U.K., we instead asked them to name the current Vice President of the United States. Second, we edited the address that participants were asked to learn and remember from being located in England to being located in the United States. The final domain is visuospatial abilities. Participants copy overlapping pentagons, copy a cube, and draw a clock face.
MMSE.
This is a brief measure of cognitive status, with a maximum score of 30 points ( Folstein et al., 1975 ). It includes questions assessing orientation, word recall, attention and calculation, language abilities, and visuospatial abilities ( Tombaugh & McIntyre, 1992 ). As noted above, all of the MMSE questions were embedded in the ACE-R.
Baseline Mental Status Examinations
Control Word List Memory Test.
Using the MRC Psycholinguistic Database ( Wilson, 1988 ), we constructed two sets of 10 words that were approximately matched in number of letters, word frequency, familiarity, imagibility, and concreteness to the 10 critical words, and to the 10 recognition lures, in the Word List Memory Test from the CERAD ( Welsh et al., 1991 ). The procedure of the Control Word List Memory Test was identical to that of the Word List Memory Test from the CERAD (described above) using these new critical words and recognition test lures.
MMSE.
Participants completed the MMSE both at baseline and later as part of the ACE-R. The only difference in the questions between the two administrations was the identity of the three words that participants were asked to repeat and recall.
Procedure
Participants first completed the three study-test free-recall cycles of the Control Word List Memory Test (described above). There was then a 10-minute filled delay during which participants completed the baseline MMSE (described above), and spent remaining time completing puzzles. Participants then completed the delayed recall and recognition tests of the Control Word List Memory Test.
We next manipulated stereotype threat by asking participants to read a fictitious news article taken from Hess, Auman, Colcombe, and Rahhal (2003) . In the stereotype threat condition the article described research confirming that memory declines with age. In the no-threat condition the article described preservation of memory for words and increased language abilities with age. The experimenter stated that the current study’s purpose was either to confirm that “memory inevitably declines with age” or that “verbal abilities and memory for words improves with age.”
Participants then completed the Word List Memory Test from the CERAD (described above). While doing this, participants were given a performance-based monetary reward. For half of the participants the reward was gains-based. Participants received one poker chip for each word correctly recalled. For the other half of the participants the reward was losses-based. Participants were initially given 60 poker chips, but lost one chip for each word forgotten or false alarm made. In both reward-conditions, each chip was worth five cents, and corresponded to an actual monetary payment given to participants at the end of the experiment. Participants’ chips (that they had accumulated or not lost) were placed beside them and were clearly visible.
After completing the three study-test-free-recall cycles of the Word List Memory Test from the CERAD there was a 10-minute delay period. During this time participants completed a demographics questionnaire, the Emotion Regulation Questionnaire ( Gross & John, 2003 ) and the Positive and Negative Affective Scale (PANAS; Watson, Clark, & Tellegen, 1988 ). Remaining time (if any) was spent doing puzzles. The experimenter next reminded participants about the performance-based reward and restated the threat/no-threat manipulation. Participants then completed the delayed recall and recognition tests of the Word List Memory Test from the CERAD (with either a gains-based or losses-based reward).
We next manipulated stereotype threat again by having participants read a second fictitious news article. This time the articles focused on how aging affects general cognitive abilities (copies of these fictitious news articles may be obtained from any of the authors.). In the stereotype threat condition the article stated that general cognitive decline begins as early as age 45, rapidly accelerates after age 60, and causes older adults to score lower on tests of intelligence, reasoning, decision making, and verbal abilities. The experimenter also stated that the participant was at the older end of the age-spectrum being tested. In the no-threat condition, the article stated that cognitive declines are minimal before the age of 85, and that people generally preserve their intelligence, reasoning, and verbal abilities as they age. The experimenter also stated that the participant was at the younger end of the age-spectrum being tested. Assignment to the stereotype threat or no-threat conditions was consistent throughout the experiment.
Participants then completed the ACE-R (described above, it includes all the questions from the MMSE). It was coupled with a performance-based monetary reward. When the reward was gains-based participants received one poker chip for each point earned (for a maximum of 100 chips). When the reward was losses-based, participants were initially given 100 poker chips, and lost one chip for each point lost on the ACE-R. As before, each chip was worth five cents, corresponded to an actual monetary payment, and chips were always clearly visible to participants. As with the stereotype threat manipulation, assignment to the gains-based versus losses-based reward structure conditions was consistent throughout the entire experiment.
At the end of the experiment, participants completed a series of questionnaires. As a manipulation check, participants completed an adaptation of the Perceived Stereotype Threat Questionnaire ( Kang & Chasteen, 2009 ). We included five-items assessing situational perceptions of threat (e.g., “The researcher will think that older adults, as a whole, have poorer memory and cognitive abilities if I did not do well on the tests”) and three-items assessing dispositional perceptions of threat (e.g., “I often feel that I have to prove to others that their perceptions of my memory abilities are wrong”). We also included four-items assessing trait perceptions of age-group discrimination (e.g., “I feel like I am personally a victim of society because of my age”; Garstka, Schmitt, Branscombe, & Hummert, 2004 ). Our stereotype threat manipulation was expected to affect situational perceptions of threat, but not dispositional levels of threat or perceived age-group discrimination.
Within this final series of questionnaires, participants also noted how well they thought they had done on the tests (“I did well on the memory tests”), and indicated the amount of anxiety they experienced while reading the news articles (using a scale from Osborne, 2001 ). Participants also completed an age-group identification questionnaire (“I like being a member of my age group”; from Garstka, et al., 2004 ).
Results
Baseline Measures
We ran a series of 2 (stereotype threat condition) × 2 (reward structure condition) analysis of variance (ANOVA) to ensure that participants across the conditions did not differ on our assessed demographic variables ( Table 1 ), or in baseline mental status examination performance. Results revealed that the participants randomly assigned to the losses-based reward structure conditions were more highly educated ( M = 18.31 years) than those assigned to the gains-based reward structure conditions ( M = 17.23 years), F (1, 75) = 5.56, MSE = 4.21, p = .02, η p2 = .07.
Results also revealed an interaction between stereotype threat and reward structure conditions on baseline MMSE performance, F (1, 76) = 6.40, MSE = 1.76, p = .01, η p2 = .08. This interaction occurred because participants randomly assigned to the stereotype-threat gains-related condition ( M = 28.95) had higher baseline MMSE performance than participants assigned to the no-threat gains-related condition ( M = 28.10), F (1, 38) = 4.67, MSE = 1.55, p = .04, η p2 = .11. Importantly, this pattern is opposite to the one expected on the critical measures, and was also absent on the baseline Control Word List Memory Test. Thus, if stereotype threat impairs critical mental status examination performance when gaining rewards is emphasized but not when avoiding losses is emphasized, this cannot readily be explained by these baseline differences.
Manipulation Checks
Our stereotype threat manipulations were effective. Participants in the stereotype threat conditions ( M = 14.15) self-reported higher situational perceptions of threat (on the Perceived Stereotype Threat Questionnaire adapted from Kang & Chasteen, 2009 ; observed Cronbach’s alpha = 0.65) than participants in the no-threat conditions ( M = 12.00), F (1, 76) = 8.17, MSE = 11.32, p = .005, η p2 = .10. This replicates previous results ( Chasteen, Bhattacharyya, Horhota, Tam, & Hasher, 2005 ; Kang & Chasteen, 2009 ), and did not vary by the reward-structure manipulation, F < 1. In contrast, participants in the stereotype threat conditions ( M = 8.68) and no-threat conditions ( M = 8.88) did not vary in dispositional levels of stereotype threat, F < 1, or in perceived age-discrimination, F < 1.
Our stereotype threat manipulations also affected anxiety (observed Cronbach’s alpha = 0.51). Participants in the stereotype threat conditions ( M = 1.43) self-reported higher anxiety while reading the news articles than did participants in the no-threat conditions ( M = 0.83), F (1, 76) = 4.60, MSE = 1.56, p = .04, η p2 = .06. This replicates previous results ( Abrams, Eller, & Bryant, 2006 ), and did not vary by the reward-structure manipulation, F (1, 76) = 1.57, MSE = 1.56, p = .22, η p2 = .02. In contrast, there were no significant differences amongst the conditions in self-reported positive and negative affective states (assessed via the PANAS) or in self-perceptions of performance (in answer to the question “I did well on the memory tests”).
Performance on the Word List Memory Test From the CERAD and on the MMSE
To examine the impact of stereotype threat on mental status examination performance, we first examined performance on the Word List Memory Test from the CERAD (defined here as the total score across the sub-tests) and on the MMSE. As described above, all participants completed baseline versions of these tests (i.e., the baseline Control Word List Memory test or the baseline MMSE). We then manipulated stereotype threat before asking participants to complete critical versions of these tests, which included either a gains-based or losses-based monetary incentive. Because of this design, we used change scores as our units of analysis. We predicted that threat would impair performance when gaining rewards were emphasized but not when avoiding losses were emphasized. To test this, we conducted a 2 (stereotype threat condition) × 2 (reward structure condition) multivariate analysis of covariance (MANCOVA) on performance change scores and included three covariates. First, we included years of education because the reward-structure conditions differed on this measure (For the one participant who did not specify her years of education, we imputed the average educational obtainment from all other participants [i.e., 17.8 years] for use in these analyses.). We also included chronological age and sex as covariates because these variables were associated with performance. The older the participant the worse they tended to perform. Women tended to have higher mental status examination performance than men.
Consistent with our predictions, within this MANCOVA there was a significant multivariate interaction between the stereotype threat and reward structure conditions, F (2, 72) = 4.71, p = .01, η p2 = .11. As can be seen in Figure 1 and 2 , follow-up multivariate analyses showed that stereotype threat led participants to underperform when the assessments had a gains-based structure, F (2, 34) = 7.68, p < .01, η p2 = .31, but not when they had a losses-based structure, F (2, 34) = 1.11, p = .34, η p2 = .06.
![Adjusted performance on the critical mini mental state examination (MMSE; embedded in the Addenbrooke’s Cognitive Examination-Revised [ACE-R]) as a function of stereotype threat and task reward structure. Means are adjusted for the covariates of educational attainment, chronological age, sex, and baseline MMSE performance. Error bars represent the adjusted standard errors of the means.](https://oup.silverchair-cdn.com/oup/backfile/Content_public/Journal/psychsocgerontology/70/6/10.1093_geronb_gbv009/2/m_geronb_gbv009_f0001.jpeg?Expires=1716440810&Signature=UOwIU8f0ZE28Z4XL6wCdVwlAsAPk7ZpXFi0Vjc7p6fRqsO3WPTxC-FbBBZJ3FaAU9yi8u4hSI6kXawfvkBLXKE9yeusVg7UWnNCaIjLre4KscCchMsk0ouJzjnrFb0PQbVx5YpswoZnwv3E8VLYfAP1lzJ2l1CwjSLUvOJa6ncViu05MHMbADlW0Z8J0Mh2i1~P3MopGmBdbHLYSwMyfFoizFRGEdnS5X~hpmfZgqQAbO1oKyqdj0xcjDOfkDuOvrwG2g1AHSjOXPnYIQKzCXoE~SjGIHzV8-lMVukwDYh2ddJ6PssoEhZGIJy0sGdBLxuylDm6xzhOjeBevbIj88w__&Key-Pair-Id=APKAIE5G5CRDK6RD3PGA)
Adjusted performance on the critical mini mental state examination (MMSE; embedded in the Addenbrooke’s Cognitive Examination-Revised [ACE-R]) as a function of stereotype threat and task reward structure. Means are adjusted for the covariates of educational attainment, chronological age, sex, and baseline MMSE performance. Error bars represent the adjusted standard errors of the means.
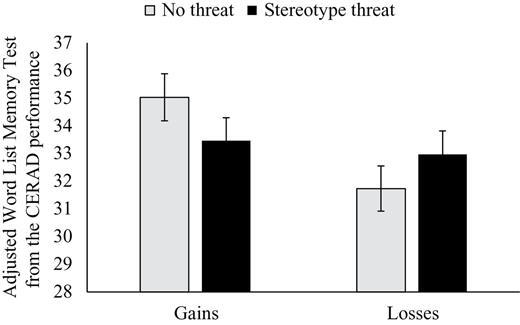
Adjusted performance on the critical Word List Memory Test from the Consortium to Establish a Registry on Alzheimer’s disease (CERAD) as a function of stereotype threat and task reward structure. Means are adjusted for the covariates of educational attainment, chronological age, sex, and baseline Control Word List Memory Test performance. Error bars represent the adjusted standard errors of the means.
The prior analyses show that stereotype threat can impact overall mental status examination performance. Does this vary across the cognitive domains included in such examinations? To answer this, we next conducted a 2 (stereotype threat condition) × 2 (reward structure condition) × 5 (sub-test of the Word List Memory Test from the CERAD change score: Immediate recall study-test cycle 1, Immediate recall study-test cycle 2, Immediate recall study-test cycle 3, Delayed recall, Delayed hits) ANCOVA. We again included education, age, and sex as covariates. Results revealed a significant interaction between the stereotype threat and reward structure conditions, F (1, 73) = 3.88, MSE = 3.18, p = .05, η p2 = .05. This interaction did not vary across the sub-tests, F < 1. As shown in Table 2 , across the sub-tests, stereotype threat led to performance impairments when correct responding led to gains, F (1, 35) = 8.34, MSE = 2.68, p = .007, η p2 = .19, but not when incorrect responding led to losses, F < 1.
Unadjusted Mean Performance on the Baseline Control Word List Memory Test and on the Critical Word List Memory Test From the Consortium to Establish a Registry on Alzheimer’s Disease (CERAD) as a Function of Stereotype Threat and Reward Structure Condition. The Maximum Possible Score on Each of the Sub-Tests is 10 Points
| Gains-related | Losses-related | |||
|---|---|---|---|---|
| No threat | Stereotype threat | No threat | Stereotype threat | |
| Baseline Word List Memory Test | ||||
| Immediate recall study-test cycle 1 | 4.55 | 4.75 | 5.05 | 4.75 |
| Immediate recall study-test cycle 2 | 6.45 | 6.75 | 6.95 | 6.60 |
| Immediate recall study-test cycle 3 | 7.55 | 7.60 | 8.20 | 7.65 |
| Delayed recall | 5.80 | 6.15 | 5.85 | 5.90 |
| Delayed hits | 9.80 | 9.75 | 9.80 | 9.50 |
| Critical Word List Memory Test | ||||
| Immediate recall study-test cycle 1 | 4.50 | 4.40 | 4.50 | 4.75 |
| Immediate recall study-test cycle 2 | 6.45 | 6.30 | 6.85 | 6.75 |
| Immediate recall study-test cycle 3 | 8.00 | 7.15 | 8.05 | 7.20 |
| Delayed recall | 5.50 | 4.50 | 4.85 | 4.75 |
| Delayed hits | 9.75 | 9.65 | 9.80 | 9.50 |
| Change in performance (critical test minus baseline test performance ) | ||||
| Immediate recall study-test cycle 1 | −0.05 | −0.35 | −0.55 | 0.00 |
| Immediate recall study-test cycle 2 | 0.00 | −0.45 | −0.10 | 0.15 |
| Immediate recall study-test cycle 3 | 0.45 | −0.45 | −0.15 | −0.45 |
| Delayed recall | −0.30 | −1.65 | −1.00 | −1.15 |
| Delayed hits | −0.05 | −0.10 | 0.00 | 0.00 |
Performance on the ACE-R
Participants also completed the ACE-R. In contrast to the Word List Memory Test and the MMSE this was done only after our manipulation of stereotype threat. Therefore, to examine ACE-R performance we next conducted a 2 (stereotype threat condition) × 2 (reward structure condition) × 5 (ACE-R sub-test: orientation, memory, fluency, language, or visuospatial abilities) ANCOVA on performance (scores on the sub-tests were standardized). In addition to education, age, and sex, we included baseline MMSE score as a covariate to account for individual differences in baseline cognitive performance; baseline MMSE scores ranged from 25 to 30 ( M = 28.65, SD = 1.36).
As shown in Table 3 , the pattern of results was consistent with our predictions; there was an interaction between the stereotype threat and reward structure conditions, F (1, 72) = 2.90, MSE = 1.03, p = .047 (one-tailed), η p2 = .04. This interaction did not vary across the sub-tests, F < 1. Follow-up analyses revealed no significant effects. However, the interaction between stereotype threat and reward structure condition was driven by the fact that stereotype threat was associated with numerically poorer performance when correct responding led to gains, F (1, 34) = 1.67, MSE = 1.00, p = .10 (one-tailed), η p2 = .05 .04, but did not affect performance when incorrect responding led to losses, F < 1. However, as noted above, neither of these follow-up analyses approached conventional levels of statistical significance.
Mean Performance on the Addenbrooke’s Cognitive Examination-Revised (ACE-R; Adjusted Only for Baseline Mini Mental State Examination [MMSE] Performance) as a Function of Stereotype Threat and Reward Structure Condition. The Maximum Possible Score on Each of the Sub-Tests is Provided in Parentheses Next to the Name of the Test
| Gains-related | Losses-related | |||
|---|---|---|---|---|
| No threat | Stereotype threat | No threat | Stereotype threat | |
| Orientation and attention (18) | 17.83 | 17.54 | 17.71 | 17.63 |
| Memory abilities (26) | 22.18 | 21.10 | 21.60 | 22.12 |
| Verbal fluency (14) | 12.42 | 12.07 | 11.98 | 11.98 |
| Language abilities (26) | 25.00 | 24.60 | 24.62 | 25.34 |
| Visuospatial abilities (16) | 15.34 | 15.58 | 15.40 | 15.63 |
Of note, the current results replicate the previous findings reported by Haslam and colleagues (2012) ; stereotype threat exerted a negative effect on ACE-R performance when the examination emphasized gaining correct answers. However, in contrast to Haslam and colleagues, 2012 , stereotype threat did not affect the proportion of participants meeting diagnostic screening criteria for dementia [i.e., the number of participants falling below the cut-off score of 82 on the ACE-R]. In this study, extremely few participants fell below this cut-off. In fact, there were fewer than two participants per conditions, that met this criterion. Thus, although stereotype threat impacts mental status examination performance such effects may not always lead to changes in diagnostic outcomes.
The Roles of Perceived Stereotype Threat and Anxiety
Participants in the stereotype threat conditions self-reported higher situational levels of perceived threat. We next examined whether this mediated the effect of stereotype threat on performance as a function of the examinations’ reward structure. To do this, we conducted a moderated mediation analysis, using Hayes’ (2012 , model 14) PROCESS macro for SPSS. As shown in Figure 3 , the model estimated the effect of stereotype threat on performance directly, as well as indirectly through situational perceptions of threat. The mediating effect of situational perceived threat was also modeled as being moderated by the reward structure of the examinations. A bootstrapping procedure was used to generate a sample size of 5,000 to assess the regression models. The mediator and interaction terms were mean-centered. We used a 95% bias-corrected and accelerated confidence intervals.
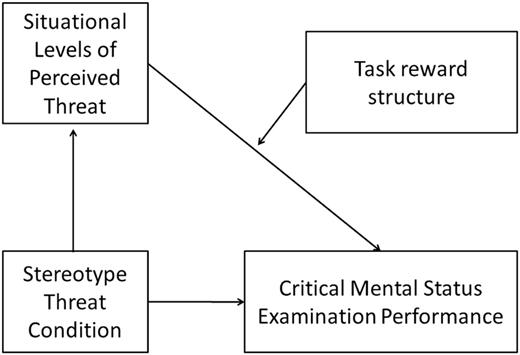
Conceptual diagram of the moderated-mediation analysis.
For the outcome variable we created a composite score that reflected performance on all three of our critical measures: The ACE-R (which includes the critical MMSE score) and the Word List Memory Test from the CERAD. This was done by adding the standardized z -scores from the ACE-R and the Word List Memory Test from the CERAD. We again included education, age, and sex as covariates. We also included standardized performance on both the baseline MMSE and on the Control Word List Memory Test as covariates to account for individual baseline performance differences. We also included self-reported anxiety as a covariate in order to examine the unique contribution of perceived threat, independent of anxiety’s effects. Covariates were allowed to load on both the mediator and outcome variable.
The first part of this analysis assessed the relationship between stereotype threat condition and levels of situational perceived threat, and was significant, F (7, 72) = 3.04, p = .01, R2 = .23. Consistent with our previous analyses, our stereotype threat manipulation was associated with significantly higher levels of situational perceived threat, t (72) = 2.35, p = .02.
The second part of the analysis assessed the relationship between stereotype threat condition and mental status examination performance directly, as well as indirectly through levels of situational perceived threat. In addition, it tested whether the indirect path was moderated by the tasks’ reward structure. Overall, this model was significant and accounted for 65% of the observed variance, F (10, 69) = 12.74, R2 = .65. 11.90, R2 = .63. However, levels of situational perceived threat did exert a significant impact on performance, t (69) = 1.30, p = .20, regardless of the tests’ reward structure, t (69) = 1.16, p = .25.
We repeated the above analysis using anxiety (rather than perceived threat) as the mediating factor (and included situational perception of stereotype threat as a covariate). Within this analysis there were no significant effects. After accounting for the covariates there was no relationship between stereotype threat condition and self-reported anxiety, t (72) = 1.28, p = .21. Furthermore, anxiety did not directly affect performance, t (69) = 1.59, p = .12, regardless of the tests’ reward structure, t (69) = .05, p = .96.
Discussion
Of the many negative stereotypes that exist about older adults, one of the most common is that they are forgetful and prone to “senior moments.” In fact, although cognitive processes do decline with age, simply reminding older adults about ageist ideas often exacerbates their cognitive problems via stereotype threat ( Barber & Mather, 2014 ). These stereotype threat-related impairments have clinical implications for older adults. In one study 70% of older adults scored below the cut-off for dementia on a mental status examination when assessed under stereotype threat, compared to approximately 14% when not assessed under threat ( Haslam et al., 2012 ).
In the current study, we tested whether such stereotype threat effects arise due to changes in regulatory focus in older adults. Results were generally consistent with the regulatory focus account. Stereotype threat led older adults to underperform on the Word List Memory Test of the CERAD and on the MMSE when providing correct answers was associated with monetary gains. Numerically the same pattern emerged on the ACE-R, although this failed to reach statistical significance. In contrast, the negative effects of stereotype threat were eliminated when providing incorrect answers led to monetary losses. These results extend our prior research showing analogous patterns within the domains of working memory ( Barber & Mather, 2013a ) and free recall ( Barber & Mather, 2013b ). However, the effects of stereotype threat on performance were not mediated by either levels of perceived stereotype threat or anxiety, regardless of the exam’s reward structure.
There are several limitations to this study that should be addressed in future research. First, we did not include a true control condition in which no information about how aging affects memory and cognition was presented. Rather, participants were placed in either a stereotype threat condition, which presumably increased their perceptions of threat, or in a “no-threat” condition, which may have decreased their perceptions of threat. This was done to clearly separate the conditions in terms of the amount of threat they experienced. However, it leaves open the question of how much participants naturally feel threat under “neutral” conditions, and also how task framing affects performance for individuals who are not experiencing strong levels of either stereotype threat or threat-alleviation. Our use of a “no-threat” condition may also explain why these participants tended to do better when the task had a gains-based, rather than losses-based, frame. It is possible that the “no-threat” manipulation evoked a promotion motivational focus in which participants became eager to perform their best.
A second limitation is that our losses-based reward structure focused primarily on errors of omission rather than errors of commission. Within the loss-based reward-structure conditions, all errors of omission were associated with point losses. In contrast, the only penalized error of commission was false alarms during the Word List Memory Tests; other errors of commission (such as free-recall intrusions during the Word List Memory Tests or incorrect responses during the MMSE or ACE-R) were not penalized. This loss-based framing is more consistent with a prevention focus than with a promotion focus, and thus we expected stereotype threat effects to be eliminated. However, as noted by a reviewer, stronger regulatory fit effects would likely have emerged if participants had lost points for all errors of commission. Thus, the current results may under-estimate the benefits of loss-based framing for ameliorating stereotype threat effects.
A final limitation of the current study is that we manipulated the reward structure via feedback that was tied to a monetary incentive after every response. This does not readily translate to clinical practice. Future research is needed to determine whether the observed pattern of results would also be obtained by varying whether the verbal instructions emphasize gaining correct answers or avoiding incorrect answers. This in turn could be used as a simple and no-cost method to alleviate older adults’ stereotype threat impairments in clinical settings.
This study provides additional insight into why stereotype threat affects older adults and how this can affect clinically-relevant outcomes. Results suggest that older adults respond to stereotype threat by becoming vigilant to avoid confirming the conclusion that they have experienced cognitive declines. However, researchers and clinicians can capitalize on this motivational change to combat stereotype threat’s negative effects. By using a loss-avoidance frame to the task, stereotype threat effects can be ameliorated or even eliminated.
Funding
This work was supported by grants from the National Institute on Aging (grant numbers R01-AG046464, R01-AG038043, and K02-AG032309).
Acknowledgments
Thanks are due to Lauran Evans, Josh Faskowitz, and Rico Velasco for research assistance. Thanks are also due to Dr. Tom Hess for providing us with part of the stereotype threat manipulation.
References
Author notes
Decision Editor: Shevaun Neupert, PhD

