


Abstract
Falls are frequent among older adults and have significant health and economic consequences. There have been few studies on the epidemiology of falls in residential aged care facilities (RACFs).
To determine the incidence of falls in RACFs using longitudinal routinely collected incident data over 5 years (July 2014–December 2019).
A retrospective cohort study is conducted using fall incident data from 25 RACFs in Sydney, NSW, Australia. Incidents relating to a population of 6163 aged care residents aged ≥65 years were included. Outcome measures were incidents of all falls, injurious falls and falls requiring hospitalization. The risk-adjusted incidence rate (IR) for each outcome indicator for each of the 25 facilities was calculated.
A total of 27 878 falls were reported over 3 906 772 resident days (a crude rate of 7.14 incidents per 1000 resident days; 95% confidence interval (CI) 6.81–7.48). Of these, 10 365 (37.2%) were injurious and 2733 (9.8%) required hospitalization. The crude IRs were 2.65 incidents per 1000 resident days (95% CI 2.53–2.78) for injurious falls and 0.70 incidents per 1000 resident days (95% CI 0.66–0.74) for falls requiring hospitalization. The incidence of falls was significantly higher in respite compared to permanent residents for all falls (adjusted IR ratio (aIRR) 1.33; 95% CI 1.18–1.51) and injurious falls (aIRR 1.30; 95% CI 1.14–1.48) and for men compared to women for all outcomes (all falls aIRR 1.69; 95% CI 1.54–1.86; injurious falls aIRR 1.87; 95% CI 1.71–2.04 and falls requiring hospitalization aIRR 1.29; 95% CI 1.12–1.48). The risk-adjusted IRs per 1000 resident days between facilities varied substantially (all falls 0.57–12.93 falls; injurious falls 0.25–4.47 and falls requiring hospitalization 0.10–1.70).
Falls are frequent in RACFs, often resulting in injury and hospitalization. The study provides robust and comprehensive information that may help inform future initiatives to minimize the incidence of falls in RACFs.
Introduction
Falls become an increasingly serious health event as people age, causing significant health and economic burdens. The World Health Organization (WHO) reports that falls are the second leading cause of unintentional injury deaths worldwide across all age groups and are responsible for over 38 million disability-adjusted life years lost every year [1]. In 2017–8, over half of falls resulting in hospitalizations and 95% of falls resulting in death occurred in Australians over 65 years old [2]. In residential aged care facilities (RACFs), falls are of great concern given the age and health status of residents with a high prevalence of frailty and dementia [3–5]. The importance of falls in RACFs is signified in the National Aged Care Mandatory Quality Indicators Program, which requires mandating the reporting of falls in RACFs.
Few studies have explored the prevalence of falls in Australian RACFs. One point prevalence reported the rate of various types of falls using aggregated data from 88 RACFs in a regional area of New South Wales (NSW), as two falls per bed per year [4]. Internationally, there have been few studies that have comprehensively collated data on falls in aged care settings. A study conducted in the USA interrogated a large nationally representative dataset and found that 15% of RACF residents had experienced an injurious fall in the previous 12 months [5]. In a prospective German study, over 700 000 falls were recorded from 528 RACFs (1326 falls/facility) over a 12-month period [6]. Similarly, in a previous Spain study, 46% of a cohort of 896 residents from 37 RACFs experienced a fall over 9 months [7].
Although there are lessons learned from these studies, the majority of published studies in this area are cross-sectional in design, are performed on small cohorts, or assess point prevalence or incidence of falls in static cohorts. We conducted a retrospective, dynamic, longitudinal cohort study to determine the incidence and characteristics of falls in RACFs in metropolitan Sydney, NSW, Australia.
Methods
Study design and settings
We conducted a retrospective, dynamic, longitudinal cohort study using routinely collected aged care data extracted from 25 RACFs managed by a large not-for-profit aged care provider in NSW, Australia. The study period was from 1 July 2014 to 31 December 2019. This was a dynamic cohort as residents can enter and leave the facility at any time during the study period [8].
Participants
A flow chart of study participant selection is presented in Supplementary Figure S1. The sample included all permanent and respite residents aged ≥65 years who were receiving aged care services during the study period. Interim care residents and same-day discharge were excluded.
Data sources
We utilized de-identified clinical and care management data from the electronic software used by the aged care provider. We combined data from three databases: residents’ profiles, incidents reported and details about residents’ conditions collected as part of the process of determining funding (the Aged Care Funding Instrument (ACFI)). The resident profile database contains information about residents, such as demographics, entry type, entry and departure dates, resident status (e.g. active and deceased), health status and comorbidities. The incident database contains incident-related information, such as incident type, incident date and time, location, body region injured and hospitalization status (e.g. transfer to hospital required). The ACFI contains 12 questions assessing three domains (activities of daily living, behaviour and complex health care) that are used to determine the care needs of residents (Supplementary Table S1) [9].
Outcome measures
Three fall outcome measures, including rates of all falls, injurious falls and falls requiring hospitalization, were assessed. All falls were defined as fall events regardless of whether an injury ensued, or hospitalization was required. Injurious falls were defined as falls resulting in some form of body injury (e.g. skin laceration). Falls requiring hospitalization constituted falls that led to sequelae that required hospital admission for further evaluation or management.
Statistical methods
Descriptive statistics were reported. We used incidence rate (IR) as a measure of falls epidemiology [10]. We reported crude IR with 95% confidence intervals (CIs). Crude IRs were calculated by dividing the number of fall incidents by the number of resident days, without controlling for any confounders. To compare differences in the incidence of falls between respite versus permanent residents and men versus women, we fitted a multilevel negative binomial regression model with facility-specific random intercepts and the number of falls as the outcome variable and controlled for resident case-mix. Relevant case-mix covariates were selected based on prior research [11]. The covariates were age, sex and health status, which have been demonstrated to increase the risk of falls including dementia, history of falls, depression, mood and affective disorders, cognitive impairment, anxiety and stress-related disorders, cerebrovascular accident, diabetes mellitus, visual impairment, delirium and Parkinson’s disease [12–14]. The strength of association was estimated using the IR ratio (IRR) and the IR difference (IRD). The IRR and the IRD are relative and absolute measures of effect, respectively [15].
Funnel plots were created by plotting the risk-adjusted rate value of each facility as a scatterplot relative to their size and superimposing the 95% and 99.8% control limits around the overall crude IR (used as a benchmark) [17]. Facilities lying above the 99.8% control limits were considered extreme outliers. All IR measures were reported per 1000 resident days. In addition, we reported the number of falls per 1000 resident admissions for each outcome measure. All P-values were two-tailed, and P < 0.05 was considered statistically significant. Analysis was conducted using Stata version 16 (StataCorp LP, College Station, TX).
Results
Participants
A total of 6655 unique residents with 10 002 admissions fulfilled the inclusion criteria (Supplementary Figure S1). Of the total resident admissions, 55.5% (n = 5553) were permanent, and 44.5% (n = 4449) were respite. Two-thirds (65.5%) of residents were female, and the median age was 86 (interquartile range (IQR) 80–90) years. Approximately half of the residents (49.0%) had dementia (Table 1).
Baseline characteristics of the residents
| N = 6655 | |
|---|---|
| Total admissions | 10 002 |
| No. of admissions per resident, median (IQR) | 1 (1–2) |
| Sex, n (%) | |
| Male | 2293 (34.5) |
| Female | 4361 (65.5) |
| Agea, median (IQR) | 86 (80–90) |
| Age category in yeara, n (%) | |
| 65–74 | 715 (10.7) |
| 75–84 | 2061 (31.0) |
| 85–94 | 3375 (50.7) |
| ≥95 | 504 (7.6) |
| Country of birth, n (%) | |
| Australia | 4135 (62.1) |
| Other countries | 2520 (37.9) |
| Resident statusb, n (%) | |
| Active | 2922 (43.9) |
| Deceased | 3733 (56.1) |
| Falls historyc, n (%) | 3011 (45.2) |
| Health statusc, n (%) | |
| Dementia | 3263 (49.0) |
| Depression, mood and affective disorders | 2645 (39.7) |
| Cognitive impairment | 2149 (32.3) |
| Anxiety and stress-related disorders | 1984 (29.8) |
| Cerebrovascular accident | 1611 (24.2) |
| Diabetes mellitus | 1483 (22.3) |
| Visual impairment | 1052 (15.8) |
| Delirium | 625 (9.4) |
| Parkinson’s disease | 481 (7.2) |
Age at the first admission for residents with >1 admissions.
Status at end of the last admission for residents with >1 admissions.
The data were available only at the baseline at the first admission.
Incidence and characteristics of falls
There were a total of 27 878 fall incidents reported for over 3 906 772 resident days. Of these, 10 365 (37.2%) were injurious falls, and 2733 (9.8%) were falls requiring hospitalization. At the resident level (n = 6655), 3855 (57.9%) experienced at least one fall, 2975 (44.7%) injurious falls and 1613 (24.2%) falls requiring hospitalization. The proportion of residents who experienced 2, 3, 4 and 5 falls were 8.2%, 6.4%, 4.8% and 3.2%, respectively, while roughly 12% experienced >10 falls during the study period (Supplementary Table S2). At the admission level (n = 10 002), 4344 (43.4%) experienced at least one fall, 3196 (32.0%) injurious falls and 1662 (16.6%) falls requiring hospitalization, respectively. As shown in Table 2, most falls occurred during the daytime, and about two-thirds (64.4%) occurred in residents’ rooms (Table 2). Among residents who experienced a fall (n = 3855), the median number per resident admission was 4 (IQR 2–9) for all falls, 2 (IQR 1–3) for injurious falls and 0 (IQR 0–1) for falls requiring hospitalization. Supplementary Table S3 shows the number of falls per 1000 resident admissions for residents experiencing at least one fall and repeated falls. The number of residents experiencing repeated falls (≥2 falls) per 1000 resident admissions was 445.4 for all falls, 289.7 for injurious falls and 91.0 for falls requiring hospitalization (Supplementary Table S3).
Characteristics of falls
| Characteristics, n (%) | N = 27 878 |
|---|---|
| Falls outcome | |
| Injurious falls | 10 365 (37.2) |
| Falls requiring hospitalization | 2733 (9.8) |
| Incident time of day (2 h) | |
| 12:00 a.m.–2:00 a.m. | 1357 (4.9) |
| 2:00 a.m.–4:00 a.m. | 1310 (4.7) |
| 4:00 a.m.–6:00 a.m. | 1808 (6.5) |
| 6:00 a.m.–8:00 a.m. | 2954 (10.6) |
| 8:00 a.m.–10:00 a.m. | 2722 (9.8) |
| 10:00 a.m.–12:00 p.m. | 2872 (10.3) |
| 12:00 p.m.–2:00 p.m. | 2169 (7.8) |
| 2:00 p.m.–4:00 p.m. | 3156 (11.3) |
| 4:00 p.m.–6:00 p.m. | 3116 (11.2) |
| 6:00 p.m.–8:00 p.m. | 2711 (9.7) |
| 8:00 p.m.–10:00 p.m. | 2029 (7.3) |
| 10:00 p.m.–12:00 a.m. | 1674 (6.0) |
| Incident day of week | |
| Monday | 3855 (13.8) |
| Tuesday | 4010 (14.4) |
| Wednesday | 4091 (14.7) |
| Thursday | 4110 (14.7) |
| Friday | 3997 (14.3) |
| Saturday | 4007 (14.4) |
| Sunday | 3808 (13.7) |
| Incident location in the facility | |
| Resident’s room | 17 963 (64.4) |
| Shared indoor area | 4037 (14.5) |
| Bathroom/toilet | 2995 (10.7) |
| Dining room | 1997 (7.2) |
| Garden/outdoor area | 565 (2.0) |
| Other (e.g. corridor and exercise room) | 321 (1.2) |
| Body region injured (top five)a | N = 10 365 |
| Upper or lower limb | 5989 (57.8) |
| Head/face | 3830 (36.95) |
| Skin | 1656 (16.0) |
| Deep tissue | 575 (5.6) |
| Hip/pelvic area | 485 (4.7) |
For residents experiencing injurious falls. Residents can have multiple body injuries in one incident.
IR of falls
The crude IRs (95% CI) were 7.14 (6.81–7.48), 2.65 (2.53–2.78) and 0.70 (0.66–0.74) incidents per 1000 resident days for all falls, injurious falls and falls requiring hospitalization, respectively. Figure 1 compares the IRs by admission type and sex. The IRs were greater in respite compared to permanent residents for all falls and injurious falls; the IR of all falls for respite was 1.33 times the IR for permanent residents (95% CI 1.18–1.51) with an IRD of 2.84 falls per 1000 resident days (95% CI 1.58–4.11) after adjusting for confounders. Men had a significantly greater rate of falls compared to women for all outcomes. For example, for injurious falls, the IR for men was 1.87 times the IR for women (95% CI 1.71–2.04) with an IRD of 2.29 incidents per 1000 resident days (95% CI 1.84–2.75) after adjusting for confounders. The differences in IRs between men and women were more noticeable for respite compared to permanent residents for all fall outcomes (Supplementary Figure S2). Supplementary Table S4 shows stratified analyses comparing the incidence of falls by sex and admission type for residents with and without dementia. Men had a significantly greater rate of falls compared to women regardless of dementia status for all outcomes. Although respite had a significantly greater rate of falls compared to permanent residents regardless of dementia status for all falls, the differences in IRs were not significant for injurious falls (in residents with dementia) and falls requiring hospitalization (in residents without dementia) (Supplementary Table S4).
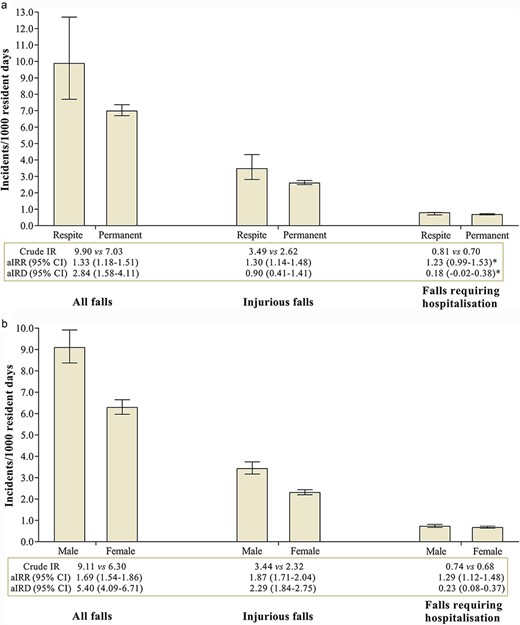
Comparisons of fall incidents by admission type (a) and sex (b).
Trends in the incidence of falls over time
Figure 2 presents trends in crude IRs over the 22 study calendar quarters. There were no major changes in the rate of injurious falls and falls requiring hospitalization over time with quarterly crude IRs ranging from 2.22 to 3.10 per 1000 resident days and 0.45 to 1.06, respectively. However, there were fluctuations in the overall rate of falls with a slight decrease in 2015 followed by an upward trend reaching a rate of over eight falls per 1000 resident days after quarter two of 2019. The quarterly crude IR (per 1000 resident days) for all falls increased from 5.84 in quarter four of 2015 to 8.55 in quarter four of 2019 (Figure 2).
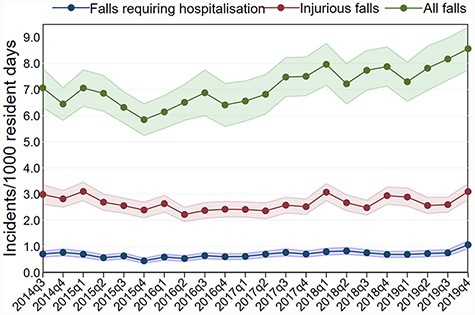
Trends in the incidence of all falls, injurious falls and falls requiring hospitalization over time.
Variation in the risk-adjusted IRs across facilities
The risk-adjusted rates for all falls ranged from 0.57 to 12.93 falls per 1000 resident days across the 25 facilities. One facility (facility no. 7) was an outlier with a risk-adjusted IR above the upper 99.8% control limit (Figure 3a). The risk-adjusted rates ranged from 0.25 to 4.47 incidents per 1000 resident days for injurious falls (Figure 3b) and from 0.10 to 1.70 for falls requiring hospitalization (Figure 3c). For falls requiring hospitalization, the risk-adjusted rates of all facilities were within the control limits with one facility (facility no. 7) above the upper 99.8% control limit for injurious falls. Supplementary Figure S3 presents funnel plots for the most recent year (2019) only. When fall rates were adjusted for risk, one facility had fall rates outside the control limits (facility no. 7) for all falls (Supplementary Figure S3).
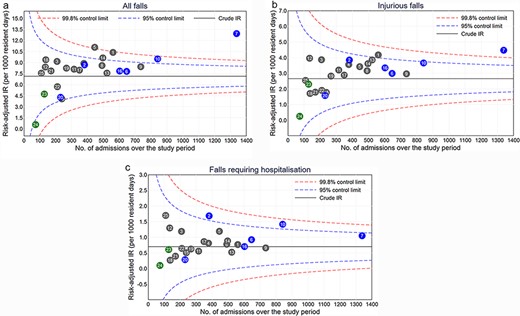
Funnel plots of risk-adjusted IR (per 1000 resident days) for all falls (a), injurious falls (b) and falls requiring hospitalization (C).
Discussion
Statement of principal findings
This is the largest Australian population-based study among adults aged ≥65 years in RACFs. We found that falls are very common in RACFs with nearly 60% of residents falling at least once. For every 1000 resident days, there were seven falls of any type, three injurious falls and one fall resulting in hospitalization. This is the first study that has demonstrated on a large scale, an increased risk of falling for respite clients who had approximately three additional (excess) falls for every 1000 resident days compared to permanent residents. We also found that men had more than five additional falls for every 1000 resident days compared to female residents after controlling for potential confounders. It is important to note that while there was substantial variation between facilities in the overall IR falls, the rates for injurious falls or falls requiring hospitalization by facilities demonstrated less variation suggesting greater consistency in the documentation of falls resulting in harm, potentially demonstrating that the quality of care across the facilities in relation to falls is similar.
Strengths and limitations
We conducted a robust, epidemiological study of falls in RACFs, taking an innovative approach to the utilization of routinely collected incident data and linking it with other residential aged care provider data enabling adjustment of rates by case-mix. A limitation is that the results may not be representative of all residential aged care homes as this cohort included RACFs from one provider group based in a major metropolitan city. While we considered key risk factors in the calculation of IRs, our current analysis did not consider the effect of other potentially relevant factors such as regionality (rural, remote settings) [18] and environmental factors due to a lack of data on these variables. Furthermore, the level of reporting of a fall may be different both between and within facilities, this was evident for all falls, although in our analysis we were able to adjust for facility variations. Additionally, our results demonstrated that there was limited variation in the incidence of falls resulting in injury or hospitalizations across the facilities, suggesting a similar quality of reporting across facilities.
Interpretation within the context of the wider literature
Our findings extend previous research on the rate of falls in residential aged care through the use of a robust and strong study design and the ability to incorporate case-mix adjustments including socio-demographic factors and relevant health conditions known to increase the risk of falls. In Australia, a recent population-based study in residential aged care across a similar time period demonstrated between 8.5% and 10.5% of residents had a hospitalization or emergency presentation for a fall in the period from 2014/5 to 2018/9 [19], which is comparable to our results of 9.8% from 2014 to 2019. However, this study did not explore the occurrence of all falls or injurious falls in RACFs.
Although women are more likely to experience fragility fractures than men [20–22], previous studies have presented mixed findings in relation to fall rates by sex for older adults in RACFs. While some studies have found women are at greater risk than men [6, 23], other studies have demonstrated no difference [7] and one study, like ours, found men to be more likely to fall [24]. One study highlighted for older adults living in the community the differences between sexes were associated with pain, balance and comorbidities and that further investigation is needed [25]. Although the reasons for the differences in the risk of falls by sex in RACFs remain unclear, we hypothesize that men may be less likely to ask for assistance and conduct riskier activities. It could also be that men were frailer as they had a shorter length of stay for admissions that resulted in a death compared to women in this study (median 386 days versus 512 days). However, further studies are needed to confirm these hypotheses including exploring the context, demographic and cultural characteristics that play roles in fall risks in residential aged care populations.
To the best of our knowledge, the present study is the first that has provided comprehensive fall incident data by resident type (respite versus permanent). The recent Royal Commission into Aged Care Quality and Safety in Australia drew attention to differentiating the perspective of respite clients [26] as respite residents report having different experiences, outcomes and may have unexpected adverse outcomes compared to permanent residents [27]. Our study has demonstrated large differences in fall rates for respite versus permanent residents, with respite residents having about three excess falls for every 1000 resident days. This finding has practical implications. Facilities with a higher proportion of respite residents who fall at greater rates will likely experience increased staff workloads and poorer outcomes for residents. There are a multitude of factors that may contribute to this higher rate of falls, including environmental factors as residents receiving respite will be unfamiliar with their new environment and other residents, be unsettled in a new setting and be less aware of processes for accessing staff. For these reasons, respite residents may require early, proactive risk assessment and intervention to reduce their risk of falls.
The overall trend in increased fall incidents in residential aged care over time has been demonstrated in another study that explored falls resulting in hospitalization over a similar 5-year period for residential aged care residents [19]. For our study, we also showed a larger increase in fall incidents in 2019, this may reflect the increased monitoring of quality across the aged care sectors in the last decade including the introduction of the National Aged Care Mandatory Quality Indicators Program for residential aged care in Australia that started in July 2019 [28]. Although reporting falls was not a mandatory quality indicator during our study period, the overall education and awareness of reporting incidents as a result of the quality indicators could have further increased the reporting of falls in general.
The variation in the rate of falls between facilities was the largest for all falls, however, only one out of the 25 facilities was outside the upper limits, although this level of variation was not seen for falls requiring hospitalization. Such serious falls require significant action, and hence documentation is more likely to be consistent across the facilities. The reporting of all falls may be influenced by differences in understanding of what constitutes a fall and if the fall was observed by a staff member. The comparison of fall rates between RACFs must take into account facility characteristics and resident case-mix to ensure accurate and meaningful conclusions are drawn. Interestingly, almost all facilities with >50% of respite admissions also had above the average risk-adjusted rate for all fall outcome measures, providing further evidence that respite residents need to be prioritized to reduce their risk of falls during their admission.
Implications for policy, practice and research
The results of our study have implications for residential aged care practice and policy. The study highlights the continued challenge of fall prevention and management in residential aged care, the significant burden to staff from an under-resourced workforce and the flow of health cost implications. The high fall rates in men and respite residents emphasize the need for additional investment and attention to these sub-populations. Anecdotally, aged care providers noted that on average each fall takes an additional 2 h of staff time, taking staff away from providing other fundamental requirements of care. For residents, the risk of falling can create anxiety, and this can be significantly heightened following minor falls, resulting in self-imposed restrictions impacting their quality of life. For residents experiencing more serious falls, the consequences of their mobility and activity levels may be substantial. Thus, it is clear that the high frequency of falls and high rates of fall-related injuries and hospitalization found confirm the need for future investment and attention to innovative and tailored strategies to further reduce the risk of falls to residents.
The Australian aged care sector is currently undergoing significant reforms including mandating staff requirements, changing funding assessments and introducing national quality indicators. The results of the current study feed directly into informing these changes. Our study provides evidence for the need to have increased funding to adequately resource respite stays (e.g. improved staffing arrangements) to ensure quality and safe care is provided and evidence that the national quality indicators need to consider the case-mix of residents when reporting fall incidents.
Falls are a well-known problem in older people, and despite our best efforts, it is unlikely to completely avoid the occurrence of falls. A fundamental way to assure and improve safety is to minimize the risk and consequences of falls by continuously monitoring individuals at increased risk, identifying and managing risk factors and providing appropriate care to those who will unfortunately inevitably fall. A critical approach to minimize fall incidents and their associated harm could be through a ‘predict and prevent approach’ (i.e. risk predictions followed by preventive interventions). The increasing availability of routinely collected, longitudinal electronic aged care data provides us with a unique opportunity to utilize big data and advanced analytics for robust and accurate prediction and monitoring of falls in RACFs.
The current study demonstrated the value of good information technology systems that have the capacity to link data sources and deliver detailed information to monitor resident outcomes, with the capacity to determine whether interventions are effective over time [29]. The next stage of this technology is the development of dynamic predictive tools and real-time clinical decision support dashboards to reduce the likelihood of falls, particularly in vulnerable resident groups [30].
Conclusion
Falls are frequent in RACFs, often resulting in injury and hospitalization with nearly 60% of residents falling at least once and one in four requiring hospital admission. The study provided robust and comprehensive information that may help inform future initiatives to minimize the incidence of falls in RACFs.
Supplementary material
Supplementary material is available at International Journal for Quality in Health Care online.
Acknowledgements
We thank our partners and collaborators including Anglicare, Northern Sydney Local Health District, Sydney North Primary Health Network, the Deeble Institute for Health Policy Research and the Australian Aged Care Quality and Safety Commission.
Funding
The study was part of a partnership project funded by the Australian National Health and Medical Research Council Partnership Project Grant in partnership with Anglicare (No. 1170898).
Authors’ contribution
N.W., K.L.S., A.D.N., J.S. and M.Z.R. are involved in the conception and design of the study; N.W. is involved in the data analysis with input from other team members; N.W. is involved in the initial manuscript drafting; all authors are involved in the data interpretation, the critical revision and the final approval for publication.
Ethics and other permissions
The study received ethical approval from the Macquarie University Human Research Ethics Committee (reference no. 52019614412614).
Data sharing statement
The data that support the findings of this study are used under licence for the current study and so are not publicly available. Data are however available from the authors upon reasonable request and with permission of the data custodian.
