


Abstract
This study investigates the impact on redistributive preferences of one pervasive yet underexplored type of shock: natural disasters. Previous research has focused on smaller, endogenous shocks that do not share two key features of disasters: they are abrupt and collective experiences. The literature on economic shocks suggests they lead to increased demand for redistribution. Nevertheless, disasters are such abrupt ruptures that they could inhibit an increase in demand for redistribution because they may trigger psychological needs to justify the status quo. Further, their collective nature may push people to substitute government-based help for community or religious-based social insurance. In light of these conflicting accounts, I argue that how surprising a disaster is determines whether it is a deterrent or a catalyst of support for redistribution. To test my argument, I link World Values Survey data to information on subnational risk to natural disasters and find that risk of surprising disasters such as earthquakes and tsunamis increases demand for redistribution but risk of predictable disasters does not. The relationship is robust to controlling for a series of individual and sub-national district characteristics. An event study of earthquake incidence shows a similar pattern: more surprising earthquakes—those impacting rarely hit districts—drive increases in demand for redistribution.
Introduction
Catastrophes such as natural disasters or epidemics are on the rise globally. While a growing body of work seeks to understand their socio-economic impacts and how to mitigate them (Aldrich, 2012; Scheidel, 2018; see Tierney, 2007; Arcaya, Raker Waters, 2020; for a review), we know surprisingly little about how disasters may affect preferences about inequality. This oversight is surprising as there is a pressing need to connect the study of disasters to the core issues that have long preoccupied sociologists, namely social inequality and social change (Arcaya, Raker Waters, 2020). Closely related to the purpose of this article, an emerging literature studies the impact of different types of economic shocks such as financial crises or job loss on attitudes towards inequality (see Margalit, 2019 for a review). Notwithstanding, being exposed to these is endogenous to previous educational or occupational choices and the abrupt and collective nature of disasters may make them qualitatively different from these other shocks. Further, these previous studies are limited in their external validity as they mostly focus on the Western world.
Natural disasters could affect attitudes towards inequality in several ways. The literature on economic shocks has mainly focused on self-interest explanations based on classical political economy theories predicting that a shock to material circumstances increases demand for redistribution (e.g. Margalit, 2013; Naumann, Buss and Bähr, 2016). Nevertheless, natural disasters are qualitatively different to these other shocks as they are collective and abrupt events. Indeed, the theory of system justification predicts that such ruptures could activate a need to justify the status quo. Further, disasters have been found to increase religiosity which could lead to an increased willingness to accept disparities and to build religious-based social insurance (Scheve and Stasavage, 2006). In light of this, an important question is whether natural disasters are catalysts or deterrents of support for equality. I argue that whether disasters are surprising is key to understand how they shape demand for redistribution. More concretely, a surprising shock is less likely to trigger narratives of personal responsibility than more predictable shocks that one could have prepared for (Starr, Rudman and Whipple, 1976; Sunstein, 1997). Relatedly, given the higher difficulty of personal responsibility narratives to emerge, surprising shocks may also facilitate a better understanding of the plight of the poor. In contrast, narratives of preparedness and bootstrap mentality that arise in the context of more predictable disasters may inhibit such an understanding.
To test my argument, I match World Values Survey (WVS) data spanning from 1981 until 2014. I use the former to exploit within country variation in proximity to disaster risk. Namely, distance to high intensity earthquake zones, tropical storm zones, tsunami risk, and volcano risk. I find that individuals living closer to earthquake risk have higher preferences for redistribution. The relationship is robust to controlling for a series of sub-national district characteristics such as absolute latitude, distance to the coast, or level of local development. Results also hold when using risk of other unpredictable disasters such as tsunamis and volcanoes instead of earthquakes but there is no relationship when looking at risk of predictable disasters such as tropical storms. To move beyond correlations, I use data compiled by Bentzen (2019) that code a subnational district as hit by an earthquake in a given year if the epicentre was within a 100 kilometre radius of the district’s border. I run an event study at the subnational district level and find that aggregate redistributive preferences increase whenever earthquakes hit the district between WVS waves. Crucially, results are driven by more surprising earthquakes, which I define as those landing on rarely hit districts. Placebo tests show that future earthquakes do not predict current redistributive preferences, suggesting district-level trends correlating with earthquake incidence and preferences for redistribution cannot explain the results.
My findings highlight an overlooked aspect in the literature investigating how shocks impact demand for redistribution and attitudes towards inequality: their surprisingness. Explanations based on self-interest, values acquired during early socialization, or system justification alone fail to explain how natural disasters may impact redistributive preferences if we do not consider how narratives of responsibility and preparedness may be less likely to emerge when disasters take people by surprise. My results have important implications for social change in the 21st century: contrary to claims in popular discourse (e.g., Mounk, 2017), large catastrophes do not necessarily bring about a reckoning about inequality if people get used to them and become less surprising.
Theory and Related Literature
The literature on attitudes towards inequality has traditionally focused on whether it is self-interest or deep-rooted ideology that explains redistributive preferences (e.g., Downs, 1957; Marx, 2005 [1859]) and the question continues to drive much of the literature (e.g., Iversen and Soskice, 2001; Moene and Wallerstein, 2001; Cusack, Iversen Rehm, 2006; Jæger, 2006; Rehm, 2009; Kulin and Svallfors, 2013). Recently, researchers have begun to pay attention to economic shocks such as the Great Recession (e.g., Margalit, 2013; Fisman, Jakiela Kariv, 2015; Limberg, 2020) or job loss (Naumann, Buss Bähr, 2016) to investigate if redistributive preferences are malleable and not exclusively shaped by deep-rooted values acquired early on in life. This literature on shocks has mainly focused on how these events impact preferences via the self-interest mechanism (e.g., Naumann, Buss Bähr, 2016; Gidron and Mijs, 2019; Margalit, 2019) with notable exceptions that find little impact of the Great Recession on preferences (Brooks and Manza, 2013). The evidence is mixed on whether these shocks generate lasting changes in preferences: some works suggest that only large, substantial shocks can do so (O’Grady, 2019), others find effects for smaller economic shocks (Owens and Pedulla, 2014; Naumann, Buss Bähr, 2016), and others find generally no link (Wehl, 2019). Further, crises and threatening events do not necessarily turn individuals to the left (e.g., Durr, 1993; Stevenson, 2001; Jäckle and König, 2018). Finally, exposure to unemployment and the negative consequences of a financial crisis are arguably not random.
Within this literature, the attention paid to natural disasters is scant. Nevertheless, the few studies that exist find contradictory evidence. Exploiting an earthquake in Italy as a natural experiment, Gualtieri, Nicolini and Sabatini (2019) find the disaster increased demand for redistribution. In contrast, Pahontu (2020) finds that being exposed to risk of large hurricanes in the United States causes people to search for private insurance solutions and turn against redistribution.
In the present study, I argue that past research has overlooked that natural disasters may be qualitatively different from other economic shocks that have captured most of the attention in the literature on attitudes towards inequality. Namely, disasters are often abrupt and collective ruptures that can change lives overnight. Next, I discuss theoretical mechanisms linked to these two features that have been proposed in sociology and psychology leading to opposing hypotheses on the relationship between natural disasters and attitudes towards inequality. Finally, I introduce my argument for why the element of surprise matters.
Natural Disasters: Deterrents or Catalysts?
There are theoretical reasons to expect disasters to be deterrents of support for equality. Natural disasters are abrupt, overnight disruptions. As such, they may lead to acute psychological distress and threaten people’s worldview (Bland et al., 1996). According to system justification theory (Jost, Banaji and Nosek, 2004), ‘people are most likely to defend the status quo (and, conversely, least likely to support change) when the system has been threatened, when they feel dependent on or unable to leave a system, and when they lack personal control’ (Kay and Friesen, 2011: p. 362). Indeed, the theory has been applied to explain reactions to natural disasters that seem to justify the status quo (Napier et al., 2006). Second, another reason to expect natural disasters to be deterrents of support for equality is that they are a particularly collective experience (Pennebaker and Harber, 1993). Compared to other economic shocks, disasters affect everyone in a locality overnight. Indeed, disasters have been found to trigger a relational process of increased social cohesion and ‘collective coping’ whereby social bonds tighten and identification with the local community surges (Pennebaker and Harber, 1993; Segal, Jong and Halberstadt, 2018). This heightened sense of community may in turn decrease demand for redistribution: according to research in political economy, there is a substitution effect between the social insurance one can get from their support system (either close social bonds in their community or via participation in religious communities) versus what they can get from the state (Scheve and Stasavage, 2006; Alesina and Giuliano, 2011). There are strong reasons to expect this substitution effect in the context of natural disasters since they have been found to also increase religiosity (Bentzen, 2019).
Alternatively, there are also reasons to expect disasters to be catalysts of demand for redistribution. First, they are abrupt disruptions to material circumstances that are expected to increase demand for redistribution (Rehm, Hacker and Schlesinger, 2012; Owens and Pedulla, 2014; Naumann, Buss Bähr, 2016; Margalit, 2019). Further, disasters may facilitate a better understanding of the plight of the poor. According to Mijs (2018, 2019), the rich and the poor lead increasingly separate lives and a lack of common experiences mat be making everyone more accepting of the status quo. A natural disaster could arguably break this process if it forces people to come together and learn more about each other, which may make people understand better socio-economic barriers and be less accepting of disparities. This process is relational in nature and not necessarily the same as providing abstract information about the true extent of national-level inequality, which has shown inconclusive effects on redistributive preferences (Kuziemko et al., 2015; Alesina, Stantcheva and Teso, 2018). Rather than abstract information, the argument is about more engaged experiences. Indeed, emerging evidence points that increased interactions across income groups affect attitudes towards inequality among the advantaged (Mo and Conn, 2018). Likewise, qualitative evidence suggests it also impacts attitudes towards inequality among the disadvantaged. In an ethnographic study in rural India, Kruks-Wisner (2018) finds that poor citizens are more likely to make claims of the state when they are more exposed to disparities. A natural disaster could, similarly, trigger more exposure to others’ plight and increase demands for redistribution and state provision of social welfare.
The Element of Surprise
In light of these divided theoretical perspectives, my argument is that the element of surprise is key to discern whether disasters become deterrents or catalysts of demand for redistribution. The extent to which a disaster comes as a surprise could matter because several psychological theories predict that people are more likely to accept risks that are predictable than those that come as a surprise (Starr, 1969; Starr, Rudman and Whipple, 1976; Sunstein, 1997). Indeed, experimental research shows that individuals tend to find inequality justifiable when it stems out of a choice to take a risk (Cappelen et al., 2013). In the context of a disaster that people are warned about weeks in advance that could translate into a higher belief in personal responsibility relative to a surprising disaster.
The mechanism need not be exclusively psychological but also sociological. As Swidler (1986) suggests, during disruptive, unsettled times people develop and establish new styles or strategies of action (an idea also present in Tierney’s (2007) influential review of sociological perspectives on disasters). The collective nature of these catastrophes makes them ‘moments of realization that the very contours of the social and political world have been transformed’ (Wagner‐Pacifici, 2010: p. 1383). I argue that different narratives can emerge and diffuse in surprising versus unsurprising disasters. Indeed, there is evidence in the qualitative record showing that more predictable disasters such as tropical storms spark narratives of personal responsibility. For instance, in their study of Hurricane Ike, Richardson and Maninger (2016) find a theme of ‘bootstrap mentality’. In the words of one of their participants, ‘I think this is a hardworking community that’s willing to roll our sleeves up, get to work, and get the job done’ (Richardson and Maninger, 2016: p. 115). In contrast, unpredictable disasters such as wildfires or earthquakes seem to come accompanied by perceptions that nothing could have been done to avoid damage and a belief that the degree to which they were impacted or spared was due to luck (Becker et al., 2013; Eriksen and Wilkinson, 2017; Massazza, Brewin and Joffe, 2019). In sum, surprising disasters leave less room for personal choice and responsibility in avoiding harm and perhaps the destruction they cause is interpreted as more unfair than the one caused by predictable disasters one could have prepared for. Ultimately, the absence of a focus on responsibility and preparedness when a disaster takes people by surprise could be making the mayhem caused by such disasters to be seen as more unfair than that caused by others that are less surprising. We know this distinction is important and that it is usually inequality deemed as unfair what drives demand for redistribution (Alesina and La Ferrara, 2005; Ahrens, 2020; Cappelen, Falch and Tungodden, 2020; García‐Sánchez et al., 2020).
In sum, these theoretical arguments lead me to make an important distinction depending on the surprising of the disaster and I thus hypothesize that an unsurprising natural disaster will not lead to an increase in support for equality but that a surprising natural disaster will.
Data
Outcome and Covariates
Data on redistributive preferences come from the pooled WVS spanning the years 1981–2014 and contain information on 341,271 individuals interviewed in 101 countries. Only those individuals for whom information on their subnational district is also available are included in the analysis.
The main dependent variable is a question asking respondents to place themselves on a scale from 1 to 10 where 1 means ‘We need larger income differences as incentives’ and 10 is ‘Incomes should be made more equal’. This question has been asked in most WVS waves and thus there is information on 313,927 individuals’ preferences from around 1,000 subnational districts in over 90 countries. As can be seen in Figure 1’s top panel, the parts of the world included in the analysis (in blue) cover most of the inhabited world. A second question sometimes used in research on redistributive preferences asks whether it is a fundamental characteristic of democracy that the government taxes the rich to subsidize the poor, but it could not be used here because it is asked in too few waves and for a smaller subset of countries. Further, as shown in Figure 1’s top panel, my sample includes both democracies and non-democracies. Studies on redistributive preferences increasingly study demand for redistribution comparatively including both democratic and non-democratic in their samples. This approach has allowed to critically test some assumptions in the literature: for instance, Dion and Birchfield (2010) find that income does not negatively correlate with demand for redistribution across the world. In other instances, nevertheless, comparative analysis has yielded similar patterns irrespective of regime type (e.g., Carnes and Mares, 2015; Limberg, 2020). We know relatively little about the impact of natural disasters on redistributive preferences, and virtually nothing about the extent to which there may be a common pattern irrespective of regime type. My strategy will thus be to use the whole sample in the main analysis but re-run the analysis for the subsample of democracies as a robustness check.
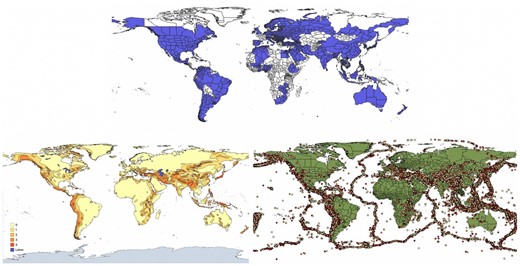
Visualizing the data. Notes: The top panel shows in colour subnational districts included in the analyses, the rest in white. The bottom left panel shows earthquake zones from 0 to 4 (high intensity zones are 3 and 4). The bottom right panel shows the database of earthquakes that occurred from 1971 to 2014. Source: Author’s elaboration from World Values Survey Data, earthquake risk zones from the United Nations Environment Programme (UNEP), and the earthquake database from the US Geological Survey (USGS).
Data on Disaster Risk
Data on the risk of earthquakes were obtained from Bentzen (2019) who compiled it from the United Nations Environment Programme (UNEP), more specifically its Global Resource Information Database on earthquake intensity zones. These zones classify areas in the earth by their risk of experiencing an earthquake and are calculated based on the frequency and intensity of past earthquakes. Calculations were made in 1988 based on expectations for a period of 50 years (Munich Reinsurance Company, 1998). The zones are based on the probability of earthquake occurrence along five intensity levels (spanning from 0 to intensity level 4), which originate from the 12-point Modified Mercalli Intensity Scale. Details on the process of linking these data to WVS data is available in the Supplementary Appendix.
The dataset of tsunami events comes from the ‘Global Historical Tsunami Events and Runups’ database from the National Geo-physical Data Center.1 Tropical storm risk data are based on a map of tropical storm intensity zones derived from the Munich Reinsurance Company’s (1998) World Map of Natural Hazards. The intensity zones are calculated based on the probability that a storm falls within five different speed categories on the Saffir–Simpson Hurricane Scale. Data on volcanic risk are based on volcanic eruption intensity zones. Original data come from a database of 1,420 volcanic eruptions that span approximately the last 10,000 years (Global Volcanism Program, 2013) and transformed into volcanic eruption intensity zones and made readily available by Siebert, Simkin and Kimberly (2011) and Bentzen (2019).
The main independent variable constructed from this data is Dist(high intensity disaster zone). For the case of earthquakes, the variable measures the distance in 1,000 kilometres to the closest high intensity earthquake zone. The variable is coded as 0 for subnational districts that fall within zones 3 or 4 on the earthquake intensity zones mapped at the bottom left in Figure 1. The mean distance is 483 kilometres and the correlation between this distance measure and the actual damages of earthquakes is low and statistically insignificant.
For the case of tsunamis, I used Geographic Information Systems (GIS) software to calculate the geodesic distance from the centroid of each sub-national district to the nearest tsunami ever recorded.
For tropical storms and volcanoes, I used Bentzen (2019)’s measures of subnational district distance to high intensity tropical storm zones and volcanic zones respectively.
Data on Earthquake Incidence
Data on earthquake incidence also come from Bentzen (2019). She compiled it from the Advanced National Seismic System and the US Geological Survey (USGS), who keep an up-to-date earthquake catalogue that spans over a century. The collection includes information on the location, timing, and scale of every earthquake that occurred since 1898. She used every earthquake of magnitude 6 and above that hit between 1971 and 2014. The final sample contains 70,627 earthquakes and is graphically depicted in Figure 1’s bottom right panel.
There are two main independent variables constructed from this dataset. The first one is a dummy capturing whether one or more earthquakes hit a given district between WVS waves. The second measure captures the number of earthquakes that hit the district between waves. Further details on the process of linking WVS information on location of interview (usually first administrative division) to the earthquake database are included in the Supplementary Appendix.
Defining how a district is considered as being hit by an earthquake is central to the analysis. Here I follow the decision rule employed by Bentzen (2019) who uses a similar empirical strategy to investigate how disasters affect religiosity. Using GIS techniques, she creates a buffer of 100 kilometres around the border of each subnational district. A locality is hit by a given disaster if the earthquake’s epicentre is within that buffer. Creating this buffer is important to capture the effects of disasters. Simply classifying a district as hit if the epicentre fell inside its borders would miss earthquakes that hit outside the borders but whose effects were felt in the district nevertheless.
Empirical Strategy
To assess the validity of my strategy, I conduct a balance test for several characteristics at the individual level (gender, age, education, income, and whether respondent is unemployed) and subnational district level (night lights per square kilometre). I add country and year of interview fixed effects as in the empirical specification above to ensure I compare individuals within the same country and at the same time. Table 1 shows that individual and district characteristics are balanced except for gender. The coefficient for being male is statistically significant, albeit rather small. Crucially, respondents do not seem to be richer or more educated in disaster prone areas nor do we see more night lights per square kilometre in these areas.
Balance in covariates
| Covariate | Observations | Covariate mean | Estimate | Std error | P-value |
|---|---|---|---|---|---|
| Male | 248,321 | 0.468 | –0.006 | 0.002 | 0.010 |
| Age | 249,924 | 40.996 | 0.000 | 0.000 | 0.714 |
| Income decile | 227,800 | 4.557 | 0.000 | 0.001 | 0.809 |
| Education | 219,989 | 4.709 | –0.000 | 0.001 | 0.918 |
| Unemployed | 250,330 | 0.091 | 0.005 | 0.006 | 0.408 |
| Night lights per square kilometre | 248,864 | 1.206 × 10⁻⁴ | 0.982 | 0564 | 0.082 |
Notes: The table presents coefficients for five OLS regressions of individual-level characteristics and one subnational-level characteristic (level of economic development proxied by night lights per square kilometre) on the earthquake risk indicator. Standard errors clustered at the first administrative division level. All specifications include country-by-year fixed effects.
As a step beyond these correlations, I exploit data on earthquake incidence and the time dimension of the WVS data. To do so, I once again follow closely the empirical strategy employed by Bentzen (2019). In her study of natural disasters and religiosity, she constructs a synthetic panel of WVS subnational districts and combines that with information on the incidence of earthquakes across the world. The analysis in this section can be considered a type of event study, which was initially developed by economists but has since been applied more widely to study the impact of a set of events—such as natural disasters or policy changes—on a wide range of outcomes.
Since the analysis here is at the subnational district level, it is necessary to aggregate the information on individuals’ redistributive preferences to the district level. To do so, several steps are taken so that the aggregation takes into account individual-level controls and district weights in WVS. The first step is to run a regression of redistributive preferences on the set of individual controls used in the individual-level empirical strategy using the individual-level dataset. The residuals from that regression are then multiplied by the appropriate weight and then averaged at the subnational district level. Not every district included in the individual-level analysis can be included in the district-level analysis since not all localities are sampled more than once. In the final synthetic panel there are 366 subnational districts measured twice or more across 48 countries. The panel is unbalanced since some districts are surveyed within less than 3 years whereas others are surveyed for a second time over a decade after the first time.
Results
Individual Level
As outlined in the previous section, I assess the relationship between natural disasters and attitudes towards inequality in two ways: an individual-level analysis and an event study at the subnational district level. The former exploits within country variation in distance to different high intensity disaster zones. In Table 2, I report results of this individual-level, cross-district analysis for the case of earthquake risk. Across countries, people closer to high earthquake risk are more likely to think that incomes should be made more equal rather than large differences being necessary to incentivize effort. Results are robust to country-by-year fixed effects and controls for individual characteristics that are in place across all specifications. The first column of Table 2 shows baseline results, in column (2) I add a proxy for local development (average nighttime lights at the first administrative division level) and dummies for educational level because the level of economic development may be correlated with demand for redistribution. In column (3) I add a quadratic term as a robustness check that the distance measure is working as expected, that is, with diminishing impact as individuals are further away. Reassuringly, results show the effect is indeed non-linear in distance and the effect is less pronounced the further away an individual is from the high intensity earthquake zones. Finally, in column (4) I fit an interaction model that allows for the relationship to vary depending on whether a country is having high income or not. Results suggest that the effect appears to be somewhat stronger in rich countries, but the difference is imprecisely estimated and no firm conclusions can be made.
Main individual level results
| Variables | Incomes should be made more equal | |||
|---|---|---|---|---|
| (1) | (2) | (3) | (4) | |
| Distance to earthquake zones 3–4 | –0.193*** | –0.216*** | –0.433*** | –0.401** |
| [0.064] | [0.061] | [0.157] | [0.164] | |
| Distance squared | 0.110* | 0.104* | ||
| [0.056] | [0.057] | |||
| Distance to earthquake zones 3–4*High income | –0.158 | |||
| [0.174] | ||||
| Observations | 235,670 | 210,416 | 235,670 | 235,670 |
| R-squared | 0.145 | 0.147 | 0.145 | 0.145 |
| Baseline controls | Y | Y | Y | Y |
| Regions | 755 | 740 | 755 | 755 |
| Impact at 500 kilometre | –0.378 | –0.349 | ||
Notes: Standard errors in brackets, clustered at the first administrative division level. All specifications include country-by-year fixed effects and controls for individual characteristics. Model (1) shows baseline results. Model (2) controls for district-level economic development. Model (3) adds squared distance to high intensity earthquake zones.
P < 0.01,
P < 0.05,
P < 0.1.
Figure 2 presents a binned scatter plot that graphically depicts the results in Table 2’s column 2. As a robustness check, in Supplementary Appendix B, I systematically remove one country and find that results are not driven by any single country. The main take away from this analysis is that people living in areas with high earthquake risk are more in favour of redistribution than those living further away within the same country, and that the relationship holds worldwide. More specifically, individuals living in a subnational district located 1,000 kilometres closer to a high intensity earthquake zone are between 1.93 and 4.01 percentage points more egalitarian (the mean level of responses to the 10-point redistributive preference question is 5.22). As a robustness check, I consider whether my results hold when considering only the subsample of countries that were considered democracies for the WVS study period (polity IV score 6 or higher). In Supplementary Appendix D, I show that results in fact strengthen. For that subsample of countries, individuals living in a subnational district located 1,000 kilometres closer to a high intensity earthquake zone are between 2.95 and 6.99 percentage points more supportive of redistribution.
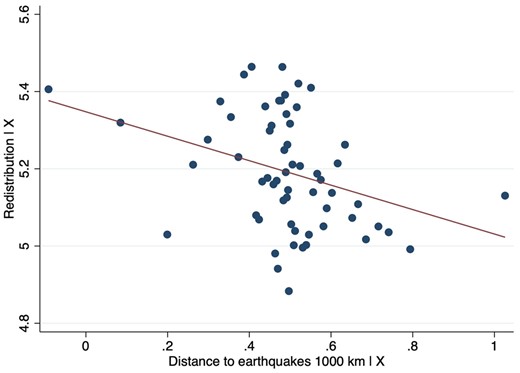
Support for equality and earthquake risk. Notes: The figure presents a binned scatter plot of the main outcome and distance to high intensity earthquake zones, taking into account covariates. Individuals are grouped into 60 equally sized bins.
Source: Author’s elaboration from World Value Surveys data linked to earthquake risk data compiled by Bentzen (2019).
Next, I turn to consider the relationship between the risk of other disasters and demand for redistribution. I substitute the main variable of distance to high intensity to earthquake zones with measures of exposure to other disasters, namely tropical storms, volcanoes, and tsunamis. Table 3 reports the results, which suggest individuals are more supportive of redistribution when they are in areas close to earthquakes and tsunamis, and especially so when in areas that are close to both. Risk of volcanic eruptions is shown to also be correlated with higher preferences for redistribution, albeit only for districts within 1,000 kilometres of the high risk of eruption. Tropical storms do not appear to be correlated with support for redistribution. These results are consistent with the explanation that more surprising disasters are the ones likely to trigger an increase in preferences for redistribution. While earthquakes and volcanic eruptions have proven rather difficult for scientists to predict, reliable methods have been developed to forecast the path of tropical storms/hurricanes. Further, their paths are often featured by media to warn the local population weeks prior to the event.2
Different disaster types
| Variables | (1) | (2) | (3) | (4) | (5) | (6) | (7) | (8) |
|---|---|---|---|---|---|---|---|---|
| Incomes should be made more equal (1–10) | ||||||||
| Dist (Disaster) | –0.193*** | –0.210** | –0.306*** | –0.233*** | –0.051 | –0.729*** | –0.062 | 0.183 |
| [–0.064] | [–0.088] | [–0.083] | [–0.08] | [–0.059] | [–0.265] | [–0.069] | [–0.301] | |
| Observations | 235,670 | 235,670 | 23,670 | 235,670 | 235,670 | 138,441 | 235,670 | 83,051 |
| R-squared | 0.145 | 0.145 | 0.145 | 0.145 | 0.145 | 0.096 | 0.145 | 0.05 |
| Disaster | Earthquake | Tsunami | Avg dis (tsunamis and quakes) | Min dis (Tsunamis and quakes) | Volcano | Volcano | Tropical storm | Tropical storm |
| Baseline controls | Y | Y | Y | Y | Y | Y | Y | Y |
| Sample | Full | Full | Full | Full | Full | <1,000 kilometre | Full | <1,000 kilometre |
| Districts | 755 | 755 | 755 | 755 | 755 | 422 | 755 | 190 |
Notes: Standard errors in brackets, clustered at the first administrative division level.
P < 0.01,
P < 0.05,
P < 0.1.
This analysis using different disaster types adds further confidence that the main results for earthquake risk are not spurious because, given the relatively low correlation between the distance-based disaster risk measures I use (shown in Supplementary Appendix G), it becomes less likely that the main results are simply due to the distance of high intensity earthquake zones being correlated with some other variable.
All in all, the evidence presented here suggests that the predictability of a disaster matters. In the case of unpredictable disasters such as earthquakes, tsunamis, and volcanoes, I find a positive relationship between proximity to disaster risk and redistributive preferences. Nevertheless, I find no relationship between the risk of a major predictable disaster, namely high intensity tropical storms, and demand for redistribution.
Earthquake Event Study
To move beyond these within country correlations, I conduct an event study using data on earthquake incidence. Table 4 shows results for the district-level event study. Across both Panels A and B, the dependent variable is the change in aggregate redistributive preferences at the district level. As explained when outlining the empirical strategy for the district-level analysis, individual-level controls are accounted for in the aggregation process. Earthquake is the independent variable: in columns (1) and (2) it is a dummy indicating whether one or more earthquakes hit the district between WVS waves and in columns (3) and (4) it captures the number of earthquakes that hit the district between waves instead. In columns (2) and (4), I add district-level controls.
Earthquake event study
| Type of independent variable: | Dichotomous | # of earthquakes | ||
|---|---|---|---|---|
| (1) | (2) | (3) | (4) | |
| Variables | Δredistribution | |||
| (A) Baseline, first-difference estimation of earthquakes on demand for redistribution | ||||
| Earthquake | 0.511+ | 0.689* | 0.151 | 0.213 |
| [0.323] | [0.337] | [0.147] | [0.175] | |
| Observations | 366 | 335 | 366 | 335 |
| No. of countries | 29 | 26 | 29 | 26 |
| R-squared | 0.076 | 0.075 | 0.072 | 0.069 |
| Baseline controls | Y | Y | Y | Y |
| District dev controls | N | Y | N | Y |
| (B) Interaction with frequently hit districts | ||||
| Earthquake | 0.663+ | 0.824** | 0.493* | 0.609** |
| [0.407] | [0.381] | [0.248] | [0.260] | |
| Earthquake* frequently hit district | –0.668 | –0.697 | –0.620** | –0.744** |
| [0.499] | [0.494] | [0.249] | [0.241] | |
| Observations | 366 | 335 | 366 | 335 |
| No. of countries | 29 | 26 | 29 | 26 |
| R-squared | 0.078 | 0.077 | 0.081 | 0.081 |
| Baseline controls | Y | Y | Y | Y |
| District dev controls | N | Y | N | Y |
Notes: Standard errors in brackets, clustered at the country level. Dependent variable across all columns: change in average redistribution preferences. Aggregate redistribution preferences at the district level are based on responses to the question capturing the extent to which individuals agree that ‘Incomes should be made more equal’ (as opposed to ‘We need larger income differences as incentives’). Residuals from a regression of the redistribution question on individual controls are used to calculate district level aggregates. In columns (1) and (2) the main independent variable, earthquake, is a dummy indicating whether one or more earthquakes hit the district between WVS waves. In columns (3) and (4) earthquake measures the number of earthquakes that hit between waves.
P < 0.01,
P < 0.05,
P < 0.1.
The results in Panel A are inconclusive, even though when earthquake incidence is measured with a dichotomous 0–1 variable results hint that there may be an impact. Nevertheless, when I allow the effect to vary depending on whether an earthquake hit a subnational district frequently hit by earthquakes (Panel B), results show a clearer picture. They suggest how surprising an earthquake is matters. In this specification shown in Panel B, the coefficient of earthquake incidence is now significant, but the effect essentially disappears for less surprising earthquakes (those impacting frequently hit districts) in models (3) and (4). Taken together, this evidence suggests the effect of earthquakes is the most effective when these impact less frequently hit districts—i.e. when they are more surprising.
Robustness
In this section I conduct a placebo test of the event study, shown in Table 5. The rationale for this test is that it could be the case that what the event study presented above is capturing is just trends at the subnational district level that happen to correlate both with earthquake incidence and redistributive preferences. The placebo test substitutes the measure of earthquake incidence used in the analysis above—both the dichotomous measure and the number of earthquakes measure—for a measure of earthquakes that happened after the year of interview. A lack of significance in the re-estimated model would thus mean that the analysis presented passes this placebo test and offers a counterargument to this concern of spurious correlation. Reassuringly, future earthquakes do not predict past trends in redistributive preferences as coefficients are statistically insignificant and are not positive. Nevertheless, even though coefficients are not statistically significant in any specification, they are not zero and are negative. Perhaps an interpretation of this could be that earthquakes tend to take place in areas with lower support for redistribution, and earthquakes equalize support across regions with and without earthquakes.3
Placebo test: first difference estimates of future earthquakes on redistribution
| Dichotomous | No. of earthquakes | |||
|---|---|---|---|---|
| Variables | (1) | (2) | (3) | (4) |
| Δredistribution | ||||
| Earthquake t + 1 | –0.73 | –0.498 | –0.576 | –0.274 |
| [0.659] | [0.450] | [0.438] | [0.284] | |
| Earthquake + 1*frequently hit district | 0.816 | 0.53 | 0.51 | 0.218 |
| [0.577] | [0.387] | [0.412] | [0.276] | |
| Observations | 286 | 255 | 286 | 255 |
| No. of countries | 26 | 23 | 26 | 23 |
| R-squared | 0.058 | 0.048 | 0.058 | 0.047 |
| Baseline controls | Y | Y | Y | Y |
| District dev controls | N | Y | N | Y |
Notes: Standard errors in brackets, clustered at the country level. Dependent variable across all columns: change in average redistribution preference. Aggregate redistribution preferences at the district level are based on responses to the question capturing the extent to which individuals agree that ‘Incomes should be made more equal’ (as opposed to ‘We need larger income differences as incentives’). Residuals from a regression of the redistribution question on individual controls are used to calculate district-level aggregates. In columns (1) and (2) the main independent variable, earthquake, is a dummy indicating whether one or more earthquakes hit the district between WVS waves. In columns (3) and (4) earthquake measures the number of earthquakes that hit between waves.
P < 0.01,
P < 0.05,
P < 0.1.
All in all, I have shown that how surprising a natural disaster is seems to matter when it comes to its impact on attitudes towards inequality. My findings are compatible with the explanation that narratives of personal responsibility may be more likely under risk of predictable rather than surprising disasters. There is a correlation between within-country earthquake, tsunami, and volcano risk and demand for redistribution whereas there is none for risk of a major predictable disaster, namely tropical storms. This finding would be consistent with the idea that different cultures develop under the risk of different disasters depending on the extent to which preparing for their arrival in the weeks prior is possible or not. Further, results in the event study suggest that even in the case of earthquakes, which are unpredictable, their impact on redistributive preferences seems to be most prominent when they are the most surprising, that is, when they affect districts that are rarely hit by them.
Alternative Explanations: Changes in the Income Distribution?
Can increased inequality in the wake of natural disasters also explain my findings? To address this possibility, I have considered three things. First, for the subsample of countries that are members of the Organisation for Economic Co-operation and Development (OECD)(the only ones for which subnational inequality data is available),4 I test whether subnational regions with below and above average risk of different disasters have different average subnational Gini coefficients. Results, shown in Table 6, show that high risk areas tend to be more unequal except for the case of tsunami risk. Crucially, this cannot explain why I find a relationship between unpredictable disaster risk (earthquakes, tsunamis, and volcanoes) and none in the case of predictable disasters (tropical storms). Indeed, Bentzen (2019) finds that earthquakes and tropical storms have similar impacts in terms of death toll and material losses and that they seem to differ only in their predictability. Second, in Supplementary Appendix C, I conduct a balance test on the subsample of countries for which I have subnational Gini coefficients (OECD countries). I use the empirical strategy as in the main individual analysis but substitute the earthquake indicator as the outcome to test whether those places more at risk of earthquakes are also more unequal. As opposed to Table 6 that simply compares mean inequality between low and high disaster risk districts, this balance test includes country fixed effects and thus checks whether subnational district inequality predicts earthquake risk within countries, which is what I leverage in my analyses. Results show no evidence that earthquake risk correlates to inequality or respondent socio-economic characteristics such as respondent income, age, unemployment status, education, or marital status. Finally, I refer to the literature on how disasters impact inequality which is inconclusive. Some authors find natural disasters have no impact on the income distribution (Pleninger, 2020), others find they reduce inequality (Warr and Aung, 2019), while others find they increase it short-term but the effect disappears after 10 years (Yamamura, 2015). In a recent review of the interactions between inequality and the biosphere, Hamann et al. (2018) argue that in the case of understanding impacts of large catastrophes, ‘much depends on how people respond’ (Hamann et al., 2018: p. 68). In sum, these three pieces of evidence highlight that my findings are unlikely to be explained exclusively by changes in inequality.
Difference in inequality (Gini) between subnational regions with below and above average disaster risk, OECD countries only
| Disaster type | Observations | Low-risk mean | High-risk mean | Difference | P-value |
|---|---|---|---|---|---|
| Earthquakes | 197 | 0.2894356 | 0.3284582 | –0.0390226 | 0.0000 |
| Tsunamis | 197 | 0.3024371 | 0.314291 | –0.0118539 | 0.1469 |
| Tropical storms | 197 | 0.3024316 | 0.3209014 | –0.0184698 | 0.0217 |
| Volcanoes | 197 | 0.2918092 | 0.3317162 | –0.039907 | 0.0000 |
Notes: The table presents t-tests of Gini coefficients between subnational districts with low and high disaster risk for each disaster type. Data were available only for OECD countries.
Discussion
How humans respond to rising inequality in the age of increasingly common catastrophes such as natural disasters or epidemics is of urgent concern yet remains underexplored in the scholarly literature. Even though matters of inequality are of keen interest to sociologists, the discipline has been rather silent when it comes to understanding how disasters may influence support or opposition to it (Sauder, 2020). Established debates about whether economic shocks affect attitudes towards inequality—mainly via self-interest—do not necessarily apply to the case of natural disasters given that these are qualitatively different. I argue that how surprising these ruptures are may be key to understanding their impact on demand for redistribution.
Drawing on extensive disaster risk and incidence data matched to WVS data, I found that the surprisingness of natural disasters drives whether they spark demand for redistribution or not. I found that being closer to within-country earthquake, tsunami, and volcano risk is associated with higher preference for redistribution across the world. In contrast, risk of a major predictable disaster such as tropical storms is not. Results are robust to a balance test, a wide range of individual and district-level controls as well as to an event study. Subnational districts hit by earthquakes increase in aggregate redistributive preferences, and results are driven by more surprising earthquakes—those impacting rarely hit districts. Reassuringly, findings are robust to a placebo test as future earthquakes do not predict past changes in redistributive preferences.
What might explain this pattern? Previous work on economic downturns has found these can be either catalysts or deterrents of demand for redistribution and concerns for equality without much explanation for these conflicting findings. None of these perspectives coming from the study of economic shocks has paid much attention to the surprisingness of a shock. In line with theories from psychology and the sociology of risk and disasters, I argue that more predictable disasters trigger narratives of personal responsibility and preparedness, which inhibit demands for redistribution. In contrast, these are harder to justify the more surprising a disaster is.
The implications of my findings are substantial. As natural disasters are set to become more common due to climate change, my results suggest these catastrophes may not necessarily bring about a reckoning with inequality for all disaster types but rather for those that are unpredictable or hit in places less used to them. Narratives of personal responsibility are powerful frames that may inhibit a spark in demand for redistribution in the aftermath of a predictable disaster, despite material need.
This article is not without limitations. By using within-country variation in exposure to disasters, I move beyond country-level analyses and can account for a large range of individual and contextual factors. Nonetheless, the same individuals are not followed over time and the lag between WVS can be at times a decade. Further, first administrative divisions within each country were not constant across survey waves. Even though they were harmonized through a careful and sometimes manual process, this inconsistency in measurement may create too much noise. Finding significant results in the event study despite the noisy measurement suggests the true relationship may be even stronger. Finally, this study focuses on large and abrupt catastrophes—earthquakes, tsunamis, tropical storms, volcanoes—and we should be cautious before extrapolating to other disasters, for example the severe yet slow-unfolding effects of climate breakdown.
There is, however, a strong social scientific reason for the approach chosen here. Namely, social scientists have derived most of their conclusions on human behaviour from WEIRD societies (Western, Educated, Industrialized, Rich, and Democratic) and research suggests these populations are particularly unusual compared to the rest of the species (Henrich, Heine and Norenzayan, 2010). Given the importance of understanding what drives people to demand less inequality and worry about closing the income gap between rich and poor, it is particularly important to understand these patterns beyond the sub-sample of WEIRD societies. Within this framework, using exogenous adverse life events across the globe allows to study responses in attitudes towards inequality to common external shocks. An important avenue for future work could be to investigate the extent to which the impact of economics shocks commonly studied in the literature such as job loss or income drops may also depend on how surprising they are.
Footnotes
NOAA National Geophysical Data Center/World Data Service (2018), available at https://www.ngdc.noaa.gov/hazard/tsu.shtml.
According to the USGS, ‘neither the USGS nor any other scientists have ever predicted a major earthquake. We do not know how, and we do not expect to know how any time in the foreseeable future’. In contrast, scientists regularly forecast paths of tropical storms and hurricanes (e.g., forecasts by the National Hurricane Center in the United States or the World Meteorological Organization).
I thank anonymous reviewer 1 for this insight.
It is difficult to find comparable Gini coefficients at the subnational level, but such a dataset exists for countries that are members of the Organisation for Economic Co-operation and Development (OECD). The statistics can be downloaded from https://stats.oecd.org/index.aspx?queryid=58616.
Supplementary Data
Supplementary data are available at ESR online.
Acknowledgements
I would like to thank Arnout van de Rijt, Jonne Kamphorst, participants of the Analytical Sociology Colloquium at the European University Institute, and three anonymous reviewers for valuable comments on earlier versions of this article.
References
Global Volcanism Program. (
Munich Re (1998). Annual Review of Natural Catastrophes 1997, 1998 (132 pp.) Münchener Ruckversicherungs-Gesellschaft, Munich, Germany.
Irene Pañeda Fernández is a PhD researcher at the European University Institute’s Department of Political and Social Sciences and Research Fellow at the WZB Berlin Social Science Center’s Migration, Integration, and Transnationalization research unit. Her main research interests are social inequality and migration.
