


Abstract
Childbearing is at once deeply personal and shaped by social structure. It is also a site of profound inequality in the United States. Income inequality is an upstream cause of childbearing inequality, yet the evidence of the effect of income on reproduction is inconclusive. Previously, scholars primarily examined the introduction of means-tested relief to families with children. This limits analysis to families in poverty and provides insight only into the presence or absence of a policy. We analyze the Alaska Permanent Fund Dividend, which has provided all Alaskan residents with a substantial annual cash payment since 1982. The amount of the payment varies annually and is exogenous to individual Alaskans’ behavior and the state’s economy. We examine the effect of the cash transfers on fertility and abortion among a large and diverse population that has received varying amounts of money over time. We find the payments increase short-term fertility rates 1 and 2 years after disbursement, particularly among socioeconomically disadvantaged populations. Standardized to the 2010 household size distribution, two average payments relative to two minimum payments would result in a predicted fertility rate increase from 80.03 to 86.53 per 1,000 women age 15–44. The effect is largest for first births. The payments have no effect on the abortion rate. These results indicate the additional income removes economic constraints to reproductive health and autonomy and reduces reproductive inequality.
Introduction
Fertility is a deeply personal arena imbued with great significance in individuals’ lives and a site of inequalities shaped by structural forces. Most Americans hope to become parents (Hayford, 2009; Morgan and Rackin, 2010; Hartnett and Gemmill, 2020), and 85% of American women have children in their lifetimes (Livingston et al., 2015). However, structural factors shaped by systems of inequality affect individuals’ reproductive autonomy, or the ability to enact one’s reproductive goals, including to give birth to a desired, healthy child, or to not become pregnant or give birth (Ross and Solinger, 2017). Fertility inequality manifests in a number of ways, including having adequate access to contraception and abortion, being healthy enough to conceive and bear children, or having enough resources to bear and raise the number of children one desires. In the United States, these inequalities occur along racial and class lines: White and higher income people are, on average, better able to carry out their fertility goals (Ross and Solinger, 2017; Morgan and Rackin, 2010).
A main cause of fertility inequality is income and wealth inequality. Financial inequality has become exacerbated in recent decades, particularly in the United States (Piketty and Saez, 2006). Given large-scale changes like increasing automation and the devastation of the coronavirus pandemic, this inequality will likely continue to increase. Because the United States has a much less robust social safety net than other high-income countries (OECD, 2021), economic barriers may increasingly impede reproductive autonomy. Indeed, a 2018 national survey conducted by the New York Times found that individuals often cited economic constraints —the high cost of childcare (64%) or being unable to afford more children (44%)—as reasons they had fewer children than they desired (Miller, 2018). One intervention gaining popularity among policymakers is cash transfers, or a Universal Basic Income (UBI). The underlying idea behind a UBI is that directly increasing individuals’ or families’ resources could improve their well-being immediately across a range of outcomes (e.g., by increasing consumption of necessary items) and improve longer term outcomes (e.g., by allowing investment in education). This is the logic underlying the Child Tax Credit and conditional cash transfers the US government issued as a response to the pandemic.
Cash transfers could also alleviate fertility inequalities. Additional income could decrease many barriers to reproductive autonomy that reproductive justice activists and scholars identify, such as lack of access to abortion or fertility treatments or the inability to afford healthcare, that would enable a healthy pregnancy (Ross and Solinger, 2017; Luna and Luker, 2013; Ross et al., 2001, 2017; Roberts, 1999). Policymakers, by and large, are more interested in the effect of additional resources on fertility than on reproductive autonomy.
Although income is theorized to enable people to reach their childbearing goals—by seeking or avoiding childbearing—the causal effect of cash transfers on fertility is unclear. The primary experimental evidence in North America comes from Negative Income Tax studies conducted in four US cities and Manitoba, Quebec, in the 1960s and 1970s; however, these samples were small and produced inconsistent results (Kehrer and Wolin, 1979; Wolin, 1978; Forget, 2011). Since then, scholars have looked to natural experiments, such as changes in the tax code (e.g., the Earned Income Tax Credit, EITC), the tax exemption for dependents, or the implementation of near-cash transfers (e.g., Food Stamps). These policies are not universal; they primarily benefit people who are already parents and are heavily means-tested. However, one rich data source in this vein remains to be explored: annual exogenous cash transfers made to Alaskan residents.
Every year since 1982, each Alaskan resident has received a cash transfer through the Alaska Permanent Fund Dividend (PFD) program. The value of the payment is, as we and others argue (Hsieh, 2003; Kueng, 2018), exogenous to individual Alaskans’ behavior and the state’s economy. Thus, PFD payments serve as a repeated quasi-natural experiment for hundreds of thousands of Americans over nearly 30 years. We exploit two sources of payment variation within this program to consider the effect of additional income on childbearing. The first is the substantial year-to-year variation in the amount of the dividend payment. The second is variation in each year in the dividend paid to households depending on their size. These two sources of variation result in a payment range of $626–$16,832 (in 2010 dollars). Whereas most prior research considers the presence or absence of a policy, we can exploit this variation to also consider the generosity of the transfer. Using the Alaska case, we causally estimate the effect of universal cash transfers on fertility and abortion for the entire population of Alaska and for specific subgroups defined by race, education, age, marital status, and parity.
We contribute to literatures on cash transfer policies, fertility, and reproductive autonomy. Theoretically, we advance a new perspective on the effects of cash transfers on fertility and reproductive autonomy. We connect Gary Becker’s classic fertility theory based in rational choice to a reproductive justice framework, set forth by the SisterSong collective, rooted in the concept of reproductive autonomy. In doing so, we theorize how cash transfers will differentially affect demographic groups and how this will affect existing fertility inequalities. Empirically, by utilizing the only existing universal cash transfer program in the United States, we contribute to an understanding of how cash transfers affect fertility patterns at the population level and for a variety of subpopulations.
We ask the following research questions: (1) Do cash transfers affect fertility, and if so, how? (2) Are there particular groups of people whose fertility is more or less affected by a cash transfer, i.e., are there heterogeneous effects? (3) Do cash transfers affect the abortion rate, and, if so, how? We find that cash transfers cause an increase in short-term fertility rates 1 and 2 years after disbursement, particularly among disadvantaged populations. The amount of transfer required to induce an effect depends on household size. For instance, for households of size one or two, fertility increases at transfer levels of $3,000 and higher; for households of size three, the effect threshold is $4,000. The abortion rate is not affected by cash transfers. Overall, we interpret these results to indicate that cash transfers remove economic barriers to childbearing for some people and are thus a viable policy mechanism for reducing inequalities in fertility and reproductive autonomy.
Income, Fertility, and Reproductive Autonomy
No existing theoretical frameworks fully articulate the relationships among income, fertility, and reproductive autonomy. We combine and extend two existing frameworks—Becker’s rational choice theory on income and childbearing and reproductive justice scholars’ theorizing of reproductive autonomy—to create such a framework. We borrow from Becker a concrete examination of constraints to attaining fertility goals and how income can alter those constraints. We borrow from reproductive justice scholars a focus on reproductive autonomy and a more expansive understanding of what constrains this autonomy and results in fertility inequality. Through this new framework, we theorize the multiple pathways through which cash transfers can affect fertility outcomes and how cash transfers might reduce inequalities in reproductive autonomy and fertility outcomes.
The literature theorizing the causal relationship between income and fertility largely follows Becker’s theoretical framework. Becker argued that childbearing is a problem like any other kind of consumption, and people have both preferences and constraints. People’s preferences for children are their “demand” for children, or the “number of children desired when there are no obstacles to the production or prevention of children” (Becker, 2009: p.99). This articulation of demand for children aligns with reproductive justice scholars, though the two approaches have quite different epistemological bases. Where they differ is in their understanding of and focus on constraints, and this leads to a divergence in their predictions about the relationship between income increases and fertility outcomes.
For Becker, families face budget and time constraints; children cost money and time. Parents must allocate their income between consumption and childbearing, and their time between working, leisure, and caring for children. Complicating this is that parents care not just about the quantity of children, but also their “quality” and may choose to spend income not on having more children but on expenditures for fewer children.
For Becker, constraints to childbearing are the cost of children, the opportunity cost of time spent childrearing, and fecundity. Income, according to Becker, can only affect the first two, and how it affects fertility depends on the source of income. If the income source is nonwage, like the PFD, then the theory predicts fertility will rise: the cash transfer would increase the family’s income without altering the opportunity cost of time spent caring for children. If the income source is wages, the effect on fertility is ambiguous. A wage increase increases family income, which could increase fertility, but it also increases the opportunity cost of time spent providing childcare, which could result in a substitution effect. Whether the income effect or the substitution effect dominates is not evident without information regarding preferences (Becker, 1960, 2009; Becker and,Lewis, 1973). The PFD is given to every household member, including children, and therefore can be thought of as a “baby bonus.” Using Becker’s framework, this is a decrease in the fixed cost (i.e., not dependent on the number of children) of each child. Because the PFD is both nonwage and a decrease in the fixed cost of children, Becker’s theory suggests it will result in an increase in fertility.
Becker’s rational choice approach too narrowly construes constraints; in contrast, by focusing on reproductive autonomy, reproductive justice scholars can widen our analytic lens on how cash transfers will affect fertility. This perspective makes apparent that additional money will largely increase reproductive autonomy, yet additional income could result in more or fewer births depending on the types of constraints to reproductive autonomy they alleviate. For instance, reproductive autonomy is violated when access to desired contraception and abortion services is limited, and this may result in more births than desired. If additional income increases access to birth control, then cash transfers may result in a reduction of births. Conversely, reproductive autonomy is also violated when individuals have reduced fecundity due to poor health or lack of funds to care for a child; these constraints may result in fewer births than desired. Further, constraints may not be a proximate determinant of fertility. For instance, financial resources help enable stable relationships (Schneider et al., 2018) and marriage, which some couples see as requirements for childbearing. Other constraints, such as infertility for which no effective interventions exist, cannot be altered by additional money. Based on the reproductive justice framework, the effect of cash transfers on fertility at the population level will depend on what types of reproductive constraints predominate and whether these constraints can be altered by additional income.
Constraints to reproductive autonomy are shaped by social position and systems of inequality. As a stark example, only people of color, mentally ill people, and incarcerated people underwent forced sterilization in the United States. Given that constraints vary across demographic groups, we anticipate cash transfers will induce heterogeneous effects across groups.
In summary, Becker’s rational choice theory predicts cash transfers will increase fertility by increasing income without altering the opportunity cost of time spent childrearing, but a reproductive autonomy approach suggests the overall effect of cash transfers depends on the nature of the barriers to reproductive autonomy. Further, because reproductive autonomy is constrained more for marginalized groups, a reproductive justice approach suggests cash transfers could reduce fertility inequalities, which would be evident in heterogeneous effects of the transfer across social groups.
Nonwage Income Shocks
Findings of prior work on the effects of exogenous shocks to nonwage income on fertility in North America are mixed but, even when statistically significant, primarily modest in magnitude. They consistently show heterogeneous effects, though the specific populations more sensitive to transfers differ. The welfare literature generally finds larger effects on fertility for White women than women of color (Moffitt, 1998), with some exceptions. The introduction of Food Stamps in the 1960s and early 1970s resulted in small but statistically insignificant positive effects on fertility, which were greater for Black women than White women (Almond et al., 2011). The 1970s expansions to the EITC resulted in small reductions in higher order fertility for White women (Baughman and Dickert-Conlin, 2009). In the 1990s, the EITC increased first births among low-educated women, particularly women of color and married women (Baughman and Dickert-Conlin, 2003), and higher order births to married White women and unmarried women of color who were eligible for the benefit (Duchovny, 2001). The EITC decreased time to the second child, particularly among unmarried mothers, but did not affect completed fertility overall (Meckel, 2015). Higher base rates of welfare benefits had no effect on White unmarried mothers but increased the time to next birth for Black unmarried mothers (Grogger and Bronars, 2001).
The effects of a guaranteed income were not systematically tested until the late 1960s and 1970s when the US government funded a series of Negative Income Tax experiments. The experiments were conducted in four locations, and participants were randomly assigned to various combinations of base transfer amounts and tax rates. Simultaneously, a similar experiment was conducted in Manitoba, Canada. Fertility data, however, were only available for two sites - Gary, Indiana, and Manitoba. In Gary, the cash transfer decreased fertility (Kehrer and Wolin, 1979; Wolin, 1978) and in Manitoba, there were no fertility effects (Forget, 2011).
Cost of Children Shocks
Policies can manipulate the cost of children. Pro-natalist changes in the US tax code resulted in positive and statistically significant effects on fertility (Whittington et al., 1990; Whittington, 1992, 1993) (cf. Crump et al. 2011). Baby bonuses decrease the cost of a child and raise fertility and do so differentially by parity, marital status, age, and nonlabor income. Most relevant for our discussion, lower income women have a smaller increase in fertility than higher income women (Milligan, 2005). In contrast, family cap or child exclusion policies increase the cost of additional children for welfare recipients. These policies have mixed effects. Some studies find no meaningful effect (Grogger and Bronars, 2001; Kearney, 2004), whereas others find the family cap reduced fertility, particularly for Black women, though this research is controversial (Loury, 2000; Jagannathan and Camasso, 2003). Literature reviews indicate no or a modest relationship between welfare and fertility (Hoynes, 1996; Moffitt, 1998).
We would anticipate economic shocks would most greatly affect socioeconomically disadvantaged people, yet evidence does not consistently show this (Schneider, 2017; Schneider and Hastings, 2015; Gibson-Davis, 2009), perhaps because of the personal and cultural meaning of childbearing (Edin et al., 2004; Edin and Reed, 2005). Based on our theoretical framework, the existence of heterogeneous effects of income on fertility—whether fertility increases or decreases—would be an indication of differential barriers to reproductive autonomy and fertility inequality being reduced.
Economic Uncertainty
Classic fertility theory incorporates one’s sense of economic uncertainty. The Easterlin hypothesis argues that the relationship between fertility and income hinges on relative income. That is, people assess their economic well-being compared to that of their childhood and on the basis of that assessment determine whether or how many children to have. The hypothesis is empirically supported both intergenerationally (Elder, 1975) and through work assessing economic uncertainty more broadly (Schneider, 2015; Comolli, 2017; Fahlén and Oláh, 2018). Although this is a vibrant arena of current scholarship, including theorizing (Vignoli et al., 2020), the application of this insight to the case of universal cash transfers like the Alaska Permanent Fund is murky. It is not clear to what extent Alaskans estimate the size of the dividend and incorporate it into their budgeting. Sensitivity analyses below suggest they do not. In addition, while there is uncertainty as to the size of the dividend, there is certainty that the dividend will be distributed and will be positive.
Research Questions
Our empirical analysis focuses on childbearing and abortion, two events critical for enacting reproductive autonomy and assessing the “bottom line” of the effects of cash transfers. In addition, we have high-quality data on both events unlike other relevant outcomes (e.g., sexual and romantic relationships contraceptive preferences and access to contraception, access to medical assistance for subfecundity, and the acceptability of a pregnancy (Aiken et al., 2016).
We ask the following questions:
Research Question 1: Do cash transfers affect fertility, and if so, how?
Research Question 2: Are there particular groups of people whose fertility is affected more or less by cash transfers, i.e., are there heterogeneous effects?
Research Question # 3: Do cash transfers affect the abortion rate, and, if so, how?
Additional income may enable some people to access an abortion who otherwise would be unable (Roberts et al., 2014; Foster, 2020), but, given data limitations, we cannot assess heterogeneous effects for abortion.
Any change in fertility in light of additional income, whether fertility increases or decreases, will indicate two things. First, there was latent demand for childbearing and/or the means to avoid childbearing. Evidence suggests both are at play (Morgan and Rackin, 2010; Foster, 2020; Bensyl et al., 2005; Miller, 2018). This means American families are shaped by economic constraints; absent these constraints, some families would be larger and others smaller. Second, an economic constraint to reproductive autonomy has been removed. The direction of the fertility changes will give some indication of the constellation of constraints relieved by the additional income. If the cash transfer induces heterogeneous effects, then we interpret that as an indication that in fact different groups were facing differential constraints to childbearing, an indication of fertility inequality.
Empirical Case: Alaska PFD
We examine the annual payments the Alaskan state government has made to every Alaskan resident since 1982 through the Alaska PFD. We argue, as others did before us, that the amount given every year increases and decreases in a way that mimics random assignment in an experiment (Hsieh, 2003; Kueng, 2018).
The amount of the transfer varies markedly, ranging from a low of $331 (1984; $626 in 2010 dollars) to a high of $3,269 (2008, including a $1,200 bonus; $3,366 in 2010 dollars) per resident with a mean of $1,547 (SD = $586) (see figure 1). To put this into context, the value of the cash transfer for a family of four ranges from the equivalent of 70% to three times the value of Food Stamps. For each household, it typically exceeds the value of the federal EITC (Crandall-Hollick, 2018). This variation in “treatment dosages,” which we argue is random with respect to individual Alaskans, is analytically useful for identifying the treatment effect.
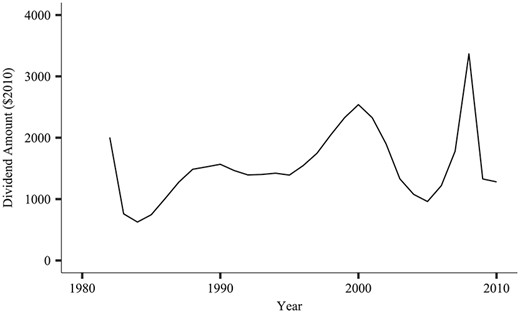
Alaska Permanent Fund Dividend per-person dividend payments in $2010, 1982–2010.
Unlike other US cash transfers—or near-cash transfers like Food Stamps—the dividend is given to every resident. Any individual who was resident in Alaska for the prior 12 months or who was born in Alaska in the prior 12 months is eligible, with rare exceptions.1 Minors’ dividends are paid to a parent or legal guardian. There are no income requirements, and unlike many social welfare programs, it is not limited to working or pregnant people. It does not phase out, even at high levels of income. Given Alaska’s similarity to the nation as a whole (detailed below), our case provides the best opportunity available to study the effects of an unconditional cash transfer for the entire country. There is an extensive application for first-time recipients; subsequent annual applications are trivial. Participation rates are high, above 92% in many years and often above 97% (Division, 2000). The universality of the dividend means there are few worries about confounders or selection on the basis of personal characteristics scholars use when modeling fertility. We nonetheless control for numerous characteristics, as we discuss below.
News reports estimate the dividend amount each spring with marked accuracy (Kueng, 2018). The official amount is announced in September, and the payment is made as a lump sum in October. Payments were originally made via check; in 1993, direct deposit became available.
The Case for Exogeneity
The initial endowment for the fund was from mineral royalties and leases of Alaskan public lands. The Alaska Permanent Fund Corporation, a quasi-independent state agency, invested the endowment in broadly diversified financial and real assets. The size of the dividend is determined by a formula specified in state law in which 10.5% of the APF’s past five fiscal years’ realized net income is withdrawn for the PFD. Operating costs and appropriations are then deducted. These are minimal. The remainder is then divided among and paid out to all permanent Alaska residents in the form of an individual PFD payment (Erickson and Groh, 2012).
The remaining revenue is reinvested, rendering proceeds from mineral extraction less than 0.06% of the total market value today. Since 1985, investment returns from a diversified global portfolio have been the primary growth mechanism. Therefore, this assuages concerns that the dividend amount is a direct function of local Alaskan economic conditions or the price of oil. Nonetheless, we include controls for local Alaskan economic conditions and perform a number of sensitivity analyses, and our findings are robust (see Appendix, particularly Appendix Table 1, for details). In addition, we perform a placebo test in South Dakota to verify that the dividend is not a proxy for broader economic conditions.
Potentially, the dividend could attract people to migrate to Alaska or compel people to stay who might otherwise have left. Net migration to Alaska, however, is small and has slowed over time (Alaska Department of Labor, 2020) despite increased awareness of the dividend across the nation. This assuages concerns about migration’s threat to our causal inference.
The Exclusion Restriction
Public health investments are a possible confounder if they are correlated to dividend payment amounts. To assess this possibility, we examined historic public health expenditure reports and public health histories and interviewed five Alaskan public health officials. The public health system changed over our study time period by expanding access to maternal and newborn healthcare for rural Alaskans, though this was a gradual change and did not fluctuate like the dividend payments (Borland et al., 2015; Nord, 1995). To attend to this, we conduct a sensitivity analysis of Anchorage residents alone where there was no meaningful new investment. The results for Anchorage are substantively similar for the state as a whole (Appendix Table 2), allaying these concerns.
Repeated Natural Experiment
We conceptualize the PFD payments as a repeated natural experiment. The repeated nature of the treatment requires careful identification of the appropriate counterfactual. We argue that once the dividend begins, no other state or group of states can serve as a proper counterfactual for continually treated Alaskans. Likewise, we do not believe it is appropriate to include Alaska before the start of the program as a control for analyses that assess long periods of treatment, as ours does. Simply put, Alaskans in 1980 are not a suitable control for Alaskans in 1995, for instance, after 13 years of continuous, varying treatments. We thus argue for an internal Alaska comparison over time to an external control group or pretreatment control. We model Alaskans in years when the dividend is low to serve as a control group for years when the dividend is high. Our causal claims for this analysis rest on two features: first, the amount of the dividend is unrelated to individual Alaskan residents’ behavior (i.e., it is exogenous); second, the amount varies year-to-year. Using the language of medical randomized experiments, since 1982, the Alaskan population has been “treated” every year to a “dose” of income, and the “dosage” varies year to year.
Though we contend that external controls and Alaskans prior to 1982 are not appropriate counterfactuals, we appreciate that others will disagree (e.g., see Chung et al. 2016; Jones and Marinescu 2018). And though the PFD has garnered more scholarly attention of late (Evans and Moore, 2011; Watson et al., 2019, 2020; Dorsett, 2019) and has been exploited to understand processes ranging from mortality to childhood obesity, no consensus on how to identify the treated and control populations has developed. Given this, we conduct a sensitivity analysis in which we include pretreatment years beginning in 1980; this yields substantively similar results.
Generalizability
The Alaskan population resembles that of the United States as a whole, in large part due to the city of Anchorage, where nearly half of Alaskans live. Table 1 compares the Alaskan and US populations over our study period on key demographic factors. Similar proportions of the population are non-Latinx White in Alaska and the United States. In Alaska, however, the non-White population is composed of more Alaska Natives and fewer Black Americans and Latinx Americans than the country as a whole. Alaska also has a larger proportion of rural residents. Contrary to popular belief, the sex ratio is not overly skewed in Alaska, but it does have more men than women. Our sensitivity analysis of Anchorage attends to concerns about the rural population and the sex ratio, which is less skewed in Anchorage compared to the state as a whole.
Comparison of United States and Alaska Demographic Characteristics, 1980–2010
| 1980 | 1990 | 2000 | 2010 | |||||
|---|---|---|---|---|---|---|---|---|
| Demographic characteristic | United States | Alaska | United States | Alaska | United States | Alaska | United States | Alaska |
| Educational attainment (%)a | ||||||||
| High school or higher | 66.5 | 82.5 | 75.2 | 86.6 | 80.4 | 88.3 | 85.0 | 88.4 |
| College degree or higher | 16.2 | 21.1 | 20.3 | 23.0 | 24.4 | 25.4 | 27.9 | 25.4 |
| Median age (years)a | 30.0 | 26.0 | 32.9 | 29.4 | 35.3 | 32.4 | 37.2 | 33.8 |
| Hispanic (%)a | 6.4 | 2.4 | 9.0 | 3.2 | 12.5 | 4.1 | 16.3 | 5.5 |
| Race (%)a,b | ||||||||
| White | 83.2 | 77.1 | 80.3 | 75.5 | 75.1 | 69.3 | 72.4 | 66.7 |
| Black | 11.7 | 3.4 | 12.1 | 4.1 | 12.3 | 3.5 | 12.6 | 3.3 |
| American Indian or Alaska Native | 0.7 | 15.9 | 0.8 | 15.6 | 0.9 | 15.6 | 0.9 | 14.8 |
| Asian or Pacific Islander | 1.6 | 1.9 | 2.9 | 3.6 | 3.7 | 4.5 | 5.0 | 6.4 |
| Other race or multiracial | 3.0 | 1.6 | 3.9 | 1.2 | 7.9 | 7.0 | 9.1 | 8.9 |
| Median household income (dollars)c | 16,841 | 25,414 | 29,943 | 39,298 | 41,990 | 52,847 | 49,276 | 57,848 |
| Poverty (%)c,d | 12.0 | 10.7 | 10.0 | 9.0 | 11.5 | 7.9 | 15.3 | 9.9 |
| Urban (%)a,e | 73.7 | 64.4 | 80.0 | 67.5 | 79.0 | 65.6 | 80.7 | 66.0 |
| Foreign-born (%)a,d | 6.2 | 4.0 | 8.0 | 4.5 | 11.1 | 5.9 | 12.9 | 7.0 |
| Children living with a single parent (%)c | 19.7 | 19.3 | 24.7 | 20.0 | 26.7 | 19.7 | 26.6 | 21.7 |
| Female (%)a | 51.4 | 47.0 | 51.3 | 47.3 | 50.9 | 48.3 | 50.8 | 47.9 |
| Fertility ratef,g,h | 68.4 | 88.6 | 70.9 | 86.3 | 67.5 | 74.6 | 64.1 | 80.1 |
| Abortion ratei | 29.3 | 22.1 | 27.4 | 19.0 | 21.3 | 13.5 | 17.7 | 14.7 |
aSource: 1980–2010 US Census.
bIn the 1980 and 1990 Censuses, individuals could report only one race. This changed in the 2000 Census, where individuals could report more than one race.
cSource: 1980–2010 Current Population Survey.
dSource: 2010 American Community Survey.
eThe census definition of “urban” changed in 2000, from places of 2,500 or more to a density measure.
fSource: National Center for Health Statistics.
gSource: Alaska Health Analytics and Vital Records.
hFertility rate is calculated as the number of births per 1,000 women aged 15–44.
iAbortion rate is calculated as the number of abortions 1,000 women aged 15–44; data from the Centers for Disease Control.
One significant difference may affect our results: throughout our study period, Medicaid paid for abortion for low-income Alaskan residents. In the majority of states (34), Medicaid does not cover abortions. A relatively large proportion of abortions in Alaska are paid for by Medicaid (42% in 1990; 46% in 2010) (see New 2015). Thus, it is possible Alaska has fewer economic barriers to abortion than do other states. If so, we would expect a smaller impact of a universal cash transfer on abortion rates in Alaska than other places.
Universal Basic Income
The PFD is the closest case of a UBI in the world (Hoynes and Rothstein, 2019), but it differs from a fully realized UBI in three important ways. First, the size of the transfer varies year-to-year. Second, it falls far short of the scale many UBI proponents advocate (but see Van Parijs and Vanderborght 2017; Banerjee et al. 2019). Third, contemporary proposals include monthly cash transfers, yet the PFD is given yearly as a lump sum, a distinction to which individuals are sensitive (Benartzi and Thaler, 2013; Warner and Pleeter, 2001; Beshears et al., 2014). The case is best characterized as a universal cash transfer. Despite these differences, we contend that studying the PFD provides insight into the potential consequences of UBI policies in the United States.
Methods
We first assess the effect of the dividend on the overall short-term fertility rate and then assess heterogeneous treatment effects across demographic groups. Following the fertility analysis, we examine abortion.
Given that pregnancies are 40 weeks, the literature’s typical fertility-response timeframe from transfer to birth of 1 year is insufficient. This may be an appropriate window for exceptional people, but on average it takes longer than 2 months to conceive (Gnoth et al., 2003; Wesselink et al., 2017). Further, as a conservative estimate, 15% of recognized pregnancies end in miscarriage (Rai and Regan, 2006), and at least a third of conceptions do not end in a live birth (Wilcox et al., 1988; Boklage, 1990). We extend the fertility-response timeframe to 24 months prior to birth to account for variation in the speed of decision-making and conception and miscarriage rates. We also empirically assess shorter and longer windows. The fertility-response window may continue through early pregnancy via abortion, which we also examine.
Fertility Response: Birth Rate
To answer Research Questions 1 and 2 regarding fertility, we analyze groups defined by five demographic characteristics: age, marital status, educational attainment, racial identity, and parity (we call these Demographic Groupings [DG]). For example, married Alaska Native women who have a college degree, no children, and are between the ages of 25 and 29 are grouped together.
The birth-rate model is a log-rate model that considers how the cash transfer affects birth rates 1 year and 2 years later (Powers and Xie, 2008). We estimate the log-rate model using negative binomial regression with an offset term equal to the logged exposure, or population of women in a given DG. We use DGs as the unit of analysis because the log-rate model assumes constant rates within each unit. Grouping women by detailed demographic subgroups makes this assumption more tenable than using larger groups, such as grouping by age alone. This model estimates the average treatment effect; it does not estimate effects by DG.
We include dividend payments from both t−1 and t−2 to provide a 24-month window in which cash transfers can affect birth rates in year t. Though dividend payments began in 1982, the birth rate model includes years 1984–2010 to account for the 24-month response window.
The main rate model estimates an average treatment effect for the entire population. We next test for heterogeneous treatment effects across subgroups (marital status, race, education, age, and parity) by estimating the main rate model with an interaction between the demographic characteristic and DIVj(t−1) and DIVj(t−2) (i.e., two two-way interactions) added.
Sensitivity Analyses for the Fertility Effects
We perform five major sensitivity analyses to test the robustness of our fertility findings.
First, we estimate the fertility models with the per-person transfer amount rather than the total household transfer.
Second, we use South Dakota as a placebo test, as it is demographically similar to Alaska Appendix Table 3 yet no resident of South Dakota received the dividend. South Dakota birth rate data were generated using a similar procedure as Alaska, described in the next section. The South Dakota birth rate model is identical to the Alaska birth rate model.
Third, we perform a second placebo test in which next year’s dividend payment is used to predict this year’s fertility.3
Fourth, we perform the birth rate analyses for Anchorage alone. Obtaining substantively similar results for this subpopulation allays three concerns: potential violations of the exclusion restriction, generalizability with regard to rurality, and generalizability with regard to the sex ratio.
Finally, because the cash transfer occurs every year, it is possible that after an initial adjustment period, individuals come to expect the dividend, removing its effect as an income “shock.” The Alaskan dividend’s variation over time allows us to assess whether such a normalization occurs by measuring unanticipated jumps or dips in the dividend. These analyses, described further in the Appendix, do not suggest normalization, which comports with recent research (for a summary, see Jappelli and Pistaferri 2010; Fuchs-Schündeln and Hassan 2016). Alaskans’ consumption does not smooth in response to the PFD for either durables or nondurables (Kueng 2018; cf. Hsieh 2003).
We also conduct numerous secondary sensitivity analyses, which we mention when relevant. Our substantive results are robust to all these analyses.
Fertility Response: Abortion Rate
Research Question 3 concerns the effect of the cash transfer on abortion rates. Abortion data are only available at the state level, so we cannot assess heterogeneous effects. We examine the state-level abortion rate using ordinary least squares regression with predictors of the PFD in the year (t) and the previous two years (t−1 and t−2). We include payments at t (unlike in the fertility models), because the response time frame for abortion is shorter (i.e., people could receive the money and immediately use it to pay for an abortion). We include the following controls: the US abortion rate in year t, the crude price of oil at t−2 in $2010, and a linear year term.
Data
We use three main types of data for our analysis. First, for information on births (including maternal age, marital status, parity, racial identity, and education), we use restricted natality data provided by the National Vital Statistics System from 1984 to 2010. For most of our analyses, we use only births to people residing in Alaska. Second, we obtain population counts (denominators for the birth rates) by combining data from 1980, 1990, and 2000 Census five-percent samples and the 2008–2012 American Community Survey sample with intercensal population counts for women age 15–44 by 5-year age groups provided by the Alaska Department of Labor and Workforce Development (2014a, 2014b). Third, we use state-year abortion rates from the Centers for Disease Control. The Appendix contains detailed information about the construction of our measures.
In all analyses, we use the dividend amount given to each household. We estimate household size using the marital status and parity variables in the natality data. Because these data lack information on cohabitation, multigenerational households, and nonbiological children present, there is possibility for error in this estimation, particularly among groups for whom these household structures are more common. However, we also present sensitivity analyses using the per-person dividend amount. All dividend measures are converted to 2010 dollars.
We align all data sources to years based on PFD payment distribution. Because payment occurs in October of each year, PFD-aligned years begin in October and end the following September. For instance, a March 2000 birth was coded as PFD year 1999 because it falls in the 12 months following distribution of the 1999 dividend payment. All references to years refer to PFD-aligned years. Given that the dividend amount is accurately predicted in the spring, we conducted a sensitivity analysis that aligned years from April to March. Results did not suggest possible anticipatory effects.
All analyses account for macrolevel Alaskan economic trends through inclusion of the annual average crude price of oil as a control. Sensitivity analyses also include the unemployment rate and per capita income. These measures are aligned to PFD distribution; because income per capita is only reported annually, we did so by assigning one-fourth of the annual value of the measure in year t to PFD year t and three-fourths of the value of the measure in year t+1 to PFD year t.
Results
Effect of PFD Transfers on Population Birth Rate
We first examine the impact of the dividend on the overall birth rate using a log-rate model. Table 2 presents coefficients for the dividend payments at t−1 and t−2. Increased income results in more births 1 and 2 years after disbursement (DIVt−1 IRR = 1.016; DIVt−2 IRR = 1.019; dividend units in thousand dollars). This model predicts that for women with a household size of one (i.e., unmarried women with no previous children), two consecutive average dividend payments for this household size of $1,455 at years t−1 and t−2 relative to two minimum payments of $626 would result in a birth rate of 59.12 relative to 57.46 per 1,000 women in year t. For women with a household size of three, the model predicts two consecutive average payments of $4,364 relative to two minimum payments of $1,878 would result in a birth rate of 113.83 relative to 104.50 per 1,000 women in year t. To understand an overall fertility rate effect, we estimate the predicted rate increase for each household size after two average dividend payments relative to two minimum dividend payments for that household. We then calculate a weighted average of this effect based on the composition of household sizes for women 15–44 in Alaska in 2010. Based on this calculation, we estimate that two average payments relative to two minimum payments would result in a predicted fertility rate increase from 80.03 to 86.53.
Effects of Alaskan PFD Payments on Birth Rates: Log-Rate Model Results, 1984–2010
| Household Payment | Individual Payment | |||||
|---|---|---|---|---|---|---|
| Model 1: AK Rate | Model 2: AK Rate w/ Decade F.E. | Model 3: AK Rate | ||||
| IRR | 95% C.I. | IRR | 95% C.I. | IRR | 95% C.I. | |
| DIVt−1 | 1.016** | (1.006, 1.026) | 1.017** | (1.007, 1.027) | 1.034* | (1.003, 1.066) |
| DIVt−2 | 1.019*** | (1.009, 1.029) | 1.024*** | (1.014, 1.035) | 1.042* | (1.009, 1.076) |
Birth count source: US Natality Detail File, 1984–2010. Population count sources: 1980–2000 Decennial Censuses and 2008–2012 American Community Survey. N = 11,696 Demographic Groupings; 240,285 births. IRR = Incidence Rate Ratios. *p<0.05; ** p<0.01; *** p<0.001.
DIV refers to household dividend payments in 2010 constant dollars. It is measured in $1,000 units. Unit of analysis is Demographic Groupings—demographic groups of women determined by age, race, marital status, educational attainment, and parity. Controls are by age, race, marital status, educational attainment, parity, year, the US birth rate, and the average crude price of oil lagged 2 years.
Figure 2 examines at what level of transfer statistically significant fertility increases occur for various household sizes. That is, what is the minimum payment required for a fertility increase? For each household size, fertility is predicted at the minimum and maximum payment amounts received by the household (e.g., $626 and $3,366 for households of one) and at each $1,000 increment in between. Payments at t−1 and t−2 are set to be equal, so the predicted rate at $2,000, for instance, represents predicted fertility if payments in both t−1 and t−2 were $2,000. To establish an effect threshold, we assess at what payment level predicted fertility is statistically significantly higher than predicted fertility for the lowest payment amount for that household size at the p<0.05 level. We use the lowest payment as the baseline because we do not include years with no dividend payments. We graph a horizontal line to indicate the baseline predicted fertility. For households of size one and two, fertility significantly increases at transfer levels of $3,000 and higher. For households of size three, the effect threshold is $4,000. Larger payments are required in larger households for an effect to occur.
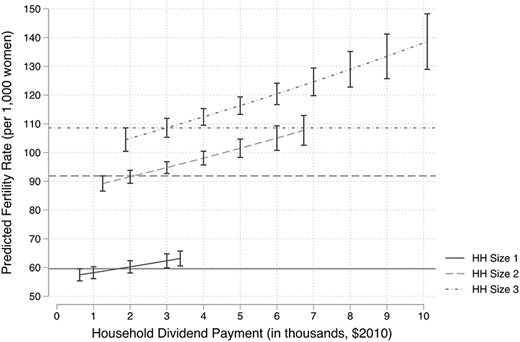
Examination of threshold for fertility effects by household size.
Appendix Table 4 presents the complete regression results for the rate model; the coefficients for all covariates have signs consistent with established literature. For instance, being married has a positive effect on birth rates, and having a bachelor’s degree is associated with a lower birth rate relative to having no high school diploma.
Sensitivity Analyses for the Average Treatment Effect
We now present results from a series of sensitivity analyses. Results from the main model are robust to all of them.
First, we consider different treatments of time. The main model, Model 1, includes year as a covariate but still allows the model to compare years across the entire study period. To ensure our results are not solely driven by comparing temporally distant years, we add decade fixed effects in Model 2 and obtain similar results. In an alternative test of whether our effects are driven by only a few years, we re-estimated Model 1 with all possible consecutive 3-year periods dropped. These models produce substantively similar results.
Second, in Model 3 we re-estimate Model 1 using the per-person dividend amount rather than the household-adjusted amount. We once again see that increased income leads to larger birth rates. For the per-person dividend measure, the effect size is larger in magnitude (DIVt−1 IRR = 1.037; DIVt−2 IRR = 1.044), which is expected given that the scale for the individual-level dividend is smaller than the household-adjusted scale.
Next, we turn to the response window. We theorize that a 24-month prebirth window is the appropriate amount of time for assessing the effect of income on fertility; we empirically assess this by testing additional time frames. Only payments 1 and 2 years prior to birth statistically significantly affect fertility (see Appendix Table 5 for full results).
In addition to the crude price of oil, we test other macroeconomic indicators, and our results are unchanged (see Appendix Table 1). Results for Anchorage alone are confirmatory and show similar positive effects on fertility (see Appendix Table 2).
Two placebo tests further validate our results. Table 3 presents results from our South Dakota placebo tests. Model 4 shows no effect of the dividend on birth rates in South Dakota, which reduces concern that the dividend payments affect the Alaskan birth rate because they are a proxy for broader economic conditions, including the global stock market.
Effect of Alaskan PFD Payments on South Dakota Birth Rates: Placebo Test
| Household payment | Individual payment | ||
|---|---|---|---|
| Model 4: South Dakota Rate | Model 5: South Dakota Rate | ||
| IRR 95 % CI | IRR | 95 % CI | |
| DIVt−1 | 1.004 (0.992 , 1.015) | 0.997 | (.962 , 1.034) |
| DIVt−2 | 1.012 (0.9997 , 1.023) | 1.021 | (.983 , 1.062) |
| Household payment | Individual payment | ||
|---|---|---|---|
| Model 4: South Dakota Rate | Model 5: South Dakota Rate | ||
| IRR 95 % CI | IRR | 95 % CI | |
| DIVt−1 | 1.004 (0.992 , 1.015) | 0.997 | (.962 , 1.034) |
| DIVt−2 | 1.012 (0.9997 , 1.023) | 1.021 | (.983 , 1.062) |
Birth count source: US Natality Detail File, 1984–2010. Population count sources: 1980–2000 Decennial Censuses and 2008–2012 American Community Survey. N = 11,338 Demographic Groupings; 277,406 births. IRR = incidence rate ratios. *p<0.05; ** p<0.01; *** p<0.001.
DIV refers to household dividend payments in 2010 constant dollars. It is measured in $1,000 units. Unit of analysis is Demographic Groupings—demographic groups of women determined by age, race, marital status, educational attainment, and parity.
Controls are by age, race, marital status, educational attainment, parity, year, the US birth rate, and the average price of crude oil lagged 2 years.
Our second placebo test assesses the effect of dividend payments in t+1 on fertility in t. As shown in Table 4, future payments do not predict past fertility.
Effects of Future Alaskan PFD Payments on Past Birth Rates: Placebo Test
| Covariate | IRR | 95% CI |
|---|---|---|
| DIVtt+1 | 1.009 | (0.999 , 1.019) |
| DIVt−1 | 1.013** | (1.003 , 1.024) |
| DIVt−2 | 1.024*** | (1.012 , 1.035) |
| Covariate | IRR | 95% CI |
|---|---|---|
| DIVtt+1 | 1.009 | (0.999 , 1.019) |
| DIVt−1 | 1.013** | (1.003 , 1.024) |
| DIVt−2 | 1.024*** | (1.012 , 1.035) |
Birth count source: US Natality Detail File, 1984–2010. Population count sources: 1980–2000 Decennial Censuses and 2008–2012 American Community Survey. Total N = 11,696 Demographic Groupings; 240,285 births. *p<0.05; ** p<0.01; *** p<0.001. Controls are: year (aligned to APF dividend disbursement), race, marital status, age, maternal education, parity, average price of crude oil lagged 2 years, and US birth rate. DIV refers to household dividend payments in 2010 constant dollars and adjusted for household size. It is measured in $1,000 units. IRR = incidence rate ratios.
Finally, we examine whether the effects of payments on fertility are nonlinear. Analyses reveal that quadratic terms for dividend payments at t−1 and t−2 are statistically significant (p<0.001), such that the positive effect of payments on fertility increases at larger payment amounts, but the curve is slight (see Appendix Figure 1). Because of this, we opt for the simpler linear model as our main model.
Heterogeneous Treatment Effects
Because the dividend payments increase birth rates, we next explore whether this increase occurs heterogeneously across demographic groups. Figure 3 presents results of models that interact each maternal characteristic (marital status, racial identity, education, age, and parity) with the dividend payments. The results indicate heterogeneous effects across multiple demographic characteristics. Across marital statuses, payments have opposite effects on birth rates: additional cash increases the birth rate for unmarried women, but the effect for married women is negative and much smaller. Despite these opposite effects, married women overall still have higher birth rates than unmarried women throughout the study period. For women of all racial identities, the dividend has a positive effect on birth rates, but the effect is largest for Alaska Native women. The difference of the effect between White and other race women is not statistically significantly different from zero. Cash transfers increase the birth rate among all educational groups, with the largest effect for women who did not complete high school. Across age groups, we find statistically significant positive effects for women 25 and older. The effects for women 15–24 are not statistically significant and may be zero. For age groups for which there is a statistically significant effect, we see larger effects for women age 25–29 and 30–34 than for women age 35–39 and 40–44. Finally, we find a large effect on the birth rate for first births, a smaller but still positive effect for second births, no effect for third births, and a very small positive effect for fourth plus births.
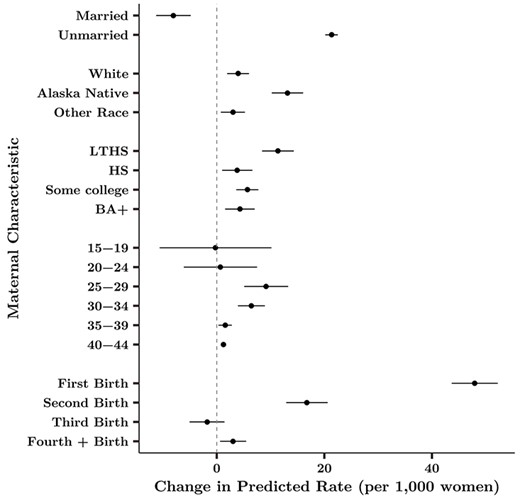
Change in predicted birth rate among women with given characteristic after dividend payment: dividends at t−1 and t−2 at $1,000 versus $3,000 (N = 240,285).
Effect of PFD Transfers on Abortion Rate
To further understand the effects of the PFD transfers, we next examine the effect of the transfers on the abortion rate. Table 5 shows no effect of payments on the abortion rate. This is not surprising given that abortion was covered by Medicaid in Alaska throughout our study period, unlike in many states.
Effect of PFD Payments on the Alaskan Abortion Rate, 1984–2010: OLS Regression Results
| Covariate | Coefficient | 95% CI |
|---|---|---|
| DIVt | −0.0001 | (−0.007 , 0.006) |
| DIVt−1 | −0.004 | (−0.010 , 0.005) |
| DIVt−2 | 0.007 | (−0.002 , 0.016) |
| Covariate | Coefficient | 95% CI |
|---|---|---|
| DIVt | −0.0001 | (−0.007 , 0.006) |
| DIVt−1 | −0.004 | (−0.010 , 0.005) |
| DIVt−2 | 0.007 | (−0.002 , 0.016) |
OLS coefficients shown. 95% confidence intervals in parentheses. Abortion data are state-level abortion rates obtained from the Centers for Disease Control for 1982–2010. Abortion rates are aligned to PFD-disbursement years. DIV refers to dividend payments in 2010 constant dollars. It is measured in $1,000 units. Models control for a linear year trend, the crude price of oil lagged 2 years, and the national abortion rate for each year.
Summary of Results
In examining this strong case of an exogenous income shock on a diverse and large population, we found income transfers increased short-term fertility one and two years after payment, particularly for disadvantaged populations. There was no effect on the abortion rate.
We interpret these findings as such: first, that the cash transfers had an effect on fertility indicates there were some economic barriers to reproductive autonomy that the transfers alleviated. Second, that fertility increased, on average, demonstrates that people faced more economic barriers to childbearing, rather than preventing childbirth. Third, that additional money induced heterogeneous effects means these barriers were unequally distributed across the population. Fourth, that disadvantaged people were particularly responsive to the payment indicates they had more barriers to reproductive autonomy. We hypothesize that the null effect on the abortion rate is likely due to the unique structural feature that abortion is covered by Medicaid in Alaska. The null effect could also be due to equal countervailing forces: increased income decreased the need for abortion for some and increased access to abortion for others who needed it.
Discussion and Conclusion
Here, we linked rational choice theories of reproduction to the framework of reproductive justice. This expands our understanding of the range of constraints to reproductive autonomy while maintaining a focus on income as a means to overcome those barriers. We argue that fertility inequality lies not in outcomes but in process: who has the reproductive autonomy to execute fertility goals? That is, who faces what barriers to reproductive autonomy? Empirically, we identified the relationship between cash transfers and fertility by examining a strong quasi-natural experiment, the Alaska PFD income transfers.
The Alaskan case provides the best opportunity we have to study the effects of a universal income policy. This allows us to consider the effect of income on populations with a wide range of structural advantage and disadvantage. Larger payments caused an increase in the birth rate shortly thereafter, suggesting that, on average, people faced economic barriers to having children, not avoiding them, and the transfers alleviated these burdens. Some demographic groups, particularly the disadvantaged, had greater sensitivity to the additional income, which indicates economic barriers to reproductive autonomy were not equally distributed across the population. These effects may reflect childbearing postponement or acceleration and may leave an imprint on completed family size.
We encourage future research on the mechanisms underlying these changes in birth rates to further illuminate barriers to reproductive autonomy. One plausible mechanism is that the additional money enabled some people to seek out childbearing. Another is that the additional resources allowed some people to render a surprise pregnancy an acceptable one to take to term. Yet another is that the additional resources improved fecundity, perhaps by reducing stress. Data do not yet exist to test these mechanisms fully.
Limitations
Of course, our research has some limitations. Regarding generalizability, compared to many other states, Alaska’s population of people of color is composed more of indigenous peoples and less by other racialized groups. Some of Alaska’s rural population is far more remote than other US rural populations in America. Anchorage, however, is more similar to other American cities than the rural areas in Alaska are to other American rural areas, and our sensitivity analyses including only Anchorage produce substantively similar results.
Alaska is somewhat unusual in that Medicaid has historically paid for abortions. Most states (34), however, do not fund abortions through state Medicaid.4 In these places, we anticipate abortion will be a more important pathway by which income affects fertility.
The natality data are strong but imperfect. They cannot link people across births, so we cannot determine whether the increase in births caused by the dividend payments are fertility accelerations or effects on total fertility. Likewise, we cannot assess changes in the underlying pregnancy rate. They do not capture cohabitation. Absent information on parental income, we need to rely on education for a sense of household material well-being.
Policy Implications
We interpret the increase in fertility following larger payments as an indication that disadvantaged families face economic barriers to having children. A larger income transfer shrinks those barriers. This aligns with claims of the reproductive justice framework (Luna and Luker, 2013; Ross and Solinger, 2017), which calls our attention to the barriers to bearing children and raising them in healthy environments. This also confers with the description of “demand for children” prominent in economics (Becker, 2009).
The contention that impoverished individuals’ childbearing is a chief cause of poverty was once quite prominent and undergirded policies that violated personal autonomy (Ross and Solinger, 2017; Roberts, 1999; Gordon, 2002). The solution to poverty, including intergenerational poverty (Cheng and Song, 2019; Torche, 2015), should not be found in limiting fertility. Families face burdens, including poor working conditions (Hepburn, 2020), incarcerated fathers (Geller et al., 2011), and high childcare costs (Han and Waldfogel, 2001; Ruppanner et al., 2019). Policies that alleviate these burdens could disrupt processes of poverty and inequality (Waldfogel, 2008) without impinging on the very personal choice and reproductive right to decide when and whether to have children.
The PFD is the closest the United States comes to a UBI, an increasingly popular proposition. Based on this analysis of 30 years of transfers in Alaska, we conclude that cash transfers increase reproductive autonomy, particularly for disadvantaged groups, by reducing economic barriers to childbearing. Cash transfers, though designed to address poverty and economic inequalities, can successfully reduce fertility inequalities in the United States.
About the Author
Sarah K. Cowan, PhD, is an assistant professor in the Department of Sociology at New York University and the founder and Executive Director of the Cash Transfer Lab. Her primary interests are in cash transfers, fertility, abortion, prenatal and newborn health, secrets, public opinion, and survey methodology.
Kiara Wyndham Douds is an assistant professor in the Department of Sociology at Washington University in St. Louis. Their research explores the mechanisms of racial inequality production and interventions to disrupt these mechanisms, including universal cash transfers.
Endnotes
People sentenced or incarcerated for a felony during the year are excluded, as are people with extensive criminal records.
Instead of including the characteristics that make-up Demographic Groupings (DGs) as controls in the model, another approach is to include DG fixed effects. Doing so yields substantively similar results. We chose the approach using covariates for our main analyses so we can estimate heterogeneous treatment effects across subgroups (e.g., married people, second births, people with some college) using interactions.
We thank Stephen Morgan for suggesting this placebo test.
Federal Medicaid covers abortion only in rare exceptions.
References
Van Parijs, Philippe, and Yannick Vanderborght.
