


Abstract
Cotinine is a widely used biomarker for classifying cigarette smoking status. However, cotinine does not differentiate between the use of combustible and noncombustible tobacco products. The increasing use of noncombustible tobacco drives the need for a complementary biomarker for distinguishing cigarette smokers from users of noncombustible tobacco products.
We evaluated the urinary acrylonitrile metabolite, 2CyEMA, as a biomarker of exposure to cigarette smoke in the US population-representative data from the National Health and Nutritional Examination Survey (NHANES). Smoking status was categorized based on the recent tobacco use questionnaire. The receiver operating characteristic (ROC) curve analysis was performed to identify optimal cutoff concentrations by maximizing Youden’s J index. The area under the curve (AUC) was used to compare 2CyEMA effectiveness with respect to serum cotinine.
The overall cutoff concentration for the classification of cigarette smokers from nonsmokers was 7.32 ng/ml with high sensitivity and specificity (≥0.925). When stratified by demographic variables, the cutoff concentrations varied among subgroups based on age, sex, and race/Hispanic origin. Non-Hispanic Blacks had the highest cutoff concentration (15.3 ng/ml), and Hispanics had the lowest (4.63 ng/ml). Females had higher cutoff concentrations (8.80 ng/ml) compared to males (6.10 ng/ml). Among different age groups, the cutoff concentrations varied between 4.63 ng/ml (21–39 years old) and 10.6 ng/ml (for ≥60 years old). We also explored the creatinine adjusted cutoff values.
2CyEMA is an effective biomarker for distinguishing cigarette smokers from nonsmokers (users of noncombustible tobacco products or nonusers).
Distinguishes smokers from noncombustible tobacco product users.
2CyEMA can serve as a biomarker of exposure to tobacco smoke.
2CyEMA is an effective biomarker for distinguishing cigarette smokers from nonsmokers (users of noncombustible tobacco products or nonusers). The cutoff concentration of 2CyEMA in nationally-representative urine samples is 7.32 ng/ml or 11.4 µg/g creatinine.
2CyEMA (smoke biomarker) can be used in concert with serum cotinine (tobacco exposure biomarker) to accurately classify cigarette smokers from users of other noncombustible tobacco/nicotine products.
Introduction
Tobacco smoke exposure is the primary cause of premature death in the US population and a significant contributor to adverse health impact globally. In the United States, cigarette smoking causes nearly 480 000 deaths per year, with millions of others living with smoking-related diseases.1 More than 20 million smoking-attributed premature deaths were reported from 1964 to 2014.1 The accurate classification of smoking status is essential for assessing the extent of the tobacco-related disease and the impact of global efforts to reduce cigarette smoking. In this study, we evaluated urinary cyanoethyl mercapturic acid (2CyEMA),2 a metabolite of acrylonitrile, as an effective biomarker for distinguishing cigarette smokers from nonsmokers, and calculated optimal cutoff concentration based on receiver operating characteristics (ROC) curve analysis.
Acrylonitrile is a volatile organic compound used in the production of acrylic and modacrylic, plastics, and resins.3 It is also used as an intermediate in the production of other important chemicals such as acrylamide.3 Occupational exposure of acrylonitrile has been reported in workers in these industries.4–7 However, in the general population, acrylonitrile exposure is primarily from tobacco smoke.8–10 Tobacco smoke contains significant levels of acrylonitrile; machine smoking of a sampling of US brand cigarettes found an average of 28.4 µg acrylonitrile per cigarette in the mainstream smoke,8 with actual acrylonitrile delivery to smokers varying based on smoking intensity and cigarette design parameters.9
Acrylonitrile is classified as a potential human carcinogen (group 2B).11 Rats exposed to acrylonitrile had increased incidence of tumors in the brain, spinal cord, Zymbal’s gland, and mammary gland.12 Furthermore, several early epidemiologic studies associated acrylonitrile exposure with increased risk of lung, prostate, and brain cancers.3,13 The most recent research on a cohort of 25 460 workers exposed to acrylonitrile showed elevated mortality risk in human due to bladder cancer and pneumonitis.7
Humans metabolize acrylonitrile via two different pathways. Kopecky et al. proposed that the primary route involves glutathione S-alkene transferases catalyzed metabolism to 2CyEMA.3,14 The minor pathway includes CYP2E1 catalyzed oxidative metabolism to cyanide and subsequent metabolism to thiocyanate and other metabolites. The biological half-life of 2CyEMA is about eight hours,15 although some people appear to clear 2CyEMA faster than others.16 To support the National Health and Nutrition Examination Survey (NHANES) and other biomonitoring studies, we measure 2CyEMA as a biomarker of acrylonitrile exposure in the US general population.17
In this study, we evaluated the efficacy of urinary 2CyEMA for classifying smoking status in a representative sample of the US population. The overall optimal urinary 2CyEMA cutoff concentration as well as cutoff concentrations for various demographic variables, were determined using receiver operator characteristic (ROC) curve analysis of 2011–2016 NHANES data. In addition, we also compared the sample weighted histograms of urinary 2CyEMA and serum cotinine concentrations among smokers, nonusers, and exclusive noncombustible tobacco product users.
Study Design
NHANES is a population-based series of cross-sectional survey that assesses the health and nutritional status of the civilian, noninstitutionalized US population.18 The survey is unique that data are collected from questionnaires, in-person physical examinations, and biological samples. The Research Ethics Review Board of the National Center for Health Statistics (NCHS), Centers for Disease Control and Prevention (CDC) reviewed and approved the NHANES study. All adult participants gave informed written consent to participate in the survey. Following interviews in the homes, physical exams were performed, and biological specimens were collected in mobile examination centers (MEC). A total of 7,416 participants provided spot urine samples for NHANES cycles 2011–2012, 2013–2014 and 2015–2016, and we measured 2CyEMA in a special smoking subsample19 of participants aged ≥21 years old. The selection of ≥21 years old was based on the current federal minimum age of 21 years old for the purchase of tobacco products in the United States.20
The study participants were classified based on tobacco/nicotine product use, similar to our previous studies with minor modifications.17,21 This categorization scheme and the resulting numbers of study participants in each group is illustrated in Supplementary Figure S1. Participants were identified as exclusive recent users of cigarette products (termed “smokers” in this report) if they used tobacco product (responded “yes” to NHANES question “Used any tobacco/nicotine product in the past 5 days?”), smoked cigarette (“yes” to SMQ690A), and did not use pipes, cigars, chewing tobacco, snuff, patch/gum, hookah/water pipes, E-cigarettes, snus, or dissolvable tobacco (“no” to SMQ690B − SMQ690J in NHANES cycle 2013–2016; “no” to SMQ690B − SMQ69F in NHANES cycle 2011-2012), within 5 days prior to NHANES physical examination, based on NHANES questionnaire data on recent tobacco use (NHANES dataset: SMQRTU). Participants were identified as “nonusers” of tobacco products if they did not use tobacco products within 5 days prior to NHANES physical examination (“no” to NHANES question “Used any tobacco/nicotine product in the past 5 days?”). Participants were classified as users of noncombustible tobacco products if they used tobacco product (answered “yes” to NHANES question “Used any tobacco/nicotine product in the past 5 days?”) but did not smoke cigarette, pipes, cigars, or hookah/water pipes (“no” to SMQ690A−SMQ690C, and SMQ690G), within 5 days prior to NHANES physical examination. Participants were identified as “nonsmokers” if they were nonusers or noncombustible tobacco users. Laboratory data for 7024 participants were reported for 2CyEMA (NHANES dataset: UVOCS). Participants were excluded from analysis if they did not meet the criteria for either exclusive smoker, nonuser, or user of noncombustible tobacco products (N = 1049), or if they were younger than 21 years old (N = 268). This categorization scheme left 5707 study participants eligible for statistical analysis. Participants were classified based on their demographic characteristics. Age was categorized into the following ranges: 21–39, 40–50, and ≥60 years. Race/Ethnicity was classified as non-Hispanic white, non-Hispanic black, Hispanic, and other race/multi-racial. Sex was categorized into male and female.
Laboratory Method
We used ultra-high-performance liquid chromatography (I-Class Acquity UPLC system, Waters Inc., Milford, MA) coupled with electrospray ionization tandem mass spectrometry (ESI-MS/MS; Sciex 5500 Triple quad, Sciex, Framingham, MA) for the measurement of urinary 2CyEMA.22 The details about the experimental workflow are described elsewhere.22 Briefly, the chromatographic separation was achieved using an Acquity UPLC HSS T3, 100 Å, 1.8 μm, 2.1 mm × 150 mm column (Waters Inc., Milford, MA) with a Waters HSS T3 VanGuard pre-column (Waters Corporation, Milford, MA). The mass spectrometer was operated in negative ion ESI scheduled multiple reaction monitoring mode. Data was acquired using Analyst software (Sciex, Framingham, MA), and processed in MultiQuant 3.0.3 (Sciex, Framingham, MA). Sample concentrations were determined based on their relative response ratio (ratio of native analyte to stable isotope-labeled internal standard) against a calibration curve with known standard concentrations. The limit of detection (LOD) was 0.5 ng/ml.
Serum cotinine was measured by an isotope dilution HPLC–APCI–MS/MS method, and creatinine was measured using Enzymatic Roche Cobas 6000 Analyzer. A detailed description of the laboratory methodologies can be found elsewhere.19
Statistical Analysis
Self-reported tobacco usage from NHANES recent tobacco use questionnaire was utilized to classify smoking groups as discussed earlier under Study Design. ROC curve analysis was performed to identify optimal cutpoints by maximizing Youden’s J index. ROC curve analysis is a graphical and quantitative technique used to determine optimal cutpoints for a binary classifier. Youden’s J index is a statistic often used in conjunction with ROC analysis to select an optimal cutoff concentration for a given continuous criterion variable.23 The index is calculated as the sum of sensitivity (true-positive rate) and specificity (true-negative rate) minus one. Here, urinary 2CyEMA levels are evaluated to find the cutoff concentration to distinguish exclusive cigarette smoker from nonsmokers (users of noncombustible tobacco products or nonusers) and compare results with serum cotinine.
Data analysis was conducted with SAS software (SAS 9.4, SAS Institute Inc., Cary, NC). To produce unbiased, nationally representative descriptive statistics with appropriate variance estimates, we used SURVEYREG and SURVEYMEANS subroutines involving Taylor series linearization accounting for clustering. Since there are no procedures in SAS software for weighted ROC analysis, we took the sampling design into account, used weights from special smoking subsample and developed a SAS macro to plot weighted ROC curve that accounted for the complex design of NHANES and selected an optimal cutoff concentration based on maximizing Youden’s J index values. We used a bootstrap approach with 1000 bootstrap replicate weights to estimate 95% confidence intervals24 for a cutoff concentration for the adult US population and cutoff concentrations for each demographic subgroup.
This study demonstrates the viability of using 2CyEMA to categorize tobacco smoke exposure (smoker vs nonsmokers) by comparing ROC curves for 2CyEMA (both as ng/ml and µg/g creatinine) with serum cotinine. Cutoff concentrations of 2CyEMA were calculated for cigarette smokers and nonsmokers (including users of noncombustible tobacco products), and cigarette smokers and nonusers. The same approach was used to calculate a creatinine-adjusted 2CyEMA cutoff levels. Lastly, 2CyEMA cutoffs (both as ng/ml and µg/g creatinine) were calculated between cigarette smokers and nonsmokers for each demographic subgroup.
Results
Table 1 lists the geometric means and medians of urinary 2CyEMA for cigarette smokers and nonsmokers, categorized by sex, age, and race/ethnicity. Creatinine adjusted values are shown in Supplementary Table S1. Of 5707 eligible participants, 2091 were exclusive cigarette smokers, and the remaining were nonsmokers. The overall median 2CyEMA concentration in cigarette smokers (125 ng/ml; 145 µg/g creatinine) was 100 times higher than in nonsmokers (1.21 ng/ml; 1.37 µg/g creatinine).
Weighted Geometric Mean (95% CI) and Median (IQR) Urinary 2CyEMA (ng/ml) in Adult US Population by Sex, Age, Race or Ethnicity, and Smoking Status, Based on NHANES 2011–2016 (N = 5707)
| Characteristic | Level | Nonsmokers N | Smokers N | Nonsmokers median [25th %ile, 75th %ile] | Smokers median [25th %ile, 75th %ile] | Nonsmokers GM [95% CI] | Smokers GM [95% CI] |
|---|---|---|---|---|---|---|---|
| All | 3616 | 2091 | 1.21 [0.650, 2.18] | 125 [53.2, 239] | 1.43 [1.33, 1.55] | 98.1 [85.9, 112] | |
| Sex | Male | 1717 | 1182 | 1.45 [0.816, 2.66] | 134 [44.2, 261] | 1.72 [1.56, 1.90] | 93.5 [77.0, 113] |
| Female | 1899 | 909 | 1.05 [0.533, 1.92] | 121 [63.5, 216] | 1.22 [1.11, 1.34] | 103 [91.3, 117] | |
| Age | 21 – 39 | 1116 | 752 | 1.24 [0.650, 2.27] | 98.7 [31.0, 206] | 1.52 [1.34, 1.72] | 69.0 [53.9, 88.1] |
| 40 – 59 | 1151 | 846 | 1.26 [0.723, 2.34] | 147 [76.4, 273] | 1.55 [1.36, 1.76] | 127 [110, 147] | |
| ≥60 | 1349 | 493 | 1.13 [0.585, 1.98] | 141 [69.9, 238] | 1.24 [1.14, 1.34] | 120 [105, 136] | |
| Race/ethnicity | Non-Hispanic White | 1347 | 942 | 1.16 [0.616, 2.12] | 125 [52.5, 238] | 1.40 [1.26, 1.55] | 98.5 [82.1, 118] |
| Non-Hispanic Black | 718 | 577 | 1.70 [1.04, 3.47] | 172 [88.5, 335] | 2.34 [2.10, 2.61] | 156 [139, 175] | |
| Hispanic | 969 | 358 | 1.21 [0.646, 2.02] | 73.8 [21.5, 184] | 1.31 [1.19, 1.45] | 56.4 [45.4, 70.1] | |
| Other Race/Multi-Racial | 582 | 214 | 1.12 [0.551, 1.93] | 140 [61.8, 219] | 1.16 [1.05, 1.29] | 99.1 [74.1, 132] |
We also compared urinary 2CyEMA (both as ng/ml and µg/g creatinine) with serum cotinine for ROC curve analysis. Figure 1 shows the ROC curves for using urinary 2CyEMA and serum cotinine for distinguishing exclusive cigarette smokers versus nonusers of tobacco. The calculated urinary 2CyEMA cutoff concentration was 7.32 ng/ml, or 11.4 µg/g creatinine when adjusted for urinary dilution. The area under the curve (AUC) of urinary 2CyEMA and creatinine-adjusted 2CyEMA were 0.968 and 0.971, respectively. The AUC for serum cotinine was 0.994. Similar curves for the exclusive cigarette smoker versus nonsmokers are shown in Supplementary Figure S2. The calculated cutoff concentrations and AUC remained unchanged for urinary 2CyEMA. However, the AUC of serum cotinine was reduced to 0.970.
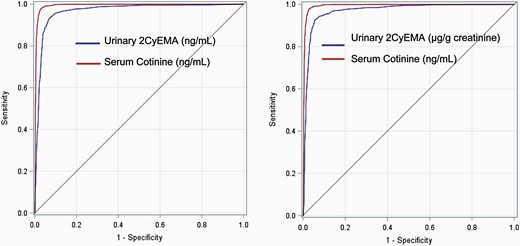
Weighted ROC curves of urinary 2CyEMA (ng/ml) and serum cotinine (left), and 2CyEMA (µg/g creatinine) and serum cotinine (right) for exclusive cigarette smoker versus tobacco nonusers group. The 2CyEMA cutoff levels were 7.32 ng/ml (sensitivity 0.933; specificity 0.925) and 11.4 µg/g creatinine (sensitivity 0.924; specificity 0.946).
To further explore the effect of inclusions of users of noncombustible tobacco products on the cutoff concentration estimations, we plotted the sample weighted histogram of urinary 2CyEMA and serum cotinine among exclusive smokers, nonusers, and exclusive noncombustible tobacco users. Figure 2 shows the superimposed distributions for both urinary 2CyEMA and serum cotinine. Urinary 2CyEMA were much higher in smokers compared with both nonusers and users of noncombustible tobacco products; conversely, serum cotinine levels were much higher in both smokers and users of noncombustible tobacco products compared with nonusers.

Distributions (weighted) of urinary 2CyEMA (left) and serum cotinine (right) among exclusive smokers, tobacco nonusers, and users of exclusive noncombustible tobacco products in adult U.S. population, based on NHANES 2011–2016.
In addition, we also calculated the urinary 2CyEMA cutoff concentrations for demographic variables including age, sex, and race/ethnicity (Table 2). Cutoff concentrations ranged from 4.63 ng/ml to 15.3 ng/ml. The cutoff was lower among males (6.10 ng/ml) compared to females (8.80 ng/ml). Non-Hispanic Blacks had the highest cutoff (15.3 ng/ml), followed by non-Hispanic Whites (7.32 ng/ml), which matches the overall cutoff. Hispanics had the lowest cutoff (4.63 ng/ml among the race/ethnicity subgroups we explored. When adjusted with creatinine, the cutoff values ranged between 6.3 and 12.6 µg/g creatinine for the select demographic variables (Supplementary Table S2). The creatinine-ratioed cutoff was lower among males (9.37 µg/g) compared to females (11.4 µg/g). Non-Hispanic Blacks had a similar cutoff (11.4 µg/g) compared with non-Hispanic Whites (11.4 µg/g), while the creatinine-ratioed cutoff for Hispanics was lowest (6.30 µg/g) among the race/ethnicity subgroups evaluated.
Weighted Urinary 2CyEMA (ng/ml) Cutoff Concentrations to Distinguish Between Smoker and Nonsmoker by Demographic Subgroup for Adult US Population Based on NHANES 2011–2016
| Variables | Cutoff conc. (95% CI) | Sensitivity | Specificity | Youden’s J statistic |
|---|---|---|---|---|
| Age 21–39 | 4.63 (3.51, 8.80) | 0.925 | 0.883 | 0.808 |
| Age 40–59 | 8.03 (5.07, 15.27) | 0.971 | 0.924 | 0.894 |
| Age ≥60 | 10.6 (9.65, 24.16) | 0.974 | 0.956 | 0.930 |
| Male | 6.10 (5.07, 13.93) | 0.936 | 0.897 | 0.833 |
| Female | 8.80 (4.63, 11.59) | 0.942 | 0.946 | 0.888 |
| Non-Hispanic White | 7.32 (4.22, 10.57) | 0.936 | 0.926 | 0.862 |
| Non-Hispanic Black | 15.3 (13.93, 31.82) | 0.974 | 0.914 | 0.888 |
| Hispanic | 4.63 (2.92, 9.65) | 0.901 | 0.931 | 0.832 |
| Other Race/Multi-Racial | 5.56 (3.51, 16.73) | 0.942 | 0.949 | 0.892 |
Discussion
In this study, we assessed urinary 2CyEMA for differentiating cigarette smokers from nonsmokers based on a representative sampling of the US population (NHANES special smoker subset, ages > 20). We calculated the geometric mean, median, and interquartile range of 2CyEMA in exclusive smokers and nonsmokers based on self-reported smoking status. As shown in the Table 1 (and Supplementary Table S1), the overall concentration of urinary 2CyEMA in cigarette smokers was two orders of magnitude higher than in nonsmokers. This finding implies that tobacco smoke is a major source of acrylonitrile exposure in US adults, consistent with previously published conclusions for the US population ages >6.17 Therefore, we hypothesized that urinary 2CyEMA could serve as an effective biomarker for smoking status classification. The use of the acrylonitrile metabolite 2CyEMA to distinguish smokers from nonsmokers is supported by the microgram quantities of acrylonitrile produced by machine smoked cigarettes,9,25 and also by the markedly higher levels of urinary 2CyEMA found in smokers compared to nonusers in recent biomonitoring studies.17,26–28 In cigarettes, acrylonitrile is likely formed as tobacco organic material burns in the presence of nitrate and nitrite,27,29 leading to significant inhaled exposure by smokers. Therefore, we use the ROC curve technique to identify optimal cutoff concentration by maximizing Youden’s J index to differentiate smokers from tobacco nonusers and nonsmokers. As discussed earlier in the study design section, the nonsmokers include nonusers of tobacco and noncombustible tobacco users.
2CyEMA was detected in urine samples of both smokers and nonsmokers. The frequency of detectable urinary 2CyEMA in all samples analyzed was 90.2% (method LOD of 0.5 ng/ml). The calculated overall cutoff (7.32 ng/ml or 11.4 µg/g creatinine, Figure 1) for the classification of cigarette smokers from nonusers group had high sensitivity and specificity. We also performed a similar ROC curve analysis of serum cotinine and compared its AUC with urinary 2CyEMA. Cotinine is the primary proximate metabolite of nicotine and thus serum cotinine is the gold standard biomarker of nicotine exposure. In this dataset serum cotinine had a better AUC (0.994) compared to 2CyEMA (0.968 and 0.971). Nonetheless, our results showed that the urinary 2CyEMA cutoff values of 7.32 ng/ml or 11.4 µg/g creatinine has ~97% probability of discriminating exclusive cigarette smokers from the nonusers group.
We also performed ROC curve analysis of urinary 2CyEMA and serum cotinine in cigarette smokers versus nonsmokers (Supplementary Figure S2). Interestingly, there were no differences in the cutoff concentration and the sensitivity for urinary 2CyEMA but 0.1% improvement in the specificity and AUC. However, for serum cotinine, the AUC decreased by 2.4% as a result of the inclusion of 78 users of noncombustible tobacco in Supplementary Figure S2. As expected, the urinary 2CyEMA ROC curve for exclusive cigarette smokers versus users of noncombustible tobacco product users produced a higher AUC (0.940) compared with the serum cotinine ROC curve for exclusive cigarette smokers versus users of noncombustible tobacco products (0.299). The calculated urinary 2CyEMA cutoff value of 10.57 ng/ml (sensitivity 0.914; specificity 0.841) best distinguished exclusive cigarette smokers versus users of noncombustible tobacco products. This comparison is also graphically illustrated using sample weighted histograms of exclusive smokers, nonusers, and exclusive users of noncombustible tobacco products for both urinary 2CyEMA and serum cotinine. As expected, 2CyEMA distribution for nonusers and users of noncombustible tobacco products overlapped and were distinct from the smokers (Figure 2, left) with the median 2CyEMA concentration of 1.20 and 2.16 ng/ml for nonusers and users of noncombustible tobacco products, respectively. The median 2CyEMA level for smokers was 125 ng/ml. Similar histograms were plotted for serum cotinine, and there was no clear distinction between smokers and users of noncombustible tobacco products (Figure 2, right). The median serum cotinine level for cigarette smokers (225.7 ng/ml) and users of noncombustible tobacco products (375.0 ng/ml) were significantly higher compared with nonusers (0.016 ng/ml). It implies that the smoke biomarker, 2CyEMA, can accurately differentiate cigarette smokers from nonsmokers (whether nonusers or users of noncombustible tobacco products), while cotinine best distinguishes users of tobacco products from nonusers. As the use of noncombustible tobacco/nicotine products, including e-cigarettes, increases methods are needed for differentiating cigarette smokers from users of noncombustible tobacco products; urinary 2CyEMA effectively differentiates users of combustible vs. noncombustible products. Of note, several studies have shown that urinary 2CyEMA levels in e-cigarette users are much lower than in cigarette smokers,30–33 while serum cotinine levels are similar. Therefore, when 2CyEMA is used in concert with serum cotinine, one can precisely differentiate among smokers, users of noncombustible tobacco products, and nonusers.
In order to examine the differences in 2CyEMA cutoff concentrations by demographic subgroups, we evaluated 2CyEMA cutoff concentrations based on age, sex, and race/ethnicity. Table 2 shows that the cutoff concentration varies from 4.63 to 15.3 ng/ml. The lowest cutoff concentration of 4.63 ng/ml was observed for the age group 21–39 years old and increased with age, likely because tobacco product use intensity tends to be lower in young adults as compared with older adults.34 However, when adjusted with creatinine (Supplementary Table S2), the cutoff value decreased in the highest age group (≥60 years old). Different cutoff concentrations were identified for different race/ethnicities: the lowest cutoff concentration (4.63 ng/ml) was for Hispanics while the highest cutoff (15.3 ng/ml) was for non-Hispanic Blacks; this pattern of cutoff concentrations matches the pattern observed for urinary cotinine in smokers, and may reflect a combination of differences in product use intensity and metabolism.35 The creatinine-adjusted cutoffs indicated a somewhat different pattern: Hispanics had the lowest cutoff value (6.3 µg/g creatinine) while similarly higher cutoffs were found for non-Hispanic Blacks (11.4 µg/g) and non-Hispanic Whites (11.4 µg/g). These somewhat different patterns of cutoff values for concentration compared with creatinine-ratioed are to be expected because of some variation in distribution curve imposed by the creatinine adjustment for demographics subgroups including age and sex. A recent study has shown that small differences in a few light smokers or nonsmokers with significant second-hand smoke exposure could shift the cutoff by 2-fold while only changing the classification of ~1% of the study participants as demonstrated for urinary cotinine.36 Females had higher 2CyEMA cutoff values (8.80 ng/ml; 11.4 µg/g creatinine) compared to males (6.10 ng/ml; 9.37 µg/g creatinine), which is similar to findings for urinary cotinine.35 The estimated cutoff levels for the demographic variables can be explored when the data is specific to the known race/ethnicity, gender, or age groups. However, the overall cutoff concentration is recommended for studies lacking representative sampling of these specific demographic groups.
During the preparation of this manuscript, Luo et al. published a manuscript that reported 2CyEMA cutoff concentration of 27 pmol/ml (~5.84 ng/ml) for differentiating smokers from nonsmokers.37 The objective of the manuscript was to provide 2CyEMA as an effective biomarker for smoking status classification. However, it differs from our work in many ways: Firstly, our data represents the US noninstitutionalized, civilian population with age groups 21 years and older. In contrast, Luo et al. recruited smokers and nonsmokers separately from two different cohorts.37 Nonsmokers were recruited from Hawaii multiethnic cohort (33.33% Native Hawaiians, 33.33% Japanese Americans, 33.33% Whites; median age 71 years old), and smokers from the mainland United States (61% Whites and 30% Blacks; median age 45 years old). While the study clearly differentiated smokers from nonsmokers, the reported cutoff concentration may not adequately classify smoking status in a US representative sampling. The cutoff concentration reported by Luo et al. matches closely with our estimated cutoff concentrations reported for Other Race/Multi-Racial group that includes Asian and Pacific Islander (5.84 ng/ml vs. 5.56 ng/ml, Table 2). Secondly, Luo et al. classified the smoking status of the participants based on the urinary cotinine. While it is common to use cotinine data, it does not differentiate smokers from the users of noncombustible tobacco products (discussed above) and may bias estimated cutoff concentrations. This study reported 2CyEMA cutoff concentrations with high sensitivity and specificity to differentiate smokers from the small numbers of users of noncombustible tobacco products. Our findings highlight the importance of 2CyEMA as an effective biomarker for differentiating smokers from users of noncombustible tobacco products. Thirdly, we also reported various cutoff concentrations by demographic subgroups and by creatinine adjustments. These cutoff concentrations are helpful when the data is specific for the known demographic cohort studies.
This study has some limitations. We did not assess the influence of cigars, hookah, and marijuana smoke; use of all of these products would lead to acrylonitrile exposure and would thus result in increased urinary 2CyEMA.38,39 Furthermore, 2CyEMA has a relatively short half-life in the body (~4 h), and thus the concentrations of urinary 2CyEMA vary substantially among spot urines depending on the time elapsed from the last smoking event to urine collection.16 Thus, the collection of single spot urine from each study participant introduces some imprecision in exposure assessment, regardless of the creatinine adjustments.
In conclusion, we reported urinary 2CyEMA cutoff concentrations for smoking status classification based on the representative sampling of the U.S. population (NHANES 2011–2016, the special smoker subset, ages > 20). We found that urinary 2CyEMA is an effective biomarker for differentiating cigarette smokers from users of noncombustible tobacco products and nonusers. Thus we recommend the use of 2CyEMA in conjunction with serum cotinine to best evaluate smoke exposure related to use of combustible and noncombustible tobacco products.
Supplementary Material
A Contributorship Form detailing each author’s specific involvement with this content, as well as any supplementary data, are available online at https://academic.oup.com/ntr.
Funding
No external funding was received for this study. The views and opinions expressed in this report are those of the authors and do not necessarily represent the views, official policy or position of the US Department of Health and Human Services or any of its affiliated institutions or agencies. The use of trade names is for identification purposes and does not imply endorsement by the Centers for Disease Control and Prevention, the Public Health Service, or the US Department of Health and Human Services.
Declaration of Interests
Authors declare no conflict of interests.
Data Availability
The data underlying this manuscript are available in www.nhanes.com.

Comments