


Abstract
The subjective experience of aging, indexed by how old or young an individual feels, has been related to well-being and health-related outcomes among older adults. The present study examined whether subjective age is associated with memory level and changes, as indexed by measures of immediate and delayed recall. A complementary purpose was to test the mediating role of depressive symptoms and physical activity in the relation between subjective age and memory changes.
Participants were drawn from three waves of the Health and Retirement Study. Subjective age, baseline memory measures, and covariates were assessed during the 2008 wave ( N = 5809), depressive symptoms and physical activity were assessed again in the 2010 wave, and the follow-up memory measures were assessed in the 2012 wave.
Regression analyses that included demographic, metabolic, and vascular covariates revealed that a younger subjective age at baseline was associated with better concurrent performance and with slower decline in immediate and delayed recall. Bootstrap procedures indicated that fewer depressive symptoms mediated these associations. Additional analyses revealed that memory level and change were unrelated to changes in subjective age.
Beyond chronological age, the subjective experience of age is associated with cognitive aging.
Memory functioning is a key contributor to older adults’ quality of life. Indeed, the maintenance of memory is associated with better ability to conduct instrumental activities of daily living (Zahodne, Manly, Mackay-Brandt, & Stern, 2013) and reduced risk of mortality ( Sabia and colleagues, 2010 ; Shipley, Der, Taylor, & Deary, 2006 ). By contrast, memory decline is linked to functional decline ( Zahodne and colleagues, 2013 ) and higher risk of developing dementia ( Aggarwal, Wilson, Beck, Bienias, & Bennett, 2005 ; Palmer, Bäckman, Winblad, & Fratiglioni, 2008). Memory and other cognitive functions tend to decline as part of the normative aging process. Chronological age is a powerful predictor of cognitive aging ( Singh-Manoux and colleagues, 2012 ) and one of the most important risk factors for dementia ( Daviglus and colleagues, 2010 ). For example, among those 65- to 74-years old, the proportion of people with Alzheimer’s disease is less than 5%, but the proportion increases to more than 30% among those older than 85 years ( Alzheimer Association, 2013 ). In addition to chronological age, psychological and biologically based measures of aging are likely to contribute to memory functioning ( MacDonald, DeCarlo, & Dixon, 2011 ; Stephan, Caudroit, Jaconelli, & Terracciano, 2014 ). In this study, we examine whether subjective age—how young or old individuals experience themselves to be—is associated with change in memory among older adults, independent of chronological age.
A majority of older adults feel younger than they actually are ( Gana, Alaphilippe, & Bailly, 2004 ; Rubin & Berntsen, 2006 ). This tendency to report a younger subjective age is associated with higher well-being ( Gana and colleagues, 2004 ; Keyes & Westerhof, 2012 ), better physical functioning (Stephan, Chalabaev, Kotter-Grühn, & Jaconelli, 2013), fewer chronic conditions and less obesity ( Demakakos, Gjonca, & Nazroo, 2007 ; Stephan and colleagues, 2014 ), and a longer life (Kotter-Grühn, Kleinspehn-Ammerlahn, Gerstorf, & Smith, 2009). Although performance on cognitive tests is unrelated to level and change in subjective age ( Infurna, Gerstorf, Robertson, Berg, & Zarit, 2010 ; Kleinspehn-Ammerlahn, Kotter-Grühn, & Smith, 2008), subjective age has been found to play a role in cognitive aging. Using data from the Midlife in the United States Survey (MIDUS), Stephan and colleagues (2014) found that a younger subjective age was associated with better cognitive functioning 10 years later, assessed by episodic memory and executive functioning measures, independent of chronological age and other demographic covariates. Furthermore, the strength of this association was comparable or larger than the effects observed for well-established risk factors for cognitive decline, such as BMI, disease burden, and physical inactivity ( Stephan and colleagues, 2014 ). However, the MIDUS study only had cognitive measures at follow-up. Without a baseline cognitive assessment in the MIDUS study, it was not possible to test whether subjective age was associated with changes in cognition over time. The present study thus aims to extend this prior research by examining the association between subjective age and memory decline among older adults.
Using longitudinal data from the Health and Retirement Study (HRS), the present study examines whether subjective age is associated with concurrent performance and change over 4 years on immediate and delayed recall memory tasks. Based on the previous research ( Stephan and colleagues, 2014 ), we expected participants with a younger subjective age to have a better memory when measured concurrently and slower decline in memory over time. A complementary purpose was to test whether depressive symptoms and physical activity mediated the relation between subjective age and change in memory. Prior research has found that a younger subjective age is related to fewer depressive symptoms ( Keyes & Westerhof, 2012 ), which in turn is associated with slower memory decline over time (Wilson, Mendes de Leon, Bennett, Bienas, & Evans, 2004; Zahodne, Stern, & Manly, 2014 ). In addition, individuals who feel younger than their age are more likely to engage in physical activity ( Caudroit, Stephan, Chalabaev, & Le Scanff, 2012 ; Stephan and colleagues, 2014 ), which in turn is considered protective against age-related cognitive decline and risk of cognitive impairment ( Colcombe & Kramer, 2003 ; Kramer, Erickson, & Colcombe, 2006 ; Scarmeas and colleagues, 2009 ). Based on these previous studies, we hypothesize that the association between a younger subjective age and slower memory decline is mediated by fewer depressive symptoms and more frequent physical activity.
Method
Participants
Participants were drawn from the HRS, a nationally representative longitudinal study of Americans ages 50 and older and their spouses sponsored by the National Institute of Aging (grant number NIA U01AG009740) and conducted by the University of Michigan. HRS participants are interviewed every 2 years, which includes measures of depression, physical health, and a cognitive assessment. Starting in 2006, HRS implemented an enhanced face-to-face interview that included a psychosocial questionnaire that was left to participants at the end of interview to complete at home and returned by mail to study offices. Subjective age was first assessed in the questionnaire in 2008 among half of the participants; we used this assessment as our baseline measure. The 2010 wave was used to assess depressive symptoms and physical activity, and the 2012 wave was used as the follow-up assessment of memory. We restricted the analysis to participants aged 50 years and older in 2008 (i.e., spouses younger than 50 were not included in the analysis) who had data available on all variables of interest, including demographic and health-related covariates. With outliers on subjective age removed (see subjective age section), the baseline sample included 5,809 participants (59% female) who were on average, 69.30 ( SD = 9.61) years old, had an average of 12.72 ( SD = 3.00) years of education, and were 85% white. Among these participants, 4,658 also completed the memory measures in 2012, and 3,631 had measures of depressive symptoms and physical activity in both 2008 and 2010. Figure 1 depicts a schematic representation of the time of data collection for the different variables included in the present study. Descriptive statistics for the baseline sample are presented in Table 1 .
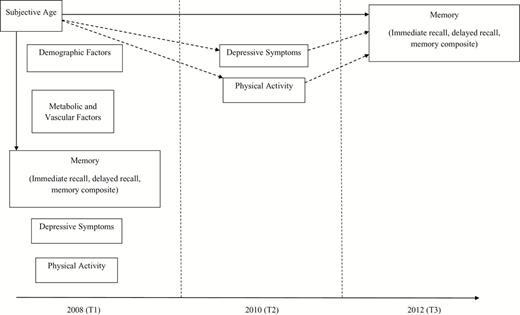
Overview of data collected in the Health and Retirement Study as used in the present study. Subjective age was used to predict memory in 2008, and memory change from 2008 to 2012 (full line), controlling for demographic, metabolic, and vascular factors. We also examined the mediating role of changes in depressive symptoms and physical activity between 2008 and 2010 in the relation between subjective age and memory changes (dotted line).
Baseline Characteristics of the Sample
| Variables | M /% | SD |
|---|---|---|
| Sex (% female) | 59% | — |
| Age (years) | 69.30 | 9.61 |
| Education | 12.72 | 3.00 |
| Ethnicity (% white) | 85% | — |
| High blood pressure | 61% | — |
| Diabetes | 21% | — |
| Stroke | 7% | — |
| BMI | 28.15 | 5.81 |
| Subjective age a | 0.16 | 0.15 |
| Baseline immediate recall | 5.44 | 1.59 |
| Baseline delayed recall | 4.37 | 1.92 |
| Baseline memory composite | 9.81 | 3.29 |
Notes:N = 5809.
a Subjective age = (chronological age-felt age)/chronological age.
Attrition analysis on baseline values revealed that those with complete data on the three waves were more educated, t (5807) = 4.97, p < .001, and d = .13, younger, t (5807) = 15.02, p < .001, and d = .40, physically active, t (5082) = 8.96, p < .001, and d = .28, and had higher BMI, t (5807) = 7.97, p < .001, and d = .22, than those with incomplete data. Participants who were not tested at follow-up were more likely to be male, χ2 (1, 5809) = 24.98, p < .001 and more likely to have experienced a stroke χ2 (1, 5809) = 34.91, p < .001 than those who completed the follow-up. Controlling for demographic factors, participants with complete data on the three waves performed slightly better on immediate recall, F (1, 5803) = 33.34, p < .001, delayed recall, F (1, 5803) = 33.28, p < .001, and thus had slightly higher combined memory scores, F (1, 5803) = 39.82, p < .001, at baseline.
Measures
Subjective age
Subjective age was assessed by asking participants to specify, in years, how old they felt. Proportional discrepancy scores were calculated by subtracting participants’ felt age from their chronological age, and these difference scores were divided by chronological age ( Eibach, Mock, & Courtney, 2010 ; Rubin & Berntsen, 2006 ; Stephan and colleagues, 2014 ). A positive value indicated a youthful subjective age, and a negative value indicated an older subjective age. For example, a participant who scored +0.10 felt 10% younger, whereas a participant who scored −0.10 felt 10% older than their actual age. In line with previous studies ( Stephan and colleagues, 2014 ; Weiss & Lang, 2012 ), responses 3 SD s above or below the mean discrepancy were considered outliers and were removed ( n = 88).
Memory
Memory was assessed in 2008 and 2012 using immediate and delayed recall tasks (for detailed information, Ofstedal, Fisher, & Herzog, 2005 ). The interviewer read one of four possible lists of 10 nouns and then asked the participant to recall them immediately. The lists did not overlap in word content. The initial list was randomly assigned to the respondent, but each respondent was assigned a different set of words in each successive wave of data collection. The assignment was also made so that two respondents in the same household (i.e., spouses) were not assigned the same set of words in the same or adjacent waves. After approximately 5min of other survey questions, the respondents were asked to recall the nouns previously presented as part of the immediate recall task. The number of words that were recalled correctly was counted for the recall tasks, with a possible range of 0–10 for each task. The correlation between immediate and delayed recall was .75 ( p < .001) at baseline and .77 ( p <. 001) at follow-up. A composite of the immediate and delayed recall was also used as an index of memory performance, with a possible range from 0 to 20 ( Infurna & Gerstorf, 2013 ; Ofstedal and colleagues, 2005 ).
Depressive symptoms
Depression was measured at baseline and 2010 using an 8-item version of the Centers for Epidemiologic Research Depression scale (CES-D) ( Wallace and colleagues, 2000 ). Participants were asked to report whether they had experienced eight specific symptoms for much of the past week (yes/no). The total number of endorsed symptoms was summed to create a total depressive symptom score ranging from 0 to 8.Cronbach alpha was .81 both at baseline and in 2010.
Physical activity
At baseline and in 2010, participants rated how frequently they participated in vigorous and moderate activities with two items using a scale ranging from 1 (hardly ever or never) to 4 (more than once a week) ( Stephan, Sutin, & Terracciano, 2014 ). The correlation between moderate and vigorous physical activity was .41 ( p < .001) at baseline and .48 ( p < .001) in 2010. Answers to the two items were averaged to give an overall physical activity score ( Stephan and colleagues, 2014 ).
Covariates
Baseline age (in years), sex (coded as 1 for men and 0 for women), ethnicity (coded as 1 for white and 0 for other), and educational level (in years) were included as covariates. Age squared was also included given the nonlinear age-related cognitive changes across adulthood and old age (Nyberg, Lövdén, Riklund, Lindenberger, & Bäckman, 2012; Verhaeghen & Salthouse, 1997 ). Baseline BMI based on self-reported height and weight was calculated as kg/m 2 and was included as a metabolic covariate. Participants were asked whether they had been diagnosed with high blood pressure, diabetes, and stroke. These vascular risk factors were also included as covariates.
Data Analysis
Regression analyses were first conducted to predict baseline memory measures from baseline subjective age, controlling for demographic (age, age squared, sex, ethnicity, education), metabolic (BMI), and vascular (blood pressure, diabetes, and stroke) factors. These analyses were repeated using follow-up memory as the outcome, controlling for the same covariates and baseline memory performance. A bootstrapping method with n = 5,000 bootstrap resample was employed to test whether depressive symptoms and physical activity mediated the association between subjective age and the memory measures, controlling for the covariates, and baseline depressive symptoms, physical activity, and memory. As a mediation technique, bootstrapping involves resampling the data a preset number of times, in this case 5,000 samples, and estimating the indirect effect in each resample to obtain an approximation of the sampling distribution of the indirect effect along with confidence intervals (CIs) ( Preacher & Hayes, 2008 ). An empirical approximation of the sampling distribution of indirect effects is generated and used to construct 95% CIs for the indirect effects. Point estimates of indirect effects are considered significant when zero is not contained in 95% CIs ( Preacher & Hayes, 2008 ). Because of the large sample size, we set p to <.01 for all analyses.
Results
Cross-Sectional Associations Between Subjective Age and Memory Measures
As expected, at baseline, a younger subjective age was associated with better immediate recall, delayed recall, and the composite memory score, controlling for demographic, metabolic, and vascular variables ( Table 2 ). The association of subjective age with memory performance was comparable or stronger than the association of memory performance with BMI, high blood pressure, diabetes, and stroke. We used Infurna and Gerstorf’s (2013, 2014) method to quantify the effect size of subjective age in terms of years of aging on memory. Specifically, the unstandardized coefficient for subjective age was multiplied by its standard deviation and divided by the unstandardized coefficient for chronological age. Results in Table 2 suggested that a 1 SD higher subjective age discrepancy score (i.e., feeling younger) was associated with 1.68 fewer years of aging on immediate recall, 1.45 fewer years of aging on delayed recall, and 1.71 fewer years of aging on total memory. The associations between subjective age and immediate recall ( β = .06, p < .001), delayed recall ( β = .06, p <. 001), and the total memory composite ( β = .06, p <.001) were unchanged when age and age squared were not included in the analysis.
Summary of Regression Analysis Predicting Memory Performances
| Variables | Cross-sectional associations | Longitudinal associations | ||||||||||
|---|---|---|---|---|---|---|---|---|---|---|---|---|
| Immediate recall | Delayed recall | Memory composite | Immediate recall | Delayed recall | Memory composite | |||||||
| B(SE) | Β | B(SE) | β | B(SE) | β | B(SE) | β | B(SE) | Β | B(SE) | β | |
| Age | −.05(.00) | −.28** | −.06(.00) | −.29** | −.10(.00) | −.31** | −.04(.00) | −.23** | −.05(.00) | −.24** | −.09(.00) | −.24** |
| Age squared | −.00(.00) | −.08** | −.00(.00) | −.08** | −.00(.00) | −.08** | −.00(.00) | −.04** | −.00(.00) | −.07** | −.00(.00) | −.06** |
| Sex | −.54(.04) | −.17** | −.59(.04) | −.15** | −1.13(.07) | −.17** | −.23(.04) | −.07** | −.29(.05) | −.07** | −.46(.08) | −.06** |
| Ethnicity | .41(.05) | .09** | .78(.06) | .14** | 1.19(.10) | .13** | .09(.06) | .02 | .27(.07) | .05** | .31(.11) | .03* |
| Education | .16(.01) | .30** | .16(.01) | .26** | .32(.01) | .30** | .08(.01) | .14** | .09(.01) | .13** | .16(.01) | .13** |
| Blood pressure | −.10(.04) | −.03 | −.09(.05) | −.02 | −.19(.08) | −.03 | −.01(.04) | −.00 | −.02(.05) | −.01 | −.02(.08) | −.00 |
| Diabetes | −.00(.05) | −.00 | −.05(.06) | −.01 | −.05(.09) | −.01 | −.17(.05) | −.04* | −.17(.06) | −.03* | −.34(.10) | −.04** |
| Stroke | −.43(.07) | −.07** | −.46(.09) | −.06** | −.89(.15) | −.07** | −.13(.09) | −.02 | −.19(.10) | −.02 | −.29(.18) | −.02 |
| BMI | .01(.00) | .02 | .01(.00) | .02 | .01(.01) | .02 | .01(.00) | .03 | .01(.00) | .03 | .02(.01) | .03 |
| Baseline memory | – | – | − | − | − | − | .43(.01) | .38** | .45(.01) | .41** | .49(.01) | .44** |
| Subjective age | .56(.12) | .05** | .58(.14) | .05** | 1.14(.24) | .05** | .50(.13) | .04** | .44(.15) | .03* | .89(.26) | .04** |
| Adjusted R2 | 0.27 | 0.26 | 0.30 | 0.35 | 0.38 | 0.42 | ||||||
Notes: N = 5809 for cross-sectional analysis and N = 4658 for longitudinal associations. B = unstandardized coefficients; SE = standard error; β = standardized coefficient.
* p < .01, ** p < .001.
Longitudinal Associations Between Subjective Age and Memory Measures
Replicating prior findings ( Stephan and colleagues, 2014 ), a younger subjective age at baseline was prospectively associated with higher immediate recall, delayed recall, and total memory assessed 4 years later, controlling for demographic, metabolic and vascular covariates ( Supplementary Table S1 ).
The longitudinal analysis revealed that subjective age was also significantly associated with changes in immediate recall, delayed recall, and the composite memory score, controlling for baseline measures of memory, and the demographic, metabolic and vascular risk factors ( Table 2 ). These findings thus support the hypothesis that a younger subjective age at baseline was associated with less memory decline over the follow-up period. Analysis conducted without age and age squared found a similar pattern of association between subjective age and changes in immediate recall ( β = .04, p < .001), delayed recall ( β = .03, p < .01) and the total memory composite ( β = .04, p < .01). Results presented in Table 2 suggested that a 1 SD higher subjective age discrepancy score (i.e., feeling younger) was associated with 1.87 fewer years of aging on immediate recall changes, 1.32 fewer years of aging on delayed recall changes, and 1.48 fewer years of aging on the total memory composite changes. Figure 2 presents the memory performance of individuals 1 SD above and below the mean subjective age, adjusted for the covariates. On average, all participants declined in their ability to remember words on the list. Participants with a subjective age score 1 SD below the mean (i.e., those who felt older than their chronological age) had a roughly 20% to 70% steeper decline in immediate recall (0.52 vs. 0.30 words decline), delayed recall (0.52 vs. 0.44 words decline), and the total memory (1.02 vs. 0.74 decline) compared to participants with a subjective age score 1 SD above the mean (i.e., those who felt younger than their chronological age; Figure 2 ). Of note, for all the memory measures, the effect size of subjective age was stronger than the effect size of most of the metabolic and vascular factors ( Table 2 ).
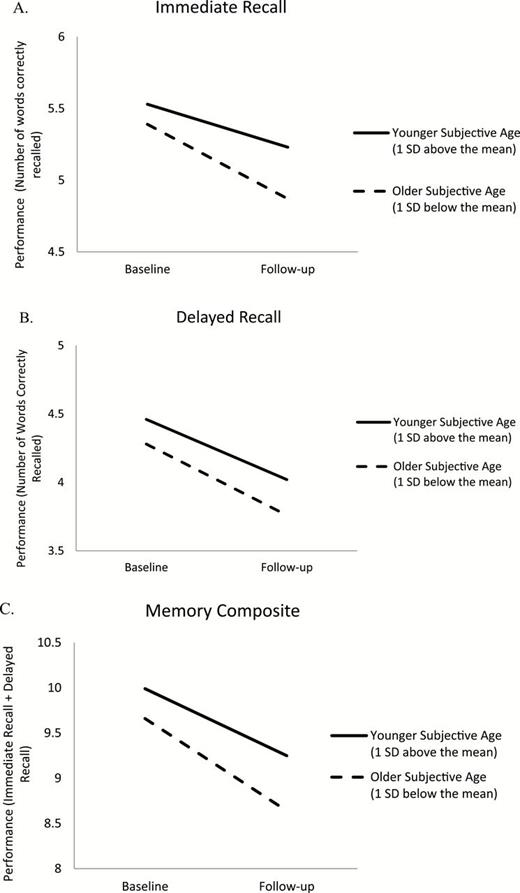
Evolution of immediate recall ( A ), delayed recall ( B ), and the memory composite ( C ) for older (1 SD below the mean) and younger (1 SD above the mean) subjective age, adjusted for baseline sociodemographic, metabolic, and vascular risk factors.
In additional analyses, we examined whether baseline memory was related to changes in subjective age. Regression analyses were conducted to predict follow-up subjective age from baseline memory measures, controlling for demographic, metabolic and vascular factors, and baseline subjective age. Results revealed that baseline memory measures were unrelated to changes in subjective age ( Supplementary Table S2 ). Furthermore, we tested the relation between changes in subjective age and changes in memory, using partial correlations between residual change scores for both subjective age and each memory measures, controlling for the covariates. These analyses revealed that the change in subjective age was unrelated to memory changes ( Supplementary Table S2 ).
Mediational Analysis
The bootstrap analysis partially supported our mediation hypothesis. Depressive symptoms mediated the association between subjective age and changes in immediate recall, delayed recall, and total recall ( Table 3 ). These results suggested that individuals who felt younger have slower decline in their immediate, delayed, and total recall performances over 4 years in part because they experienced fewer depressive symptoms over time. Although a younger subjective age was associated with more physical activity over the 2-year period, physical activity did not mediate the association between subjective age and memory measures.
Results From Bootstrap Analysis
| Dependent variable (DV) | Mediating variable (MV) | Effect of IV on MV a | Effect of MV on DV a | Direct effect of subjective age a | Indirect effect of subjective age b |
|---|---|---|---|---|---|
| Immediate recall | .28 | ||||
| Depression | −.75** | −.05** | .04(0.015; 0.077) | ||
| Physical activity | .45** | .03 | .01(−0.009; 0.042) | ||
| Delayed recall | .20 | ||||
| Depression | −.76** | −.06** | .05(0.020; 0.092) | ||
| Physical activity | .45** | .02 | .01(−0.017; 0.041) | ||
| Memory composite | .47 | ||||
| Depression | −.75** | −.11** | .08(0.033; 0.157) | ||
| Physical activity | .45** | .05 | .02(−0.021;0.079) |
Notes:N = 3631. DV: dependent variable; IV: independent variable; MV: mediating variable. Effect of baseline subjective age on 2010 depression and physical activity is calculated with adjustment for baseline depression and physical activity. Direct effect of depression and physical activity is calculated with adjustment for baseline subjective age, depression, and physical activity. Direct effect of subjective age is calculated with adjustment for baseline and 2010 depression and physical activity. All models are further adjusted for age, age squared, sex, education, ethnicity, metabolic, and vascular risk factors.
a Coefficients are unstandardized path coefficients, Bootstrap: ** p < .001.
b Bootstrap estimates and bias corrected confidence interval for indirect effects of subjective age on memory measures through depression and physical activity.
Discussion
In a large sample with a prospective design, this study found support for the hypothesis that a younger subjective age is associated with better memory performance concurrently and with slower memory decline over the follow-up period, even after accounting for demographic, metabolic, and vascular factors. The rate of memory decline observed was 20%–70% steeper among individuals who felt older than their age compared to those who felt younger. Furthermore, the strength of the association between subjective age and memory changes was stronger or comparable to the effects of recognized risk factors for cognitive decline, such as diabetes ( Reijmer and colleagues, 2011 ). Overall, the present study confirms that a younger subjective age is prospectively associated with better memory performance ( Stephan and colleagues, 2014 ) and extends prior research by showing that a younger subjective age is associated with slower rate of cognitive decline over time.
To understand the mechanisms contributing to the association between subjective age and cognitive decline, the present study tested two potential mediators, depressive symptoms, and physical activity. Contrary to our hypothesis, the physical activity measure was not a significant mediator. Consistent with our hypothesis, however, a younger subjective age at baseline was related to slower decline in immediate recall, delayed recall, and global memory functioning over 4 years in part because feeling younger was associated with fewer depressive symptoms 2 years later. The present study thus suggests that the emotional resilience of individuals who feel younger than their chronological age may help to maintain their memory function over time. Indeed lower depressive symptoms have been related to slower cognitive decline in past research ( Zahodne and colleagues, 2014 ). This idea is also consistent with prior research that showed that individuals with a younger subjective age can successfully cope with age-related changes ( Stephan, Caudroit, & Chalabaev, 2011 , Stephan and colleagues, 2014 ).
In addition to depressive symptoms, other pathways may explain the association between subjective age and cognitive decline. For example, a younger subjective age is associated with adaptive personality trajectories, including increases in openness to experience and conscientiousness over time (Stephan, Sutin, & Terracciano, in press), which have been linked to slower age-related decline in cognitive functioning (Luchetti, Terracciano, Stephan, & Sutin, in press; Sharp, Reynolds, Pedersen, & Gatz, 2010 ; Wilson, Schneider, Arnold, Bienias, & Bennett, 2007 ). Furthermore, feeling younger than one’s actual age is associated with higher memory self-efficacy ( Schafer & Shippee, 2010 ; Stephan and colleagues, 2011 ), which contributes to the maintenance of memory performance with advancing age ( Valentijn and colleagues, 2006 ). It is also plausible that the subjective age is associated with cognitive changes because it is sensitive to biological processes relevant to cognition. More precisely, it is likely that a younger subjective age may reflect slower biological aging of cardiovascular, respiratory, and muscular systems that contribute to cognition in old age ( MacDonald and colleagues, 2011 ). Experimental research revealed that a younger subjective age is a self-protective strategy that is displayed in response to exposure to negative age stereotypes ( Weiss & Freund, 2012 ; Weiss & Lang, 2012 ). Therefore, individuals with a younger subjective age may be less susceptible to the deleterious effects of these negative stereotypes on memory performances ( Levy, 2009 ).
The present study adds to current interest in gerontology and related disciplines for the role of subjective age among older adults. There is accumulating evidence for the benefits of a younger subjective age for a range of psychological and health-related outcomes across adulthood and old age ( Keyes & Westerhof, 2012 ; Kotter-Grühn and colleagues, 2009 ; Stephan and colleagues, 2013 ). This research contributes to existing knowledge and shows that the implications of a younger subjective age extend to the preservation of cognitive functioning over time. This study also adds subjective age to a growing list of factors associated with cognitive aging and supports subjective age as a potential alternative marker of developmental time ( Montepare, 2009 ). Of note, the effect size across the memory measures was found to be comparable and even stronger than those of recognized demographic, metabolic, and vascular predictors. An important and promising result concerns the identification of a relation between subjective age and changes in delayed recall. Delayed recall has a high diagnostic accuracy for differentiating patients with mild cognitive impairment from cognitively intact individuals ( Zhao, Lv, Zhou, Hong, & Guo, 2012 ) and is regarded as one of the best predictors of conversion from mild cognitive impairment to Alzheimer’s Disease ( Elias and colleagues, 2000 ; Gainotti, Quaranta, Vita, & Marra, 2014 ). Therefore, an older subjective age may be a risk factor for Alzheimer’s disease and other dementias. Clinical implications emerge as well from the overall pattern of results. In particular, an assessment of subjective age may be informative about individuals at increased risk for cognitive deficits in old age and may help tailoring interventions designed to prevent or alleviate cognitive decline.
The current study had several limitations that should be considered when interpreting the results. The generalizability of our findings is limited to some extent by the positive selection of the longitudinal participants. In addition, the present study focused only on memory functioning. Further research is needed to examine whether the observed pattern is domain-specific, or generalizes to other aspects of cognitive functioning. Additional studies are also needed to examine other potential mediators.
Despite these limitations, the present study provides clear evidence for an association between subjective age and the rate of cognitive aging. Beyond chronological age, the subjective experience of age is one alternative marker of developmental time that provides valuable insights about the mechanisms involved in cognitive decline.
Funding
This research received no specific grant from any funding agency, commercial or not-for-profit sectors.
References
Author notes
Decision Editor: Shevaun Neupert, PhD

