


Abstract
To examine trends in age-adjusted cigarette smoking prevalence among working adults by industry and occupation during 2004–2012, and to project those prevalences and compare them to the 2020 Healthy People objective (TU-1) to reduce cigarette smoking prevalence to ≤12%.
We analyzed the 2004–2012 National Health Interview Survey (NHIS) data. Respondents were aged ≥18 years working in the week prior to the interview. Temporal changes in cigarette smoking prevalence were assessed using logistic regression. We used the regression model to extrapolate to the period 2013–2020.
Overall, an estimated 19.0% of working adults smoked cigarettes: 22.4% in 2004 to 18.1% in 2012. The largest declines were among workers in the education services (6.5%) industry and in the life, physical, and social science (9.7%) occupations. The smallest declines were among workers in the real estate and rental and leasing (0.9%) industry and the legal (0.4%) occupations. The 2020 projected smoking prevalences in 15 of 21 industry groups and 13 of the 23 occupation groups were greater than the 2020 Healthy People goal.
During 2004–2012, smoking prevalence declined in the majority of industry and occupation groups. The decline rate varied by industry and occupation groups. Projections suggest that certain groups may not reach the 2020 Healthy People goal. Consequently, smoking cessation, prevention, and intervention efforts may need to be revised and strengthened, particularly in specific occupational groups.
Introduction
Tobacco use is the leading cause of preventable disease and death in the United States. 1 , 2 An estimated 480,000U.S. adults die prematurely from smoking-related illnesses. 2 Lung cancer, chronic obstructive pulmonary disease (COPD) and heart disease were among the leading causes of smoking-attributable deaths. 2 On average, life expectancy for individuals who smoke is 14 years less than that for non-smokers. 3 Smoking costs an estimated $130 billion in direct medical expenses and $150 billion in lost productivity and 5 billion for lost productivity due to exposure to secondhand smoke, annually. 2
Cigarette smoking prevalence among U.S. adults has been decreasing since 1965. 2 However, in the last 6 years no substantial decline has been observed (from 19.8% in 2007 to 18.1% in 2012. 2 The 2012 smoking prevalence was nearly 1.5 times the 2010 Healthy People goal (≤12%). 2 , 4 To achieve the Healthy People 2020 goal of reducing cigarette smoking to ≤12%, evidence based interventions need to be developed, implemented and the already established prevention efforts need to be strengthened. 4–7
Previous reports have shown that smoking prevalence among working adults parallels that for all U.S. adults. 8 , 9 Lee et al. 9 used the 1987–2004 NHIS data to analyze occupation-specific trends in cigarette smoking prevalence. The authors reported an overall 0.4% decline in smoking during 1987–2004 among working adults. The decline was highest among white-collar workers (e.g., education, legal occupations) and lowest among blue-collar workers (e.g., construction and extraction occupations). In a more recent report for 2004−2010, the estimated annual average prevalence of smoking was 30% or higher among mining industry workers (30.0%) and in the construction and extraction occupations (31.4%). 5 Additionally, the proportion of smoke-free worksites was lower in agriculture, forestry, fishing, mining, and construction as compared with professional and related services. 10 Previous research shows that higher intent to quit and lower smoking prevalences has been associated with the presence of smoke-free workplace policies and workplace smoking cessation programs. 11 Furthermore, workplace culture (i.e., pace of work, constantly moving from one worksite to other, frequently changing employers), higher job stressors, nature of work, workers’ education level were some of the factors related to disparities in smoking among construction workers and other blue collar workers as compared with white collar workers. 11
Identifying the direction of smoking trends by industry and occupation may be useful in revising current strategies, guiding policies, and or developing new approaches to smoking cessation programs. Furthermore, it may help in evaluating the effectiveness of current smoking cessation, prevention, and intervention efforts. 5 , 9 , 12 In this study, we report cigarette smoking prevalence trends using the 2004–2012 NHIS data for working adults aged ≥18 years by major industry and occupation. In addition, we project the 2020 smoking prevalences, assuming that recent trends continue, and compare the results with the 2020 Healthy People goal for cigarette smoking prevalence. 4
Methods
The NHIS data are collected annually from a nationally representative sample of the non-institutionalized U.S. population. Data have been collected since 1957. Participation in the survey is voluntary. A single, randomly selected adult household member is interviewed in person. 13 The survey response rate during the study period ranges from 72.5% in 2004 to 61.2% in 2012.
We defined currently working adults as those that were “working at a job or business,” “with a job or business but not at work,” or “working, but not for pay, at a job or business” during the week prior to the interview. Current smokers were those that had smoked at least 100 cigarettes during their entire life and currently smoke “every day” or “some days.” Industry and occupation were coded by trained NCHS coders. 14 The industry and occupation codes were 2-digit recodes based on Census codes derived from the 2002 and 2007 North American Industrial Classification System (NAICS) and the 2002 and 2010 Standard Occupational Classification codes (SOC). 14 Additional information on NAICS and SOC is available at http://www.census.gov/epcd/www/naics.html . Because of the changes in the industry and occupation coding schemes introduced in 2004, direct comparisons of industry and occupation codes with those previously reported was not possible. Further information is available at http://www.cdc.gov/nchs/nhis/nhis_2004_data_release.htm
The 2004–2012 NHIS included 254,630 adult respondents; of these 152,253 were working during the week prior to the interview. Annually the number of working adults ranged from 19,235 in 2004 to 20,038 in 2012. Sample weights provided by NCHS were used to account for the complex sampling design and non-response. Respondents (1,197) with no information on smoking (i.e., responses “don’t know,” “refused” or missing) were excluded.
SAS® 9.3 software (SAS Institute Inc.) was used for analyses. We estimated annual average age-specific and age-adjusted smoking prevalences with corresponding 95% confidence intervals (CIs). We examined annual trends in current cigarette smoking by age (age-specific prevalence), gender, race/ethnicity, education, income, health insurance, industry, and occupation (age-adjusted prevalences). The annual smoking prevalences were age-adjusted (direct method) using the year 2000U.S. population as the standard. 15 Using the surveyreg procedure, significance of trends in the model was assessed by evaluating the parameter for years (used as a continuous variable). The average rates of change over time were assessed using the surveylogistic procedure. By extrapolating the fitted logistic model, we calculated the projected 2020 prevalence of smoking with corresponding 95% prediction interval (PI) for each industry and occupation.
Results
During 2004–2012, of the estimated 225 million U.S. adults, an annual average estimated 141 million (62.6%) were working in the week prior to the interview ( Table 1 ). Of these, 19.0% (age-adjusted) were current cigarette smokers. Smoking prevalence was highest among adults aged 18–44, males, non-Hispanic Whites, those with high school education or less, <$35,000 annual household income, and those with no health insurance coverage.
Smoking Prevalence, Trend, and Projected 2020 Smoking Prevalence by Select Demographic Characteristics, 2004–2012 National Health Interview Survey
| Characteristics | No. in sample | Working population a (in 1,000s) | Estimated smoking prevalence b | Smoking trend 2004–2012 c | Projected 2020 smoking prevalence c | |||
|---|---|---|---|---|---|---|---|---|
| Pb | 95% CI | % change | p value | % | 95% PI | |||
| Age group (years) | ||||||||
| 18–24 | 15,910 | 17,822 | 22.5 | 21.6−23.5 | −6.6 | <.0001 | 11.1 | 9.0−13.5 |
| 25–44 | 71,709 | 63,940 | 21.6 | 21.2−22.1 | −3.3 | <.0001 | 16.3 | 14.9−17.9 |
| 45–64 | 57,380 | 53,504 | 19.3 | 18.8−19.7 | −3.0 | <.0001 | 14.6 | 13.1−16.2 |
| ≥65 | 7,254 | 5,597 | 9.6 | 8.8−10.4 | −4.0 | <.0001 | 6.3 | 4.2−9.2 |
| Gender | ||||||||
| Male | 75,261 | 75,298 | 20.9 | 20.4−21.4 | −3.2 | <.0001 | 16.2 | 14.8−17.6 |
| Female | 76,992 | 65,565 | 16.8 | 16.4−17.2 | −3.3 | <.0001 | 12.7 | 11.6−14.0 |
| Race/Ethnicity | ||||||||
| Hispanic | 28,071 | 19,750 | 13.6 | 13.0−14.2 | −4.2 | <.0001 | 9.4 | 7.9−11.1 |
| Non-Hispanic White | 92,562 | 97,659 | 21.0 | 20.5−21.4 | −2.7 | <.0001 | 17.1 | 15.9−18.5 |
| Non-Hispanic Black | 22,098 | 15,715 | 17.3 | 16.5−18.0 | −4.0 | <.0001 | 12.0 | 10.2−14.0 |
| Other | 9,522 | 7,738 | 13.7 | 12.7−14.7 | −4.7 | .0004 | 8.8 | 6.5−11.8 |
| Education | ||||||||
| ≤High school | 56,221 | 51,162 | 27.1 | 26.5−27.6 | −1.5 | .0017 | 25.3 | 23.1−27.6 |
| >High school | 95,057 | 88,791 | 14.3 | 14.0−14.7 | −3.7 | <.0001 | 10.3 | 9.4−11.3 |
| Unknown d | 975 | 909 | 20.1 | 16.2−23.9 | − e | − | − | − |
| Household income | ||||||||
| $0–$34,999 | 40,855 | 28,736 | 26.5 | 25.9−27.2 | −1.3 | .013 | 24.9 | 22.5−27.4 |
| $35,000–$74,999 | 49,371 | 45,171 | 20.9 | 20.4−21.3 | −2.9 | <.0001 | 16.9 | 15.2−18.6 |
| ≥$75,000 | 46,899 | 52,195 | 14.2 | 13.7−14.6 | −6.4 | <.0001 | 7.4 | 6.4−8.6 |
| Unknown d | 15,128 | 14,761 | 17.1 | 16.3−17.9 | −6.4 | <.0001 | 8.3 | 6.2−11.0 |
| Health insurance | ||||||||
| Not insured | 29,181 | 24,525 | 27.9 | 26.8−28.9 | −2.8 | <.0001 | 24.8 | 22.3−27.6 |
| Insured | 122,592 | 115,823 | 16.9 | 16.6−17.3 | −3.6 | <.0001 | 12.4 | 11.5−13.3 |
| Unknown d | 480 | 514 | 17.9 | 13.6−22.2 | − | − | − | − |
| All working adults | 152,253 | 140,863 | 19.0 | 18.7−19.3 | −3.3 | <.0001 | 14.5 | 13.6−15.5 |
Note . CI = confidence interval; P = prevalence; PI = prediction interval.
a Estimated average annual working adults (in 1,000s) represent current U.S. workers aged 18 years, who were employed in the week prior to the interview.
b Age-adjusted to the 2,000 standard U.S. population.
c Adjusted for age (median age = 40.7).
d Refused, not ascertained, don’t know.
e Trends were not calculated when estimated prevalence for any year was unreliable (i.e., RSE > 30%).
Results of logistic regression trend analysis are shown in Table 1 . The age-adjusted smoking prevalence significantly declined from 22.4% in 2004 to 18.1% in 2012, corresponding to an annual average reduction of 3.3% ( p < .001) ( Figures 1 and 2 ). The annual average smoking prevalence declined among all demographic subgroups ( Table 1 ). The smallest decline was among those with high school education or less (annual average decline: 1.5%, p = .0017), those with <$35,000 household income (1.3%, p = .013) and those with no insurance (2.8%, p < .0001). The projected 2020 age-adjusted smoking prevalence was greater than twice the Healthy People goal of ≤12% among workers with a high school degree or less (25.3%), those with <$35,000 household income (24.9%) and those with no insurance (24.8%).
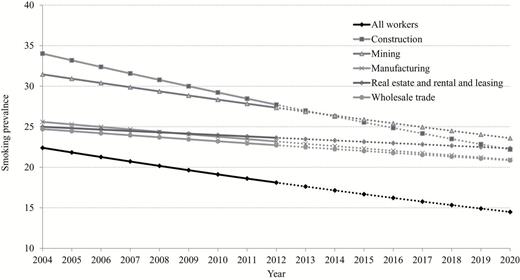
Annual average age-adjusted smoking prevalence among currently working adults in top five industries with the highest predicted 2020 prevalence—trends (2004−2012) and prediction (2013–2020), National Health Interview Survey.
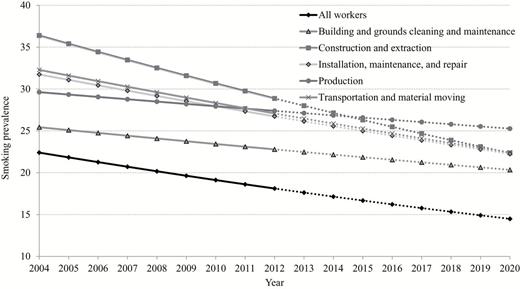
Annual average age-adjusted smoking prevalence among currently working adults in top five occupations with the highest predicted 2020 prevalence—trends (2004−2012) and prediction (2013–2020), National Health Interview Survey.
By industry, the highest smoking prevalence was among workers in accommodation and food services (28.9%), followed by construction (28.7%) and mining (27.8%). The lowest smoking prevalence was among workers in the education services (9.2%) industries ( Table 2 ). The greatest annual decline in smoking prevalence was among workers in education services (annual average decline: 6.5%, p < .0001) and finance and insurance (6.2%). The smallest decline was among workers in real estate and rental and leasing (0.9%, p = .641). The projected 2020 smoking prevalence exceeded 20% among workers in the mining (23.6%), real estate and rental and leasing (22.3%), construction (22.2%), manufacturing (20.9%) and wholesale trade (20.2%) industries ( Table 2 and Figure 1 ).
Estimated Annual Average Number of Working Adults, Age-Adjusted Smoking Prevalence, Trend, and Projected 2020 Smoking Prevalence by Industry, 2004–2012 National Health Interview Survey
| Industry | No. in sample | Working population a (in 1,000s) | Estimated smoking prevalence b | Smoking trend 2004–2012 c | Projected 2020 smoking prevalence c | |||
|---|---|---|---|---|---|---|---|---|
| % | 95% CI | % change | p value | % | 95% PI | |||
| Accommodation and food services | 9,522 | 8,553 | 28.9 | 27.5−30.3 | −5.1 | <.0001 | 18.7 | 15.3−22.7 |
| Construction | 10,161 | 10,127 | 28.7 | 27.4−30.0 | −3.6 | .001 | 22.2 | 18.0−27.1 |
| Mining | 694 | 661 | 27.8 | 23.0−32.6 | −2.4 | .466 | 23.6 | 12.1−40.8 |
| Administrative and support and waste management and remediation services | 6,674 | 5,817 | 24.2 | 22.8−25.6 | −3.0 | .028 | 19.2 | 14.5−25.0 |
| Transportation and warehousing | 6,172 | 5,787 | 23.5 | 22.0−25.0 | −3.9 | .004 | 17.4 | 13.1−22.8 |
| Manufacturing | 15,253 | 14,677 | 22.9 | 21.7−24.0 | −1.6 | .049 | 20.9 | 17.7−24.6 |
| Real estate and rental and leasing | 3,137 | 2,892 | 22.5 | 20.4−24.5 | −0.9 | .641 | 22.3 | 15.1−31.8 |
| Retail trade | 15,096 | 14,540 | 22.4 | 21.5−23.3 | −3.2 | .000 | 17.1 | 14.3−20.2 |
| Wholesale trade | 3,926 | 3,866 | 21.9 | 20.0−23.8 | −1.3 | .457 | 20.2 | 14.0−28.3 |
| Arts, entertainment, and recreation | 2,985 | 2,776 | 19.1 | 17.4−20.7 | −1.1 | .602 | 17.9 | 11.8−26.3 |
| Utilities | 1,248 | 1,244 | 18.7 | 15.5−21.9 | −1.7 | .615 | 18.0 | 8.8−33.2 |
| Agriculture, forestry, fishing, and hunting | 2,278 | 2,055 | 18.3 | 16.1−20.5 | −1.8 | .471 | 16.3 | 9.4−26.7 |
| Other services (except public administration) | 7,777 | 6,928 | 18.2 | 17.1−19.3 | −1.6 | .209 | 16.5 | 12.5−21.4 |
| Information | 3,518 | 3,326 | 16.6 | 15.1−18.2 | −3.1 | .092 | 13.4 | 8.9−19.6 |
| Health care and social assistance | 20,689 | 17,821 | 15.4 | 14.8−16.1 | −2.6 | .002 | 12.7 | 10.5−15.2 |
| Public administration | 7,739 | 6,954 | 14.4 | 13.1−15.7 | −3.6 | .009 | 10.2 | 7.4−14.0 |
| Professional, scientific, and technical services | 9,447 | 9,069 | 13.2 | 12.3−14.2 | −4.8 | .000 | 8.1 | 6.1−10.9 |
| Finance and insurance | 6,883 | 6,458 | 12.9 | 11.8−13.9 | −6.2 | <.0001 | 6.9 | 4.8−9.7 |
| Armed forces | 166 | 149 | 11.8 | 6.0−17.7 | − d | − | − | − |
| Management of companies and enterprises | 101 | 104 | 10.5 | 4.0−16.9 | − | − | − | − |
| Education services | 14,325 | 13,200 | 9.2 | 8.6−9.8 | −6.5 | <.0001 | 4.5 | 3.3−6.0 |
| Unknown e | 4,462 | 3,859 | 12.8 | 11.3−14.4 | −0.8 | .758 | 11.8 | 6.3−20.9 |
Note . CI = confidence interval; P = prevalence; PI = prediction interval.
a Estimated average annual working adults (in 1,000s) represent current U.S. workers aged 18 years, who were employed in the week prior to the interview
b Age-adjusted to the 2000 standard U.S. population.
c Adjusted for age (median age = 40.7).
d Trends were not calculated when estimated prevalence for any year was unreliable (i.e., RSE > 30%).
e Refused, not ascertained, don’t know.
By occupation, the highest smoking prevalence was among workers in construction and extraction (30.4%) followed by food preparation and serving related (29.2%) occupations. The lowest smoking prevalence was among workers in the education, training, and library (8.4%) occupations ( Table 3 ). The greatest annual decline was among workers in life, physical, and social sciences (annual average decline: 9.7%) and the smallest decline was among workers in legal (0.4%) occupations. Among workers in community and social services smoking prevalence increased over time (annual average increase: 1.1%, p = .709) ( Table 3 ). The projected 2020 smoking prevalence exceeded 20% among workers in the production (25.2%), transportation and material moving (22.4%), construction and extraction (22.4%), installation, maintenance, and repair (22.3%), and building and grounds cleaning and maintenance (20.3%) occupations ( Table 3 and Figure 2 ). The data shown in Figures 1 and 2 are the plotted predictions of the regression equation. A Supplementary Table with actual age adjusted prevalence by year and by industry and occupation is available.
Estimated Annual Average Number of Working Adults, Age-Adjusted Smoking Prevalence, Trend, and Projected 2020 Smoking Prevalence by Occupation, 2004–2012 National Health Interview Survey
| Occupation | No. in sample | Working population a (in 1,000s) | Estimated smoking prevalence b | Smoking trend 2004–2012 c | Projected 2020 smoking prevalence c | |||
|---|---|---|---|---|---|---|---|---|
| % | 95% CI | % change | p value | % | 95% PI | |||
| Construction and extraction | 8,231 | 8,096 | 30.4 | 28.9−31.8 | −4.2 | .000 | 22.4 | 17.8−27.7 |
| Food preparation and serving related | 7,861 | 7,085 | 29.2 | 27.9−30.6 | −5.1 | <.0001 | 19.2 | 15.5−23.6 |
| Transportation and material moving | 8,503 | 8,133 | 27.8 | 26.5−29.1 | −3.1 | .007 | 22.4 | 17.9−27.8 |
| Installation, maintenance, and repair | 4,956 | 5,089 | 26.8 | 25.2−28.4 | −3.0 | .028 | 22.3 | 17.0−28.6 |
| Production | 9,657 | 8,879 | 26.0 | 24.7−27.4 | −1.4 | .196 | 25.2 | 20.1−30.6 |
| Healthcare support | 3,989 | 3,139 | 22.9 | 21.2−24.6 | −2.8 | .077 | 18.7 | 13.5−25.3 |
| Building and grounds cleaning and maintenance | 6,681 | 5,566 | 22.4 | 21.1−23.8 | −1.8 | .207 | 20.3 | 15.4−26.5 |
| Farming, fishing, and forestry | 1,196 | 1,016 | 20.2 | 16.8−23.6 | −1.4 | .715 | 18.6 | 8.1−37.2 |
| Sales and related | 15,058 | 14,483 | 20.1 | 19.2−20.9 | −3.9 | <.0001 | 14.2 | 11.9−16.8 |
| Personal care and service | 5,280 | 4,418 | 19.0 | 17.8−20.2 | −4.2 | .004 | 13.0 | 9.5−17.6 |
| Office and administrative support | 20,239 | 18,276 | 18.5 | 17.8−19.2 | −2.3 | .002 | 15.5 | 13.2−18.2 |
| Protective service | 3,026 | 2,772 | 16.0 | 14.2−17.7 | −2.7 | .198 | 12.7 | 8.0−19.5 |
| Management | 13,377 | 13,187 | 15.8 | 14.9−16.7 | −3.4 | .001 | 11.6 | 9.3−14.3 |
| Arts, design, entertainment, sports, and media | 2,948 | 2,730 | 13.9 | 12.2−15.6 | −5.4 | .012 | 7.5 | 4.4−12.3 |
| Business and financial operations | 6,661 | 6,032 | 13.6 | 12.5−14.8 | −3.3 | .021 | 10.0 | 7.2−13.7 |
| Architecture and engineering | 2,704 | 2,704 | 13.0 | 11.2−14.8 | −4.1 | .088 | 7.8 | 4.6−12.7 |
| Military | 171 | 153 | 12.0 | 6.2−17.9 | − d | − | − | − |
| Computer and mathematical | 3,945 | 3,746 | 11.8 | 9.8−13.8 | −4.6 | .023 | 7.2 | 4.6−11.0 |
| Healthcare practitioners and technical | 7,862 | 7,198 | 11.4 | 10.5−12.3 | −2.5 | .079 | 9.5 | 6.8−13.0 |
| Community and social services | 2,765 | 2,368 | 11.2 | 9.6−12.7 | +1.1 | .709 | 13.6 | 7.4−23.7 |
| Legal | 1,664 | 1,614 | 9.1 | 7.3−10.9 | −0.4 | .910 | 10.0 | 4.5−20.6 |
| Life, physical, and social science | 1,541 | 1,410 | 8.9 | 7.0−10.7 | −9.7 | .009 | 2.9 | 1.1−7.4 |
| Education, training, and library | 9,431 | 8,852 | 8.4 | 7.7−9.1 | −5.4 | .001 | 4.5 | 3.1−6.6 |
| Unknown e | 4,507 | 3,917 | 12.6 | 11.0−14.1 | −0.5 | .842 | 11.9 | 6.5−20.9 |
Note . CI = confidence interval; PI = prediction interval.
a Estimated average annual working adults (in 1,000s) represent current U.S. workers aged 18 years, who were employed in the week prior to the interview
b Age-adjusted to the 2000 standard U.S. population.
c Adjusted for age (median age = 40.7).
d Trends were not calculated when estimated prevalence for any year was unreliable (i.e., RSE > 30%).
e Refused, not ascertained, don’t know.
Discussion
From 2004–2012, the age-adjusted cigarette smoking prevalence among working adults declined 3.3% annually. The greatest decline was among workers in the education services industry (e.g., schools, colleges, universities and other business, technical, and trade schools and training places) and in the education, training, and library occupations (e.g., preschool, elementary, postsecondary, secondary, and special education teachers, librarians, archivists, curators, and museum technicians). Our findings support previous reports showing that in teaching and in legal occupations smoking prevalences remained low and have been steadily declining. 5 , 9 , 12 , 16 These low prevalences among the teaching and legal occupations may be explained, in part, by the fact, that a high percentage of workers in these occupations are covered and required to abide by smoke-free workplace policies, including smoke-free worksites. 16 Over 90% of teachers in primary school and more than 80% of workers in professional specialty occupations (e.g., lawyers, professors, scientists, health diagnosing occupations) were covered under the smoke-free workplace policies in 1999. 16 In contrast, only 43% of workers in food preparation and services occupations and 52% of blue collar workers were covered by the smoke-free workplace policies in the same year. 16 Compared to workers in worksites with minimal (partial workplace and common area bans) or no smoking restrictions, Farrelly et al., 17 reported a 6% decrease in the prevalence of cigarette smoking and a 14% reduction in the average daily cigarette consumption among those that smoke and work in 100% smoke-free worksites. 17
Workplace smoke-free policies are cost effective, with substantial benefits to employers and workers. 18 Benefits to employers may include decreased risk for fires, reduced workplace cleaning cost, reduced health-care costs, reduced absenteeism, and increased productivity. 18 , 19 Benefits to workers may include reduced exposure to second hand smoke and overall improvement in health. 18 An employer could save an average of $5,816/year for every smoker who quits, which includes costs incurred for lost productivity due to smoking breaks ($3,077) and for excess health care costs ($2,056/year). 20
Socioeconomic factors such as education, income, and other factors such as type of work and work stress are strongly associated with smoking. 21 , 22 This study showed that, workers with lower education (less than high school education), and lower household income (≤$35,000), and those with no health insurance, had higher smoking prevalences and lower declining trends as compared with other workers. A multinational study on smoking cessation practices found that when compared with those who had a college education and >$70,000 in income, smokers with less than high school education and ≤$30,000 in income were less likely to quit, and attempts to quit smoking was less likely to be successful. 23 Furthermore, Ham et al. 11 reported that smoking cessation benefits are least available to worker groups with the highest prevalence of smoking and that these programs are not distributed equally across all occupational categories. 11 A decrease in smoking among employees and increase in health and economic gains to the employers have been associated with the presence of a workplace smoking cessation and health promotion programs. 11 , 24 The high smoking prevalence and low quit ratio among those in the lower education and low income groups may be associated with other factors which include lack of motivation to quit, lack of awareness of harmful effects of tobacco use, lack of access to cessation intervention programs, reduced social support and using smoking as a coping mechanism to deal with stress. 22
Previous studies have reported a greater prevalence of smoking among workers in construction, accommodation and food services, and mining industry and construction and extraction , and food preparation and serving related occupations. 5 , 9 , 12 Our results show smoking prevalences to be declining among these workers. However, the projected 2020 smoking prevalences in these groups were still greater than 1.5 times the Healthy People 2020 goal. 4 Previous research indicates that it is possible to reduce smoking in specific occupational groups. 25–27 In a study among construction workers, testing the efficacy of tailored interventions to reduce smoking; Sorensen et al. reported a 19% reduction in smoking prevalences among the intervention group. 27 Furthermore, combining health promotion activities with occupational health and safety training and have proven beneficial in reducing smoking among hourly and blue collar workers. 26 , 27 In addition, integrating messages about job risks and risk-related behaviors among workers may increase worker motivations to make health-behavior changes. 26–28 Because smoking prevalence differed by job category, it is critical to identify the underlying causes for higher smoking prevalences while taking into account the occupational disparities in smoking for developing tailored interventions which may help in increasing quit rates among smokers, improving health and be cost-effective for employers. 29 , 30
During 2004–2012, workers in 18 of the 21 industries and 16 of the 23 occupations had an estimated annual average smoking prevalence higher than Healthy People 2020 goal of ≤12%. However, the marked declines in smoking prevalence during 2004–2012 among workers in certain industries (e.g., professional, scientific, and technical services ) and occupations (e.g., education, training, and library ) demonstrates that achieving low smoking prevalence is possible. Therefore, more efforts are needed to meet the Healthy People 2020 goal of reducing cigarette smoking prevalence among adults which may require revision of the currently available interventions and to tailor them to the interests, challenges, and needs of workers. 2 , 11 , 27 , 31 The findings in this report underscore the need for enhanced efforts to reduce workplace tobacco exposure by implementation of evidence-based smoke-free policies to reduce secondhand smoke exposure and tobacco use in workplaces. 32 The revised workplace interventions and policies may need to consider workers’ sociodemographic characteristics, ability of workers who travel from one job site to the other to access worksite-based interventions, and location and nature of work. 11
Results from this study indicate a steady decline in cigarette smoking prevalences among working adults since 2004. However, in certain industries and occupation the declines were much slower. We extrapolated the estimated trend 7 years beyond the end of the observed data assuming that the current smoking trends will persist. However, it is likely that the rate of the decline will change or the rate may increase. Because our predictions are based on the assumption that demographic characteristics of the population, smoking policies, interventions, incentives to quit smoking, tendency to switch to other forms of tobacco (e.g., snuff, chewing tobacco, e-cigarettes) 32–34 will remain unchanged, the projected prevalence should be interpreted with caution.
This study has at least five limitations. First, respondents may self-select to participate in the survey based on their smoking status (i.e., those who currently smoke may be less likely to participate). Furthermore, smoking prevalence estimates were based on self-reported data. Current cigarette smokers may not have reported their habit based on their perceived social desirability. 35 However, previous studies have shown that the self-reported data on current smoking have high validity when compared with measured serum cotinine (87.5% sensitivity and 89.2% specificity). 36 , 37 Second, in some industries and occupations, the number of currently smoking workers was too small in certain years to estimate temporal trends. Third, despite increasing diversity of tobacco products use among U.S. adults, this report assessed only cigarette use. 32–34 With the increase in implementation of smoke-free workplace policies, it is likely that cigarette smokers may quit smoking in favor of new forms of nicotine delivery systems (i.e., e-cigarettes or smokeless tobacco). The 2004–2012 NHIS was not designed to collect data on e-cigarette use. Information on smokeless tobacco use was only collected in 2005 and 2010 and no significant change in the prevalence of smokeless tobacco use was observed among workers from 2005 (2.7%) to 2010 (3.0%). 38 Future research should determine the proportion of cigarette smokers who quit smoking in favor of other forms of tobacco. Fourth, the major industry and occupation groups that were analyzed limits identification of specific occupations associated with cigarette smoking. Finally, we fit our models with logistic models which produce parameters that correspond to odds ratios, therefore, our estimates of average annual decline derived from this model may be biased upward. 39
In summary, although in a majority of industries and occupations the age-adjusted smoking prevalence declined significantly over time, the current decline rates indicate that the smoking prevalence in certain industries and occupations may not reach the 2020 Healthy People goal. To overcome this, in concert with implementation of smoke-free policies at workplaces, other effective community-based strategies that increase tobacco cessation including increasing the unit price of tobacco products, mass media campaigns, and comprehensive smoke-free policies are needed. 11 , 40 Furthermore, workplace smoking cessation, prevention and intervention efforts could be tailored to the interests, challenges, and needs of a specific industry or occupation groups, in particular among those with high prevalences of smoking.
Supplementary Material
Supplementary Table can be found online at http://www.ntr.oxfordjournals.org
Funding
Study was supported by the National Institute for Occupational Safety and Health , Centers for Disease Control and Prevention.
Declaration of Interests
None declared.
Acknowledgments
The authors would like to thank C.M. Burchfiel, PhD, Health Effects laboratory Division, National Institute for Occupational Safety and Health, CDC, for helpful comments. The findings and conclusions in this report are those of authors and do not necessarily represent the views of the National Institute for Occupational Safety and Health.
References

Comments