


Abstract
This substudy of the Swiss Nursing Homes Human Resources Project (SHURP) explored the relationships between affective organizational commitment (AOC) levels and organizational, situational, and care personnel characteristics, and between AOC and care personnel outcomes.
SHURP was a representative national cross-sectional study in 163 Swiss nursing homes. Its data sources were: (a) a care personnel questionnaire, (b) a facility questionnaire, (c) a unit questionnaire, and (d) administrative resident data. Generalized estimating equations (GEEs) were applied to examine AOC’s relationships with selected antecedents and care personnel outcomes.
Data were collected from 5,323 care personnel in 163 nursing homes (return rate: 76%). On a scale from 1 to 5, the mean level of AOC was 3.86 (standard deviation = 0.81). Variations in AOC regarding care personnel characteristics (age, education, and experience in nursing home) and organizational characteristics (size, profit status) were statistically significant with minimal effect sizes. The main factors positively related to AOC were leadership, job satisfaction, quality of care, and collaboration with the nursing home director. Care personnel outcomes significantly related to higher AOC were reduced intention to leave, health complaints, presenteeism, and absenteeism.
As leadership is a crucial factor of AOC, its development might improve care personnel outcomes such as intention to leave or absenteeism.
Organizational commitment (OC) is an organizational concept widely examined in different settings due to its importance for organizational performance and effectiveness. Meyer and Allen (1997) developed a broadly accepted framework to analyze OC in terms of its affective, continuance, and normative aspects. The first of these, affective organizational commitment (AOC), refers to employees’ emotional attachment to, identification with, and involvement in the organization (Meyer & Allen, 1997). Affectively committed organizational members stay with the organization because they believe in and support its goals and values (Westphal & Gmür, 2009).
High AOC is related to innovation, performance, motivation of employees, and staff satisfaction (Mathieu & Zajac, 1990). Lack of AOC has been identified as a predictor for nursing home staff turnover (Ingersoll, Olsan, Drew-Cates, DeVinney, & Davies, 2002; Karsh, Booske, & Sainfort, 2005). In today’s nursing shortage environment, recruitment and retention of health care personnel are major challenges. Accordingly, a clear understanding of the antecedents and consequences of AOC of care workers in nursing homes can be helpful in designing policies and interventions to increase staff commitment and reduce turnover. This substudy of the Swiss Nursing Homes Human Resources Project (SHURP) explores the relationships between AOC levels and organizational, situational, and care personnel characteristics, and between AOC and care personnel outcomes.
Conceptual Framework
The conceptual model in Figure 1 illustrates the relationship between antecedents and AOC, and between AOC and care personnel outcomes. It is based on the commitment framework developed by Meyer and Allen (1997), adapted by Westphal and Gmür (2009) and complemented according to a literature review on AOC in nursing homes.
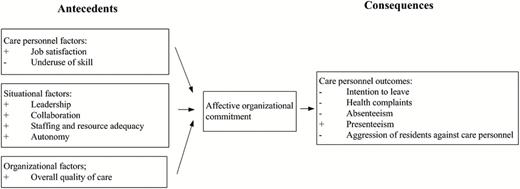
Model of antecedents and consequences of affective organizational commitment examined in Swiss Nursing Homes Human Resources Project and expected relationships (+: positive relationship, −: negative relationship).
Antecedents of AOC
Antecedents linked to AOC can be differentiated into care personnel factors, situational factors (affecting an individual employee’s situation), and organizational factors (affecting the situation of all employees; Westphal & Gmür, 2009).
As for care personnel factors, several studies found a significant positive relationship between job satisfaction and AOC in the long-term sector (Al-Hussami, 2009; Karantzas et al., 2012; Rai, 2012). Care workers who feel more satisfied with their job feel also more affection and commitment for their organization. Additionally, MacLeod and Clarke (2009) found that individuals who can effectively use their skills feel more engaged at work and are more committed to their organization’s goals and values. Accordingly, the current study examines “underuse of skill” as a predictor of AOC, a variable not previously studied in the nursing home setting.
Situational factors include leadership, collaboration, staffing and resources adequacy, and autonomy. Two studies showed that transformational leadership and higher supervisor support were related to higher AOC in nursing homes (Al-Hussami, 2009; Rodwell, Noblet, Demir, & Steane, 2009). The perceived support by the organization is expected to enhance AOC, since employees are willing to involve themselves in the organization if they perceive the organization’s willingness to fulfill its obligation to them (Al-Hussami, 2009). A recent study, however, found no significant direct relation between supervisor support and AOC (Karantzas et al., 2012); the relationship was mediated by job satisfaction. Little is known of the relationship between collaboration with nurse director, nursing home administrator, or team colleagues and AOC in nursing homes. A good collaboration with superiors might enhance AOC, since it reflects an organization’s supportive trait.
If an organization provides the context in which employees are able to provide high service quality, higher commitment is expected (Steffen, Nystrom, & O’Connor, 1996). This might be reflected on one hand in the relationship between AOC and workload, which in this study is measured in the form of perceived staffing and resource adequacy. Some researchers have suggested a linear relationship between higher workload and lower AOC (Karsh et al., 2005; Rai, 2012). However, Rodwell and colleagues (2009) have concluded that both high and low levels of job demand led to lower AOC, while moderate levels of demand lead to higher AOC. On the other hand, more job autonomy might be related to higher AOC by allowing care workers to provide high quality of care. Steffen and colleagues (1996) found that increased job autonomy was associated with higher AOC.
Finally, Karsh and colleagues (2005) found that the organizational quality environment was the strongest antecedent of commitment, which included aspects such as time provided for improvement, and the degree to which the organization rewarded quality. This leads us to expect that a higher overall quality of care should be positively related to AOC.
Outcomes of AOC
Two studies in the nursing home setting found that AOC is an important predictor of intention to leave or staff turnover (Ingersoll et al., 2002; Karsh et al., 2005). Committed employees are interested to stay in their organization. Schalk (2011) found that higher AOC was related to less reported health complaints. A possible mechanism between AOC and health complaints might be that higher commitment protects employees from the effect of stressors (Meyer, Stanley, Herscovitch, & Topolnytsky, 2002). In a meta-analysis, Meyer and colleagues (2002) found that AOC was negatively related to absenteeism, though more strongly with voluntary than with involuntary absenteeism. To our knowledge, no study examined the relationship between AOC and absenteeism or presenteeism, that is, attending work while ill, in nursing homes. A recent study in nursing homes showed that high commitment towards residents and colleagues resulted in higher presenteeism (Krane et al., 2014), but it remains unclear whether commitment toward the organization is also a factor. It might be expected that care personnel with a higher AOC will show higher presenteeism, since emotional involvement with the organization increases the desire to be present and uphold the quality of residents’ care, which might suffer from a reduced workforce. As for the experience of aggression, a longitudinal study in various healthcare settings showed that higher patient-inflicted violence significantly predicted lower AOC (Camerino, Estryn-Behar, Conway, van Der Heijden, & Hasselhorn, 2008). It can be assumed that this is also the case for resident aggression, however empirical evidence is missing.
Aim of the Study
To date, few studies have comprehensively addressed AOC in nursing homes. Specifically, little knowledge exists on differences in AOC levels in relation to facility size, catchment area, profit status, and personnel education levels. Various known antecedents and consequences have yet to be included in nursing home studies. Therefore, this substudy aimed to develop a comprehensive understanding of AOC’s antecedents and consequences regarding care personnel in nursing homes. Our objectives were: (a) to describe the level of AOC among care personnel in Swiss nursing homes; (b) to describe differences in AOC across subgroups in relation to facility size, catchment area, language region, profit status, and personnel gender, age, level of education, and nursing home experience; (c) to examine relationships between care personnel, situational, and organizational factors as antecedents of AOC, and (d) to examine AOC’s relationships with selected care personnel outcomes in Swiss nursing homes, as well as personnel’s experience of resident aggression.
Design and Methods
Study Context and Design
This observational substudy was part of the SHURP (Schwendimann et al., 2014)—a representative national cross-sectional study (2011–2013) in Swiss nursing homes. SHURP was devised to explore the relationships between various nursing home characteristics, for example, work environment, and care personnel and resident outcomes. It was approved by the leading ethics committee of the state of “Beider Basel” (Ref.Nr. EK:02/12), and by all ethics committees of cantons where nursing home administrators agreed to participate.
Setting and Sample
To select a representative sample of at least 10% of Switzerland’s 1,600 nursing homes, stratified random sampling was applied, using language region (German-, French-, and Italian-speaking) and facility size (small: ˂50 beds, medium: 50–99 beds, large: >99 beds) as strata. Inclusion criteria were official recognition as a nursing home, a bed capacity of at least 20 residents, and a staff of at least 15 care personnel directly involved in resident care. Retirement homes and assisted living facilities were excluded. For this substudy, the full dataset of SHURP was used.
Within each participating nursing home, the care personnel (i.e., registered nurses [3–6 years’ education], licensed nurses [3 years’ education], certified assistant nurses [1–2 years’ education], and nurse aids [trained on the job]) who provided direct care, understood German, French, or Italian, and had been working for at least 1 month on their unit for at least 8hr/week, were invited to participate in a questionnaire survey. Students and volunteers were excluded.
Variables and Measurement
Data were collected from four sources: (a) the care personnel questionnaire, (b) the facility questionnaire, (c) the unit questionnaire, and (d) administrative data on residents.
Care personnel’s age (year), gender (male/female), level of education (registered nurse/licensed nurse/certified assistant nurse/nurse aide), country of basic professional training (Switzerland/Germany/Italy/France/other), and nursing home experience (years) were collected from all care personnel using the personnel questionnaire. Data on facility size (number of beds), catchment area (rural/urban), language region (German/French/Italian), and profit status (public/private subsidized/private) were extracted from the facility questionnaire. In the unit questionnaire, the percentage of residents per unit either diagnosed with dementia or with dementia symptoms (but not yet diagnosed with dementia) was assessed. Nursing home resident data included the mean age, mean length of stay, and mean care load per unit. The calculation for the last item was based on the national health insurers’ reimbursement schedule. This includes a total of 12 reimbursement levels, one of which is allocated to each nursing home resident. Each increase in level represents an increase in 20min of daily care time.
In accordance with the conceptual model described in Figure 1, further variables were measured using existing scales or single items that were adapted to the nursing home context. Table 1 provides an overview of items and scales used in the study.
Overview of Items and Scales for the Measurement of Antecedents and Consequences of Affective Organizational Commitment (AOC)
| Concept measured | Instrument used, number of items/number of response categories (anchors of answer options)a | Items | Scale calculation |
|---|---|---|---|
| AOC | Fragebogen zur Erfassung von affektivem, kalkulatorischem und normativem Commitment gegenüber der Organisation, dem Beruf/der Tätigkeit und der Beschäftigungsform (COBB) (Felfe et al., 2010),b 5/5 (1 = strongly disagree to 5 = strongly agree) | • I would be very happy to spend the next years with this organization • I feel a strong sense of “belonging” to my organization • I do not feel “emotionally attached” to this organization • I am proud of working in this organization • I think, my ideals about good care fit with the ideals of this organization | Cronbach’s α: 087 |
| Corrected item-total correlation coefficients ranged between 0.50 and 0.79, showing that all items measure same construct. | |||
| Due to left skew, building of 3 groups based on mean rating over 5 items: | |||
| 1 = low AOC (1–2.99: corresponding to ratings in strongly disagree/rather disagree) | |||
| 2 = moderate AOC (3–3.99, corresponding to neutral) | |||
| 3 = high AOC (4 and higher, corresponding to rather agree/strongly agree) | |||
| Antecedents of AOC | |||
| Care personnel factors | |||
| Underuse of skill | Health Professions Stress Inventory (HPSI; Lapane & Hughes, 2007), 1/5 (0 = never to 4 = very often) | How often do you feel stressed because you are not able to use all of your skills on the job? | |
| Job satisfaction—general rating | Investigator-developed, 1/4 (1 = very dissatisfied to 4 = very satisfied) | How satisfied are you overall with your current job in this nursing home? | |
| Situational factors | |||
| Collaboration | Investigator-developed based on Safety Attitudes Questionnaire (SAQ): (Sexton et al., 2006), 3/4 (1 = very low to 4 = very high) | With respect to your experiences on this unit, use the scale to describe the quality of collaboration that you have experienced with: • team colleagues on your unit • upper nurse management/director of nursing • nursing home administrator | |
| Autonomy | Investigator-developed, 1/4 (1 = strongly disagree to 4 = strongly agree) | I can decide on my own how to go about doing my work | |
| Leadership | Practice Environment Scale—Nursing Work Index (Lake, 2007), 5/4 (1 = strongly disagree to 4 = strongly agree) | • A supervisory staff that is supportive of the care workers • Supervisors use mistakes as learning opportunities, not criticism • A nurse/unit manager who is a competent leader. • Praise and recognition for a job well done • A nurse/unit manager who backs up the care worker staff in decision making, even if the conflict is with other professions | Cronbach’s α: 0.84Mean over all items of the subscale. Respondents with answers in at least one item were counted.Higher number means better leadership. |
| Staffing and resource adequacy | Practice Environment Scale—Nursing Work Index (Lake, 2007), 3/4 (1 = strongly disagree to 4 = strongly agree) | • Enough time and opportunity to discuss resident care problems with other care workers. • Enough registered nurses/qualified personnel to provide quality resident care. • Enough staff to get the work done | Cronbach’s α: 0.74 |
| Mean over all items of the subscale. Respondents with answers in at least one item were counted. | |||
| Higher number means better staffing and resource adequacy. | |||
| Organizational factors | |||
| Overall quality of care | RN4CASTc study questionnaire, adapted for NH-use, 1/4 (1 = very low to 4 = very high) | In general, how would you rate the quality of care for the residents on your unit? | |
| Consequences of AOC | |||
| Care personnel outcomes | |||
| Health complaints | Swiss Health Survey (Bundesamt für Statistik, 2007), 5/3 (1 = not at all to 3 = strongly) | Did you suffer from any of the following conditions in the last 4 weeks: • Back pain, low-back pain • General weakness, tiredness, lack of energy • Problems with sleeping • Headache, pressure in your head or pain in your face • Pain in your joints or limbs | Cronbach’s α: 0.70Index was calculated as sum over items minus 5 (so that index starts with 0 for “no health complaints”)Higher number means more health complaints |
| Intention to leave | 2 items from the Michigan Organizational Assessment Questionnaire (MOAQ) (Cammann, Fichman, Jenkins, & Klesh, 1979), 1 item from (Mobley, Horner, & Hollingsworth, 1978), 3/5 (1 = strongly disagree to 5 = strongly agree) | • I often think about quitting my job • I will probably look for a new job in the next year • I am currently looking for another job (in another organization) | Cronbach’s α: 0.91 |
| Scale is calculated as sum over all items minus 3 (so that index starts with 0 for no intention to quit) ranging from 0 to 12. Due to left skew 3 groups were built: | |||
| 1 = low intention (0), 2 = medium intention (1–3), 3 = high intention (4–12) | |||
| Absenteeism | Swiss Health Survey (Bundesamt für Statistik, 2007) 1/number | How many days have you been off work due to your own illness in the last 4 weeks? | Building of 3 groups: 0 = no day, 1 = 1–2 days, 2 = 3 and more days |
| Presenteeism | Investigator-developed, 1/number | How many days have you gone to work in spite of feeling ill and unfit for work in the last 4 weeks? | Building of 3 groups: 0 = no day, 1 = 1–2 days, 2 = 3 and more days |
| Aggressive behavior against care personnel | RN4CASTc-nurse questionnaire, differentiation of verbal, physical and sexual aggression, description based on Ryden’s Aggression scale (Ryden, Bossenmaier, & McLachlan, 1991), 3 single items/6 (0 = never to 5 = several times a day) | Please indicate, how often residents directed any of the following behaviors against you during the past 4 weeks: • verbally aggressive behavior (e.g., cursing, name calling, hostile or obscene language, verbal threats) • physically aggressive behavior (e.g., making threatening gesture, pushing, hitting, kicking, throwing an object, scratching, spitting, pulling hairs) • sexually aggressive behavior (e.g., making obscene gesture, hugging against your will, touching intimate body parts) | Grouping of answers due to left skew: Verbal and physical aggression: 3 groups: 0 = never, 1 = less than once a week or once a week, 2 = more than once a week to several times a day Sexual aggression: 2 groups: 0 = never, 1 = less than once a week to several times a day |
aMissing values were coded as −99.
bQuestionnaire for the assessment of affective, continuant, and normative commitment toward the organization, profession/activity and employment.
cRN4CAST: Nurse forecasting in Europe, a study on the impact of nurse deployment on patient safety (Sermeus et al., 2011).
Data Collection and Management
In each nursing home, a contact person was identified to support the research team with questionnaire logistics. To ensure proper handling of questionnaires, the research team informed the contact person, the nursing home administrators, and the care personnel about the study protocol and data collection procedure via written study information. The respective questionnaires were distributed to the care personnel and nursing home administrators between May 2012 and April 2013. The personnel questionnaire was distributed via the nursing home internal mail delivery systems and included postage-paid return envelopes. Completing the questionnaire and sending it back to the research team was considered as informed consent. The nursing home administrators completed the facility and unit questionnaires either electronically or returned it in hard copies. The response rate per unit of each nursing home was checked on the basis of unit-specific numerical codes assigned to each questionnaire and reported back to the nursing home after 3 weeks of data collection. Data quality (e.g., completeness, plausibility) was verified by members of the SHURP research team.
Data omitted from the facility and unit questionnaires were provided by checking with the facilities’ coordinators. Data missing from the personnel questionnaire could not be completed due to the survey’s anonymity. A missing value analysis was performed to identify frequency and response patterns. No variable had more than 5% missing data. Listwise deletion was applied in the analyses.
Data Analysis
Descriptive statistics were calculated using appropriate measures of central tendency, frequencies, and percentages. To comply with Aim 1, the total AOC score was calculated for the entire sample. As proposed for Aim 2, scores were calculated for each relevant subgroup, and inter-subgroup differences were calculated as appropriate using either one-way ANOVA or nonparametric tests.
To fulfill Aim 3, a multiple regression model employing generalized estimating equations (GEEs) was used to test the relationships between AOC (dependent variable) and antecedents (independent variables). As a first step, as AOC data were skewed, a Spearman’s rank-order test was performed to check for correlations between the predictors and AOC scores. Coefficients with p-values of <.20 were included in the multiple regression model. Multicollinearity was tested by calculating a variance inflation factor (VIF), with the cut-off set at < 2. For the GEE model, an ordinal logistic regression was applied, comparing groups with moderate or higher AOC with low AOC (cf. Table 1 for grouping of AOC variable). The adjusted model was controlled for care personnel and facility characteristics. Using Stata/IC® 13.1, a separate multilevel ordinal logistic regression was performed, this time treating units and facilities as random effects and controlling for the nestedness of data within units and facilities. While controlling for data nestedness within facilities based on likelihood ratios improved the model, controlling for the units did not. Therefore, facility was used as the GEE subject variable. A post hoc ANOVA sensitivity analysis was performed to examine the variability of job autonomy ratings based on educational background of respondents.
Aim 4 included an analysis of the associations between AOC (independent variable) and care personnel outcomes (dependent variables). For each dependent variable, a separate, adjusted GEE model was calculated using the facility as the subject variable. The adjusted models of the care personnel outcomes were controlled for the same variables as mentioned above. The adjusted models to test the effects of resident aggression were additionally controlled for resident care load and the percentage of residents with dementia or symptoms of dementia per unit.
Data were analyzed using IBM© SPSS© Statistics for Windows©, Version 20.0 software (IBM Corp., Armonk, NY). Because of the large sample and multiple testing, a p-value of < .01 was considered significant for all inferential statistical tests.
Results
Sample Characteristics
A total of 163 facilities were included with 5,323 care workers responding (response rate: 76.3%). Of the facilities, 46.0% were medium-size (50–99 beds), 60.7% were situated in rural areas and 36.8% were public facilities. About one-third of the care personnel were older than 50 years. Half had fewer than 5 years’ professional experience in nursing homes and about one-third were registered nurses. More detailed characteristics are presented in Table 2.
Sample Characteristics
| n | Percentages (%) | |
|---|---|---|
| Facility characteristics (n = 163) | ||
| Facility size (number of beds) | ||
| Small (<50 beds) | 64 | 39.3 |
| Medium (50–99 beds) | 75 | 46.0 |
| Large (> 99 beds) | 24 | 14.7 |
| Catchment area | ||
| Rural area | 99 | 60.7 |
| Urban area | 64 | 39.3 |
| Profit status | ||
| Public | 60 | 36.8 |
| Private, publicly subsidized | 44 | 27.0 |
| Private | 59 | 36.2 |
| Language region | ||
| German-speaking | 123 | 75.5 |
| French-speaking | 31 | 19.0 |
| Italian-speaking | 9 | 5.5 |
| Care personnel characteristics (n = 5,323) | ||
| Gender (n = 5,265) | ||
| Female | 4,831 | 91.8 |
| Age (n = 5,179) | ||
| ≤30 years | 1,036 | 20.0 |
| 31–40 years | 891 | 17.2 |
| 41–50 years | 1,481 | 28.6 |
| ˃50 years | 1,771 | 34.2 |
| Education (n = 5,268) | ||
| Registered nurses (3–6 year education) | 1,633 | 31.0 |
| Licensed nurses (3 year education) | 1,170 | 22.2 |
| Certified assistant nurses (1–2 year education) | 906 | 17.2 |
| Nurse aides (on the job training) | 1,380 | 26.2 |
| Others | 179 | 3.4 |
| Country of basic professional training in care (N = 5,046) | ||
| Switzerland | 4,129 | 81.8 |
| Germany | 292 | 5.8 |
| Italy | 84 | 1.7 |
| France | 167 | 3.3 |
| Others | 347 | 7.4 |
| Experience in nursing home (n = 5,029) | ||
| ˂5 years | 2,576 | 51.3 |
| 5–10 years | 1,053 | 20.9 |
| 10–15 years | 720 | 14.3 |
| 15–20 years | 328 | 6.5 |
| ˃20 years | 352 | 7.0 |
| Unit characteristics (n = 429) | ||
| Percentage of residents with symptoms of dementia, M (SD) | 429 | 61.4 (25.1) |
| Mean age of residents, M (SD) | 413 | 84.6 (3.1) |
| Mean length of stay of residents (days), M (SD) | 412 | 1233.0 (433.0) |
| Mean care load of residents, M (SD) | 407 | 5.9 (1.6) |
General Level and Variability Between AOC Levels
The overall mean AOC score was 3.86 (standard deviation = 0.81) of a possible 5, with almost half (43%) of all care personnel reaching high (˃4.001) scores. AOC scores differed significantly between care personnel based on their facilities’ sizes, their age, level of education, and experience in nursing home, but not for gender. Between facilities, scores varied by profit status, catchment area, size, and language region (Table 3).
Differences of AOC Between Facility Characteristics and Care Personnel Subgroups
| n | Mean | SD | F-statistic | p Value | ω2 | |
|---|---|---|---|---|---|---|
| Whole sample | 5,315 | 3.86 | 0.81 | |||
| Facility size (number of beds; n = 5315) | ||||||
| Small (<50 beds) | 1,142 | 3.95 | 0.83 | F(2, 5312) = 13.427 | .000 | 0.005 |
| Medium (50–99 beds) | 2,751 | 3.89 | 0.81 | |||
| Large (>199 beds) | 1,422 | 3.79 | 0.80 | |||
| Catchment area (n = 5,315) | ||||||
| Urban area | 1,892 | 3.85 | 0.80 | F(1, 5313) = 4.428 | .035 | 0.001 |
| Rural area | 3,333 | 3.90 | 0.81 | |||
| Language region (n = 5,315) | ||||||
| German | 4,668 | 3.88 | 0.80 | F(2, 5312) = 0.954 | .385 | 0.000 |
| French | 795 | 3.86 | 0.82 | |||
| Italian | 254 | 3.94 | 0.90 | |||
| Profit status (n = 5,315) | ||||||
| Public | 2,240 | 3.83 | 0.81 | F(2, 5312) = 7.311 | .001 | 0.003 |
| Private subsidized | 1,345 | 3.89 | 0.81 | |||
| Private | 1,730 | 3.93 | 0.80 | |||
| Gender (n = 5,259) | ||||||
| Female | 4,825 | 3.88 | 0.81 | F(1, 5,257) = 0.002 | .969 | 0.000 |
| Male | 434 | 3.88 | 0.86 | |||
| Age categories (n = 5,173) | ||||||
| ≤30 years | 1,036 | 3.72 | 0.84 | F(3, 5169) = 18.619 | .000 | 0.011 |
| 31–40 years | 880 | 3.90 | 0.80 | |||
| 41–50 years | 1,478 | 3.94 | 0.79 | |||
| ˃50 years | 1,770 | 3.93 | 0.80 | |||
| Level of education (n = 5,262) | ||||||
| Registered nurses | 1,628 | 3.86 | 0.83 | F(4, 5257) = 6.376 | .000 | 0.005 |
| Licensed nurses | 1,170 | 3.82 | 0.81 | |||
| Certified assistant nurses | 904 | 3.83 | 0.82 | |||
| Nurse aides | 1,380 | 3.96 | 0.76 | |||
| Others | 180 | 3.95 | 0.85 | |||
| Experience in nursing home (n = 5,023) | ||||||
| ˂5 years | 2,573 | 3.83 | 0.84 | F(4, 5018) = 13.716 | .000 | 0.011 |
| 5–10 years | 1,051 | 3.90 | 0.78 | |||
| 10–15 years | 719 | 4.00 | 0.78 | |||
| 15–20 years | 328 | 4.04 | 0.76 | |||
| ˃20 years | 352 | 4.06 | 0.71 | |||
Notes: SD = Standard Deviation; ω2 = effect size, proportion of variance accounted for by variable under consideration, expected values: 0.01 for small effect, 0.06 for medium effect, and 0.14 for large effect (Field, 2009).
Antecedents of AOC
Statistically significant AOC antecedents were leadership (Odds ratio (OR) = 2.93), job satisfaction (OR = 2.63), overall quality of care (OR = 2.02), collaboration with nursing home director (OR = 1.63), collaboration with director of nursing (OR = 1.49), collaboration with colleagues (OR = 1.27), and staffing and resource adequacy (OR = 1.42). Underuse of skills was related to lower AOC scores (OR = 0.83). The relationship between AOC and job autonomy was not statistically significant (Table 4).
Antecedents of AOC, Multivariable GEE Model
| AOCa unadjusted | AOCa adjustedb | |||||||
|---|---|---|---|---|---|---|---|---|
| B | SE | OR | 95% CI | B | SE | OR | 95% CI | |
| Underuse of skill | −0.21*** | 0.04 | 0.81 | 0.75–0.87 | −0.19*** | 0.04 | 0.83 | 0.77−0.90 |
| Job satisfaction | 0.96*** | 0.09 | 2.62 | 2.20–3.11 | 0.97*** | 0.09 | 2.63 | 2.20–3.14 |
| Collaboration with colleagues | 0.19* | 0.07 | 1.20 | 1.04–1.39 | 0.24** | 0.07 | 1.27 | 1.10–1.47 |
| Collaboration with director of nursing | 0.43*** | 0.08 | 1.53 | 1.32–1.77 | 0.40*** | 0.08 | 1.49 | 1.29–1.73 |
| Collaboration with nursing home director | 0.49*** | 0.07 | 1.63 | 1.42–1.88 | 0.49*** | 0.07 | 1.63 | 1.48–1.87 |
| Autonomy | 0.13* | 0.06 | 1.14 | 1.04–1.29 | 0.10 | 0.06 | 1.10 | 0.98–1.24 |
| PES-NWI staffing | 0.31*** | 0.08 | 1.37 | 1.18–1.59 | 0.35*** | 0.08 | 1.42 | 1.22–1.65 |
| PES-NWI leadership | 0.89*** | 0.10 | 2.44 | 2.02–2.95 | 1.08*** | 0.10 | 2.93 | 2.43–3.53 |
| Overall quality of care | 0.67*** | 0.08 | 2.06 | 1.75–2.43 | 0.70*** | 0.08 | 2.02 | 1.72–2.37 |
Notes: B = unstandardized regression coefficient; SE = standard error; OR = odds ratio; CI = confidence interval; PES-NWI = Practice Environment Scale—Nurse Working Index.
a3 groups: low, moderate, and high commitment.
bThe adjusted model was controlled for care personnel characteristics (gender, age, education, experience in nursing home), and facilities characteristics (language region, profit status, catchment area (urban/rural), facility size).
***p < .001. **p < .01. *p < .05.
Influence of AOC on Care Personnel Outcomes
The following outcomes were significantly inversely related to higher AOC: intention to leave (OR = .10), health complaints (OR = .42), and both presenteeism (OR = .63) and absenteeism (OR = .76). As for resident aggression toward care personnel, higher AOC was significantly related to less experience of all forms of aggression (physical: OR = .83, sexual: OR = .81, and verbal: OR = .81; Table 5).
Influence of AOC on Care Personnel, Outcomes, Univariable GEE Models
| Unadjusted | Adjusteda,b | |||||||
|---|---|---|---|---|---|---|---|---|
| Care personnel outcome | B | SE | OR | 95% CI | B | SE | OR | 95% CI |
| Health complaintsc | −0.90*** | 0.05 | 0.41 | 0.37–0.45 | −0.88*** | 0.05 | 0.42 | 0.38–0.46 |
| Intention to leaved | −2.22*** | 0.06 | 0.11 | 0.10–0.12 | −2.26*** | 0.06 | 0.10 | 0.09–0.12 |
| Absenteeismd | −0.30*** | 0.05 | 0.74 | 0.67–0.82 | −0.27*** | 0.05 | 0.76 | 0.67–0.84 |
| Presenteeismd | −0.48*** | 0.04 | 0.62 | 0.57–0.67 | −0.46*** | 0.04 | 0.63 | 0.58–0.69 |
| Frequency of verbal aggression from residents against care personneld | −0.03*** | 0.04 | 0.78 | 0.73–0.85 | −0.21*** | 0.04 | 0.81 | 0.75–0.87 |
| Frequency of physical aggression from residents against care personneld | −0.20*** | 0.05 | 0.82 | 0.75–0.89 | −0.18*** | 0.05 | 0.83 | 0.76–0.91 |
| Frequency of sexual aggression from residents against care personnele | −0.25*** | 0.05 | 0.78 | 0.71–0.86 | −0.22*** | 0.05 | 0.81 | 0.73–0.88 |
Notes: B = unstandardized regression coefficient; SE = standard error; OR = odds ratio; CI = confidence interval.
aThe adjusted models were controlled for care personnel characteristics (gender, age, education, experience in nursing home), and facility characteristics (language region, profit status, catchment area (urban/rural), facility size).
bThe adjusted models for verbal, physical, and sexual aggression were controlled for care personnel characteristics (gender, age, education, experience in nursing home), facility characteristics (language region, profit status, catchment area (urban/rural), facility size), and residents characteristics (percentage of residents with diagnosis or symptoms of dementia, residents’ care load mean).
cLinear regression.
dOrdinal logistic regression.
eBinary logistic regression.
***p < .001.
Discussion
This substudy provided a comprehensive understanding of AOC among care personnel in Swiss nursing homes, its antecedents and its consequences for personnel. Though AOC level differences were statistically significant in relation to several care personnel and facility characteristics, effect sizes were very small, showing little clinical significance of the differences found. The model of AOC antecedents and consequences in nursing homes was mostly supported by the results: the strongest predictors for AOC were leadership, job satisfaction, and overall quality of care. Against expectations, job autonomy was not significantly related to AOC. As for the selected care personnel outcomes, AOC was a significant negative predictor for intention to leave and health complaints. Contradicting the model, AOC was also negatively related to presenteeism, that is, care personnel with higher AOC scores showed less presenteeism.
General Level of AOC and Differences in AOC
Confirming other studies’ observations, the overall mean AOC score of 3.86 was high (Lee, Choi, Lim, & Kim, 2013; Tuckett, Parker, Eley, & Hegney, 2009). Aged care staff generally report high AOC, despite the challenges and stresses they face (Lee et al., 2013; Tuckett et al., 2009). In this study, care personnel and facility characteristics contributed little to our study sample’s AOC variance. Consistent with the results of two meta-analyses (Meyer et al., 2002; Westphal & Gmür, 2009), the present study correlated age and length of tenure positively, albeit weakly, with AOC. For the other variables, previous research has provided contradictory results. The rarity of corroboration regarding findings may result from differences in national or organizational cultures and the use of different instruments to measure AOC. Overall, the results indicate that work environment characteristics are more influential in explaining AOC than care personnel or facility characteristics.
Antecedents
The most influential antecedent of AOC was leadership. With an increase of one unit in the rating of leadership—from “rather disagree” to “rather agree”—the odds of being in the group with high commitment versus moderate or low commitment increased by a factor of almost three. Several meta-analyses (DeGroot, Kiker, & Cross, 2000; Meyer et al., 2002) and individual studies (Al-Hussami, 2009; Mosadeghrad & Ferdosi, 2013) have observed significant relationships between different leadership styles, such as transformational leadership, and AOC. According to Bass (1999), the subdimensions of transformational leadership are idealized influence, inspirational motivation, intellectual stimulation, and individualized consideration. In the present study, leadership was measured with the PES-NWI leadership subscale, which does not cover aspects of transformational leadership, but rather puts focus on leaders’ competence and support. Our results show that care personnel are more committed when their leadership is supportive, mistakes are treated as learning opportunities, the leaders are competent, the care personnel receive praise and recognition, and care personnel are involved in decision-making processes. The importance of supportive leadership for AOC might be based on the principle of reciprocity: employees who feel supported by their organization might reciprocate with their commitment (Yoon & Thye, 2002). The results indicate that leadership development might be an important factor in fostering AOC.
The finding of a significant positive relationship between AOC and job satisfaction was consistent with those of a number of studies in the long-term care sector (Al-Hussami, 2009; Karantzas et al., 2012). In general, researchers agree that job satisfaction and AOC are separate concepts: job satisfaction is a specific short-term response to a specific task environment, job or job facets, and is less stable than AOC. A broader concept, AOC reflects the individual’s sense of belonging to the organization as a whole—a sense which develops slowly but consistently over time (Modway, Porter, & Steers, 1979). Care personnel’s job satisfaction is crucial in developing their motivation and efficiency, and enhances AOC. Both are supported by similar workplace characteristics. For job satisfaction, these include the nature of work, leadership, communication, satisfaction with co-workers, promotion opportunities, operating procedures, appreciation, recognition and rewards for good work, care quality, fringe benefits, and pay (Castle, Degenholtz, & Rosen, 2006; Moyle, Skinner, Rowe, & Gork, 2003). Castle and colleagues (2006) observed that recent quality improvements in nursing homes may have a positive impact on job satisfaction among care personnel, thereby fostering AOC and reducing turnover.
Accordingly, overall quality of care has emerged as an extremely influential antecedent of AOC. Karsh and colleagues (2005) found that commitment’s strongest association was with the organizational quality environment. It can be expected that committed long-term care personnel are more concerned about the wellbeing of the residents. Conversely, staff members’ knowledge that they are providing high care quality may also increase their commitment to their organization (Castle et al., 2006).
As effective collaboration is crucial to quality of care across an organization, another important positive predictor of AOC in nursing homes was care personnel’s sense of collaboration with their administrator, director of nursing, and colleagues. Likewise, breakdowns in communication and inter-professional interaction can lead to problems with patient care (Zwarenstein, Goldman, & Reeves, 2009). It could be shown that enhancing nursing supervisory communication skills had positive impacts not only on nurse aide performance and job satisfaction (McGilton, Hall, Wodchis, & Petroz, 2007), but increased nurses’ sense of closeness to their patients (McGilton, Irwin-Robinson, Boscart, & Spanjevic, 2006). Effectively conveying an organization’s goals and values, particularly to create an environment in which professional care can be provided, will likely also either directly or indirectly foster AOC. Moreover, a positive perception of collaboration with upper management, that is, where care personnel perceive that their contribution is valued and that the organization cares about their welfare, might reflect organizational support (Rhoades & Eisenberger, 2002). Based on social exchange theory, OC is strongest in organizations that show commitment to their employees (Eisenberger, Fasolo, & Davis-LaMastro, 1990). C. S. Chang (2014) found that positive perceptions of organizational support correlated with a stronger positive relationship between job satisfaction and higher OC. Similarly, positive collaboration with upper management might be enhanced by support and resources for personnel to provide high-quality care (C. S. Chang, 2014).
Not surprisingly, then, perceptions of staffing and resource adequacy are a significant predictor of AOC. As resource inadequacy leads to higher workload, Karsh et al. (2005) not only linked it with lower AOC, but held it responsible for 9% of variance in AOC in nursing homes. Greater autonomy, increased job control and social support correlate with lower reported work stress (Fisher, 2014; Schmidt & Diestel, 2011). Such findings indicate that to maintain AOC, it is necessary both to provide staffing and resources adequate for predictable workloads and, where workloads swell, to foster alternative forms of support to minimize the related stress.
However, in contrast with various studies supporting a positive relationship between AOC and autonomy (Rodwell et al., 2009; Steffen et al., 1996), the current study’s data indicate no significant relationship between the two. In the SHURP study’s sample, a third of the care personnel were nurse aids. The post hoc analysis of the differences in autonomy between different professional groups revealed that autonomy decreased significantly with lower levels of education. Nurses develop and adapt care plans, whereas nursing assistants implement those care plans under the nurses’ supervision. This variation between levels of professional autonomy might well have influenced our results.
Care Personnel Outcomes
AOC was a strong predictor for the intention to leave the job. This result is well-corroborated by studies in other healthcare settings (P. L. Chang, Chou, & Cheng, 2007; Cowden & Cummings, 2014), and in two studies in the nursing home setting (Ingersoll et al., 2002; Karsh et al., 2005). Considering nursing homes’ current difficulties recruiting and retaining care personnel, AOC is an important factor to consider. However, AOC is a slow-changing factor most effectively influenced by dealing with the predictors described above, for example, competent, supportive leadership, job satisfaction, upper management support, manageable workloads, teamwork, and probably tailored interventions to enhance autonomy.
AOC also showed a significant negative relationship with care personnel’s health complaints. Few studies have examined this relationship. Schalk (2011) revealed in a longitudinal study that AOC was related to reported health complaints at the same point in time, but he could not show a consistent causal relationship. Researchers have argued that because AOC can serve as a resource to alleviate the effects of stress, it protects them from the risk of health problems and reduced wellbeing (Felfe, Six, Schmook, & Knorz, 2010). As AOC enhancing factors also mitigate the effects of work stressors, improved health status may be related to a combination of AOC and its stress-reducing antecedents.
To our knowledge, this is the first study in aged care to examine AOC’s relationships with absenteeism and presenteeism. Our analyses revealed negative relationships with both variables. This supports Meyer and colleagues (2002) in their finding of a slight negative correlation between AOC and involuntary absenteeism. According to Felfe and colleagues (2010), absenteeism in care personnel is only partially explainable by their attitudes. The relationship between AOC and absenteeism is indirect and influenced via situational factors such as stressful working conditions, compulsory attendance and personal factors such as health or responsibility for children (Felfe et al., 2010). Absenteeism entails immediate and significant costs for the organization, and interventions to improve AOC might influence it.
In contrast, presenteeism occurs when an employee goes to work despite a medical illness that will prevent him or her from functioning fully. Increasing evidence suggests that the presence of ill or medically impaired care personnel results in significant costs via decreased productivity at the workplace (Brooks, Hagen, Sathyanarayanan, Schultz, & Edington, 2010; Schultz, Chen, & Edington, 2009). Employees of long-term care facilities typically demonstrate high rates of presenteeism (Aronsson, Gustafsson, & Dallner, 2000). Generally, work-related factors such as higher time pressure, job insecurity, and inadequate social support appear more reliable as its predictors than personal factors or attitudes (Hansen & Andersen, 2008). However, in a qualitative study in hospital nurses, Krane and colleagues (2014) showed that intrinsic motivation to work when sick had a stronger influence than social pressure. Since care personnel’s AOC values are negatively related to absenteeism, presenteeism, and stress, interventions to foster AOC may reduce not only illness-related issues, but stress-related illnesses as well.
Aggressive behavior by nursing home residents is endemic (Franz, Zeh, Schablon, Kuhnert, & Nienhaus, 2010; Zeller, Dassen, Kok, Needham, & Halfens, 2012). In the present study, more than a 5th of care personnel experienced verbal aggression several times a week, a 10th physical aggression, and a 40th sexual aggression. This is congruent with the findings of Zeller and colleagues (2012) in Swiss nursing homes, which revealed that 38.2% of care personnel had experienced verbally or physically aggressive behavior in the week prior to data collection. Care personnel characteristics serving as predictors for resident aggression include education level, staffing ratio, gender, age, confidence in managing aggression, and occupational strain (Gates, Fitzwater, & Succop, 2003; Zeller et al., 2012). One apparently effective intervention to reduce patient aggression is the reduction of the caregiver workload (Isaksson, Aström, Sandman, & Karlsson, 2009). Care personnel with fully manageable workloads can better concentrate on residents, which might lead to fewer aggressive episodes. Still, when aggression occurs, it requires coping strategies. Organizational or social support can help caregivers to deal with disagreeable situations. Both manageable workloads and social support are antecedents of AOC.
Strengths and Limitations
The chief strength of this study is that, for the first time, it comprehensively investigated AOC in a representative national sample, allowing generalization of its results to all Swiss nursing homes with more than 20 beds. Also for the first time, this allowed the researchers to address several questions, including, for example, the importance of AOC regarding absenteeism and presenteeism in the nursing home sector. The participants’ high response rate is another crucial strength.
One factor to consider when collecting data is to avoid systematic measuring errors, particularly common method variance (CMV; Podsakoff, MacKenzie, Lee, & Podsakoff, 2003). Correlations between items measured using the same method can be inflated, potentially biasing behavioral research (Podsakoff et al., 2003). Several approaches have been recommended to avoid or correct CMV (S.-J. Chang, van Witteloostuijn, & Eden, 2010). For this study, the use of diverse sources of information for key variables was not possible. However, certain procedural remedies could be applied while designing and administrating the questionnaire: to counteract the perceived pressure of the subjects to respond according to social desirability, for example, respondents’ confidentiality were guaranteed. Regarding our analyses, the arrangement of the items within the constructs was carried out in an order that did not allow deduction of the dependent and independent variables. Furthermore, all constructs were clearly separated with respect to the content; and separate Likert-type scales were used.
A further limitation is the use of single items for some constructs (autonomy, quality of care, underuse of skills, job satisfaction, and collaboration). Although single item measurements might not capture appropriately the whole construct, we choose to limit questionnaire length in order to reduce response burden for personnel and financial burden for the nursing homes which provided the time necessary to fill out the questionnaire. The use of single items has been shown to be a valid measurement for job satisfaction (Dolbier, Webster, McCalister, Mallon, & Steinhardt, 2005; Wanous, Reichers, & Hudy, 1997), and quality of care (McHugh & Stimpfel, 2012).
Another limitation was the cross-sectional study design, which does not provide conclusive evidence of causality. Also, in large samples, p-values commonly reach apparently significant levels without clinical relevance; however, the reported odds ratios provide an adequate basis to judge the results’ clinical significance.
Further Research
Future studies of AOC in nursing homes should integrate a broader range of variables. Many strong predictors of AOC in other settings, for example, interpersonal justice, innovation, or positive diversity climates have yet to be examined in nursing homes. To allow causal inferences, longitudinal designs are also needed. Finally, the effectiveness of leadership training on AOC should be investigated in an intervention study.
Conclusions
Care personnel are nursing homes’ most valuable resources. A better understanding of the factors that influence AOC is critically needed in today’s nursing shortage environment. This study shows that leadership is the most important antecedent of AOC. Certain antecedents described in this study, for example, collaboration, perceptions of staffing and resource adequacy, quality of care, and underuse of skill, have never before been investigated in nursing homes.
The study provides new support to previous research about the importance of nurses’ commitment and satisfaction for organizational effectiveness and performance. The lack of committed staff who are willing to exert considerable effort to apply a resident-centered philosophy, could be especially harmful for long-term care, because resident relationships with staff are central to the provision of good-quality care. To maintain stable and healthy nursing home staff, these findings stress the importance of fostering AOC. The findings have practical implications for all nursing home administrators and managers who strive to improve AOC and increase care personnel retention. Because leadership and job satisfaction are the strongest predictors of AOC, leadership development interventions and interventions aimed at increasing job satisfaction promise having the greatest value in increasing levels of AOC. Leadership can be learned by formal training and education, by observation of others, and by trial and error. Interventions to increase job satisfaction can bolster care personnel’s interpersonal skills, encourage group support, embolden participation in resident care planning and decision making, and elevate the overall quality of care.
Acknowledgment
We gratefully acknowledge René Schwendimann, PhD, RN, principal investigator of the SHURP study, for his scientific guidance, and the study participants for their time and effort.
References
Author notes
Decision Editor: Nicholas G. Castle, PhD

