


To evaluate the effectiveness of different brief intervention strategies at reducing hazardous or harmful drinking in the probation setting. Offender managers were randomized to three interventions, each of which built on the previous one: feedback on screening outcome and a client information leaflet control group, 5 min of structured brief advice and 20 min of brief lifestyle counselling.
A pragmatic multicentre factorial cluster randomized controlled trial. The primary outcome was self-reported hazardous or harmful drinking status measured by Alcohol Use Disorders Identification Test (AUDIT) at 6 months (negative status was a score of <8). Secondary outcomes were AUDIT status at 12 months, experience of alcohol-related problems, health utility, service utilization, readiness to change and reduction in conviction rates.
Follow-up rates were 68% at 6 months and 60% at 12 months. At both time points, there was no significant advantage of more intensive interventions compared with the control group in terms of AUDIT status. Those in the brief advice and brief lifestyle counselling intervention groups were statistically significantly less likely to reoffend (36 and 38%, respectively) than those in the client information leaflet group (50%) in the year following intervention.
Brief advice or brief lifestyle counselling provided no additional benefit in reducing hazardous or harmful drinking compared with feedback on screening outcome and a client information leaflet. The impact of more intensive brief intervention on reoffending warrants further research.
INTRODUCTION
There is evidence of an association between alcohol use and offending behaviour (Boden et al., 2012). Alcohol has been found to be a factor in half of all violent crimes (Flatley et al., 2010). In England and Wales, alcohol-related crime is estimated to cost society £11 billion (2010–2011 costs) (Alcohol Team Home Office, 2013). However, the precise relationship is complex (Plant et al., 2002), with an intricate interplay between drinking patterns, the amount of alcohol consumed and individual and contextual factors (Graham et al., 2012).
Hazardous drinking is a repeated pattern of drinking that increases the risk of future health problems, whereas harmful drinking is defined by the presence of these problems (Babor et al., 1994). In the UK, higher rates of alcohol misuse have been found at various stages in the criminal justice system compared with the 20–30% observed in primary care populations (Funk et al., 2005), with a majority of men and women reporting problematic alcohol use. This encompasses those arrested at police stations (59%) (Brown et al., 2010), within probation settings 59–63% (Newbury-Birch et al., 2009b; Orr et al., 2013) and those in prison 60–81% (McMurran and Cusens, 2005; Newbury-Birch et al., 2009b; MacAskill et al., 2011).
Alcohol screening and brief alcohol intervention is a secondary preventative approach (Kaner et al., 2009), which involves the identification via screening of hazardous and harmful drinking and the delivery of an intervention aimed at reducing consumption and concomitant problems. There is a wealth of evidence in primary care for the effectiveness of alcohol screening and brief intervention in adults who are not seeking treatment for alcohol-related problems (Moyer et al., 2002; Bertholet et al., 2005; Kaner et al., 2007), whereas the evidence in the other health-care settings such as Emergency Departments is conflicting (Drummond et al., 2014). However, there has been very little research carried out in criminal justice settings. A recent quasi-experimental study in eight police custody settings in England found reduced alcohol consumption in those who got a brief intervention; however, those in the intervention group were statistically more likely to be arrested at 6 months post intervention (McCracken et al., 2012). However, just 34% of participants were followed up at 12 months (McCracken et al., 2012), and these were compared with a retrospective control group. A Scottish pilot trial in a community-based criminal justice settings of alcohol brief advice compared with delivery of an information booklet could not make any conclusions for effectiveness because of low follow-up rates of 20% at 6 months (Orr et al., 2013). Nevertheless, brief alcohol intervention in a magistrate court setting resulted in lower levels of injury at 12 months compared with controls (Watt et al., 2008).
Thus, the criminal justice setting represents important opportunity for alcohol intervention work and that could impact upon consumption and offending behaviour. However, more evaluative studies with robust methodological designs are required if we are to provide offender services with clear evidence of impact. We carried out a pilot study in 2007 that evaluated the most feasible criminal justice setting in which to conduct a randomized control trial (RCT) of alcohol screening and brief interventions and found that the recruitment, consent and willingness to participate rates were highest in the probation setting (Coulton et al., 2012). We therefore carried out a pragmatic cluster RCT of the effectiveness of two different brief intervention strategies compared with a control condition of feedback on screening outcome and a client information leaflet at reducing hazardous or harmful drinking in the English probation setting.
METHODS
The full trial protocol for the present study has been published (Newbury-Birch et al., 2009a).
Study design
A prospective factorial pragmatic cluster RCT with randomization at the level of offender manager. Randomization was conducted by a secure remote randomization service using random permuted blocks and was stratified by geographical region. The research team was blind to the allocation schedule. Offender managers were randomly allocated initially to using one of two screening tools: Fast Alcohol Screening Test (FAST) (Hodgson et al., 2002) or Modified Single Alcohol Screening Question (M-SASQ) (Canagasaby and Vinson, 2005) and then to one of the three additive conditions: feedback on screening outcome plus the delivery of an information leaflet; 5 min of brief advice; 20 min of brief lifestyle counselling delivered on a subsequent occasion. The study received ethical approval from the Multicentre Research Ethics Committee (08/HO903/2) and was conducted in accordance with the Helsinki Declaration.
Sample size
Due to the paucity of comparable research in criminal justice settings, the sample size calculation was based on outcomes reported in health-care settings, particularly primary care. Moyer et al. (2002) suggest that a clinically important difference in negative status on Alcohol Use Disorders Identification Test (AUDIT) between brief intervention and control is of the order 13%: 5% in the control group and 18% in the brief intervention group. To detect a difference of this magnitude at the 5% significance level with 80% power, for a two-sided test, 109 offenders in each of the three groups are required (a total of 327 offenders) (Moyer et al., 2002).
Our experience with other studies of alcohol using populations (UKATT Research Team, 2005; Coulton et al., 2006) and hard-to-engage populations (Gilburt et al., 2012) would suggest that with assiduous follow-up regimes the loss to follow-up at 6 months should not exceed 25%, and so the sample required was inflated to 145 in each group. As the study is a cluster RCT, we adjusted the sample size for any potential design effect. We assumed that the intra-class correlation coefficient should be similar to primary care at 0.04. Assuming a cluster size of the order of five offenders per offender manager, this inflates the sample size calculation by a factor of 1.1, requiring 160 offenders in each group (a total of 480 offenders) with an expectation that at least 365 would be followed up at 6 months.
Participants
Offender managers are responsible for the high-quality assessment, robust management of contact and behaviour and provision of well-targeted interventions to offenders. They provide the link for other organizations to work in an integrated manner (www.parliament.uk, 2011). Their work is subject to national standards (www.parliament.uk, 2011). Offender managers were recruited between May 2008 and July 2009 across three geographical regions of England: the North East, South East and London. Offender managers were considered eligible if they delivered routine probation services and were not involved in any other alcohol screening and brief intervention programme.
Individual offenders were eligible if they screened positive using the allocated screening instrument, were 18 years of age or more, were resident within 20 miles of the offender manager's office and were able to understand English sufficiently to complete the study questionnaire. Offenders were excluded if they were already receiving treatment for alcohol use, were intoxicated at assessment, were severely mentally impaired or were of no fixed abode. Offenders were provided with a £10 gift voucher for completing questionnaires at each data collection point. After discussions with senior management in the probation departments, probation offices were offered £1000 to participate in the study and recruit the required number of offenders (5 per offender manager) or alternatively individual offender managers were offered a £20 gift voucher for each offender recruited.
Screening
Offenders were screened using one of the two short validated alcohol screening tools. The M-SASQ asked ‘How often do you have X or more standard drinks on one occasion?’ where X = 6 for women and 8 for men, with monthly, weekly, daily or almost daily considered a positive screen (Canagasaby and Vinson, 2005). FAST is a four-question tool that scores between 0 and 16 with a score of 3 or more being considered a positive screen (Hodgson et al., 2002). The results relating to the different screening tools will be reported elsewhere.
Interventions
Client information leaflet (control group)
Offenders received simple feedback on their screening outcome and an alcohol information leaflet from the offender manager developed by the Department of Health in England (www.sips.iop.kcl.ac.uk/pil.php). This 16-page leaflet describes the effects of alcohol on health and well-being and shows the number of units contained in popular alcoholic drinks to help the reader understand how much they were drinking. Contact details of local alcohol treatment agencies, Drinkline and websites were also provided.
Brief advice
Offender managers provided offenders with feedback on screening outcome and the client information leaflet plus 5 min of structured personalized brief advice based on the ‘How much is too much?’ simple structured advice tool developed as part of the UK version of the Drink-Less brief intervention programme (McAvoy et al., 1997). In addition to providing specific details about the health and social consequences of hazardous and harmful drinking, offenders were shown a gender-specific graph which indicated that their drinking exceeded that of most of the population, and a list of benefits that would result from reduced drinking. Offenders were then taken through a menu of techniques to help reduce drinking and asked to consider a personal target for an achievable reduction.
Brief lifestyle counselling
Offender managers gave offenders feedback on screening outcome, the client information and structured brief advice in the initial meeting. Offenders were then asked to return for an appointment with an alcohol health worker for a 20-min session of brief lifestyle counselling. This was based on the ‘How much is too much?’ extended brief intervention tool developed as part of the UK version of the Drink-Less brief intervention programme (McAvoy et al., 1997), which was modified in line with motivational interviewing principles outlined in the health behaviour change manual (Rollnick et al., 1999). During the intervention, offenders described their typical drinking day and rated the importance of changing their drinking and their confidence about changing their drinking on a 10-point scale (where a higher number indicated greater importance or confidence and vice versa). The alcohol health worker then worked with these ratings to establish why they were at the current level and how they might be increased to a higher point, before eliciting both pros and cons of drinking and finally working through a six-step plan to help reduce drinking levels.
All interventions were coded for the presence of Behaviour Change Techniques (BCTs) by one of the authors (K.P.) who is a trained coder in the use of BCT taxonomy V1 (Michie et al., 2011, 2013) (see www.sips.iop.kcl.ac.uk for further details of the screening tools, intervention materials and coding for BCTs used in this study).
Training and support
Offender managers were trained only to use the screening tool and intervention in the condition they had been allocated. All offender managers were trained by a member of the research team to implement alcohol screening and deliver the client information leaflet in accordance with the trial protocol. Offender managers allocated to brief advice received an additional 60-min training session delivered by an experienced alcohol health worker. The standardized training involved an interactive presentation with role play and feedback to develop skills and confidence in delivering the intervention. Ongoing weekly support through visits and telephone calls occurred during the trial.
Alcohol health workers delivering brief lifestyle counselling received formal training that consisted of four main elements: orientation to working in probation settings; workshops with interactive presentations and role play; recorded simulated consultations with trained actors; continuous clinical supervision. As the alcohol health workers were required to demonstrate adherence to the brief lifestyle counselling protocol and reach a required standard of competence prior to intervention delivery, simulated consultations were recorded and assessed by clinical supervisors using the Behaviour Change Counselling Index (Lane, 2002). They did not deliver interventions until they reached the correct standard. All alcohol health workers received ongoing weekly clinical supervision and support throughout the study.
Study measures
The primary outcome measure was hazardous or harmful drinking status at 6 months as measured by the AUDIT questionnaire (Saunders et al., 1993). A score of ≥8 on this test indicates hazardous or harmful drinking or possible dependent drinking, with a sensitivity of 92% and specificity of 94% (Saunders et al., 1993). The primary outcome was negative status (≥8) at 6 months, which indicated a shift to lower risk drinking. Offenders also completed the Euroqol EQ-5D, which is a measure of health-related quality of life. EQ-5D has a ceiling of 1.0, which represents full quality of life, and the higher the score (max 1.0) the greater the quality of the individual's life (The EuroQol Group, 1990). Other tools completed were a short service use questionnaire to capture visits to NHS and other services and a modified Readiness Ruler that measured readiness to change drinking behaviour (Heather et al., 2008).
Follow-up
At 6 and 12 months after the intervention, researchers who were blinded to the allocated condition contacted the offenders by telephone or post. Researchers administered the same instruments as at baseline plus the Alcohol Problems Questionnaire (Drummond, 1990). A short patient satisfaction questionnaire (Marshall and Hays, 1994) was also administered at 12 months. Police National Computer (PNC) conviction data were used as a measure of recidivism (whether offenders had been convicted of any offence) between recruitment and 12 months later.
Analysis
The primary analysis was by intention to treat, whereby offenders were analysed as members of their allocated group irrespective of intervention received. The primary outcome measure was analysed using logistic regression adjusting for known covariates: baseline AUDIT score, age and gender. In a factorial study, we tested for any interaction between screening tool and allocated intervention and, if the interaction was found to be significant, it was included in the model. To address the clustered design of the study, we employed the Huber–White sandwich estimation approach to derive robust standard errors. The impact of missing data was assessed using multiple imputation and sensitivity analysis undertaken to assess the potential influence of missing data. As no influence of missing data was observed, the results presented are those without imputation. Odds ratios and associated 95% confidence intervals were generated.
A secondary, per protocol analysis that included just those who received their allocated treatment was undertaken on the primary and dichotomous outcome measures. For continuous outcomes, we assessed distributional assumptions and where necessary undertook statistical transformations to conduct a linear regression adjusting for known covariates. Readiness to change analysis employed a similar method but used an ordinal regression modelling approach. All analysis was conducted using STATA v10.
RESULTS
Recruitment and follow-up
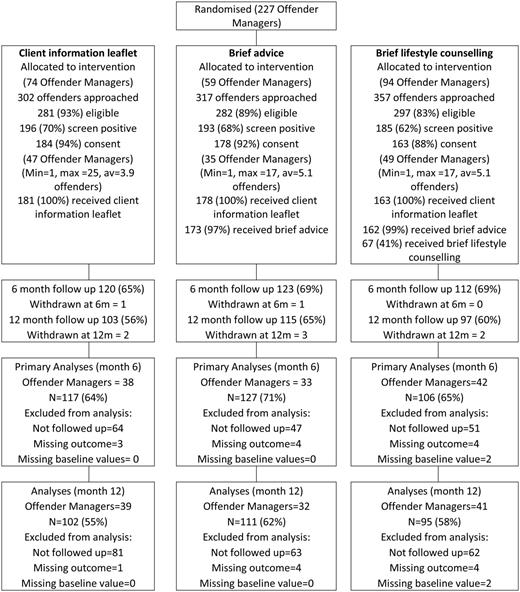
Consort statement indicating actual recruitment and intervention by screening approach and intervention.
Sample characteristics
The mean age of offenders was 31.0 years (SD 10.9) and was similar across groups. The majority were male (85%), white (76%) and single (67%). Less than half continued their education after 16 years of age (45%). Sixteen per cent possessed a degree or equivalent professional qualification. Almost 80% were current smokers. Mean AUDIT score at baseline was 16.07 (SD 8.57), and the mean baseline EQ-5D score was 0.85 (SD 0.22). AUDIT scores at baseline suggested that 43% of offenders consumed alcohol at harmful or possibly dependent levels (Table 1).
Sample characteristics and AUDIT scores/categories at baseline
| Client information leaflet (N = 184) | Brief advice (N = 178) | Brief lifestyle counselling (N = 163) | Total (N = 525) | |||||||
|---|---|---|---|---|---|---|---|---|---|---|
| n | Mean (SD) | n | Mean (SD) | n | Mean (SD) | n | Mean (SD) | Intraclass correlation coefficient (SE) | ||
| Age in years | 184 | 31.6 (10.9) | 177 | 30.8 (10.8) | 163 | 30.5 (11.1) | 524 | 31.0 (10.9) | ||
| EQ-5D | 178 | 0.84 (0.24) | 171 | 0.82 (0.22) | 157 | 0.88 (0.21) | 506 | 0.85 (0.23) | ||
| Baseline AUDIT score | 181 | 15.40 (8.33) | 178 | 16.29 (8.80) | 161 | 16.58 (8.58) | 520 | 16.07 (8.57) | 0.165 (0.048) | |
| N | % | N | % | N | % | N | % | |||
| Baseline AUDIT status | Negative | 32 | 17.7 | 22 | 12.4 | 16 | 9.9 | 70 | 13.5 | 0.074 (0.041) |
| Positive | 149 | 82.3 | 156 | 87.6 | 145 | 90.1 | 450 | 86.5 | ||
| AUDIT score category | Lower risk (0–7) | 32 | 17.7 | 22 | 12.4 | 16 | 9.9 | 70 | 13.5 | 0.143 (0.047) |
| Increasing risk (8–15) | 75 | 41.4 | 80 | 44.9 | 72 | 44.7 | 227 | 43.7 | ||
| Harmful/Possible dependence (16–40) | 74 | 40.9 | 76 | 42.7 | 73 | 45.3 | 223 | 42.9 | ||
| Gender | Male | 160/184 | 87.0 | 145/178 | 81.5 | 142/163 | 87.1 | 447/525 | 85.1 | |
| Ethnicity | White | 140/184 | 76.1 | 138/178 | 77.5 | 122/163 | 74.8 | 400/525 | 76.2 | |
| Marital status | Single | 125/184 | 67.9 | 125/178 | 70.2 | 103/163 | 63.2 | 353/525 | 67.2 | |
| Education after 16 years | Yes | 84/182 | 46.2 | 77/178 | 43.3 | 74/163 | 45.4 | 235/523 | 44.9 | |
| Possess degree or equivalent | Yes | 25/184 | 13.6 | 26/178 | 14.6 | 30/161 | 18.6 | 81/523 | 15.5 | |
| Smoke tobacco | Current smoker | 150/184 | 81.5 | 139/177 | 78.5 | 126/162 | 77.8 | 415/523 | 79.3 | |
| Readiness Ruler | Never think about drinking less | 39 | 21.3 | 35 | 19.7 | 43 | 26.5 | 117 | 22.4 | |
| Sometimes think about drinking less | 37 | 20.2 | 37 | 20.8 | 34 | 21.0 | 108 | 20.7 | ||
| Decided to drink less | 39 | 21.3 | 33 | 18.5 | 18 | 11.1 | 90 | 17.2 | ||
| Already trying to cut down | 68 | 37.2 | 73 | 41.0 | 67 | 41.4 | 208 | 39.8 | ||
Primary outcome
AUDIT negative status increased in all three groups between baseline and 6 months from 17.7 to 29.1% in the client information leaflet group, 12.4 to 23.6% in the brief advice and 9.9 to 19.8% in the brief lifestyle counselling group. There were no significant differences between those in the brief advice and client information leaflet groups (OR = 0.80; 95% CI = 0.39–1.62) or brief lifestyle counselling compared with client information leaflet groups (OR = 0.73; 95% CI = 0.34–1.53) (Table 2). A per protocol analysis also showed no significant differences in this outcome between the groups.
AUDIT scores and categories by condition at 6 and 12 months
| Client information leaflet | Brief advice | Brief lifestyle counselling | Brief advice/Client information leaflet | Brief lifestyle counselling/Client information leaflet | ||||
|---|---|---|---|---|---|---|---|---|
| N (%) | N (%) | N (%) | OR (95% CI) | P-value | OR (95% CI) | P-value | Intraclass correlation coefficient (SE) | |
| AUDIT negative—Month 6 | 34/117 (29.1) | 30/127 (23.6) | 21/106 (19.8) | 0.80 (0.39–1.62) | 0.54 | 0.73 (0.34–1.53) | 0.40 | 0.015 (0.053) |
| AUDIT negative—Month 12 | 34/102 (33.3) | 37/111 (33.3) | 25/95 (26.3) | 1.11 (0.53–2.33) | 0.79 | 0.70 (0.34–1.47) | 0.35 | 0.031 (0.062) |
| Mean (SE) | Mean (SE) | Mean (SE) | Mean difference (95% CI) | P-value | Mean difference (95% CI) | P-value | ||
| AUDIT score—Month 6 | 13.96 (0.78) | 14.27 (0.54) | 14.22 (0.77) | 0.306 (−1.60 to −2.21) | 0.75 | 0.25 (−1.91 to −2.42) | 0.82 | 0.001 (0.052) |
| AUDIT score—Month 12 | 12.18 (0.84) | 13.10 (0.65) | 12.81 (0.80) | 0.91 (−1.16 to −2.99) | 0.38 | 0.63 (−1.62 to −2.88) | 0.58 | 0.042 (0.062) |
Secondary outcomes
An analysis of AUDIT negative status at 12 months indicated no significant differences between the three groups. The odds ratio of being AUDIT negative for brief lifestyle counselling compared with client information leaflet was 0.70 (95% CI = 0.34–1.47) and for brief advice compared with client information leaflet was 1.11 (95% CI = 0.53–2.33) (Table 2).
The mean AUDIT score at 6 months was 13.96 (SE 0.78) for client information leaflet, 14.27 (SE 0.54) for brief advice and 14.22 (SE 0.77) for brief lifestyle counselling. The mean difference for brief advice compared with the client information leaflet was not significant (0.306; 95% CI = −1.60 to 2.21) as was the mean difference for brief lifestyle counselling compared with client information leaflet (0.25; 95% CI = −1.91 to 2.42). A similar pattern was observed for the AUDIT score at 12 months (Table 2).
No significant differences were observed at either 6 or 12 months for quality of life, alcohol-related problems, readiness to change or satisfaction with care (at 12 months) (Tables 3–6).
Mean APQ (alcohol-related problems) score by treatment group
| APQ score | ||||
|---|---|---|---|---|
| Treatment group | n | Mean (SD) | Mean difference (95% CI) treatment group—client information leaflet | P-value |
| Month 6 | ||||
| Client information leaflet | 120 | 4.47(4.52) | — | |
| Brief advice | 131 | 5.34 (5.06) | 0.87 (−0.51, 2.24) | 0.21 |
| Brief lifestyle counselling | 109 | 4.76 (5.03) | 0.29 (−1.23, 1.80) | 0.71 |
| Overall test | 0.41 | |||
| Month 12 | ||||
| Client information leaflet | 103 | 4.38 (4.80) | — | |
| Brief advice | 115 | 4.91 (5.03) | 0.53 (−0.94, 2.00) | 0.48 |
| Brief lifestyle counselling | 99 | 4.48 (5.18) | 0.10 (−1.57, 1.78) | 0.90 |
| Overall test | 0.72 | |||
Results for readiness to change by condition over time
| Never think about drinking less | Sometimes think about drinking less | I have decided to drink less | Already trying to cut down | Ordered odds (95% CI) compared with client information leaflet | P-value | |
|---|---|---|---|---|---|---|
| 6 months | ||||||
| Client information leaflet (n = 206) | 28 (24.1%) | 17 (14.7%) | 26 (22.4%) | 45 (38.8%) | – | – |
| Brief advice (n = 129) | 17 (13.2%) | 27 (20.9%) | 27 (20.9%) | 58 (45%) | 1.37 (0.89–2.11) | 0.15 |
| Brief lifestyle counselling (n = 106) | 19 (17.9%) | 17 (16%) | 21 (19.8%) | 49 (46.2%) | 1.38 (0.90–2.13) | 0.15 |
| 12 months | ||||||
| Client information leaflet (n = 101) | 22 (21.8%) | 16 (15.8%) | 20 (19.8%) | 43 (42.6%) | – | – |
| Brief advice (n = 112) | 15 (13.4%) | 30 (26.8%) | 16 (14.3%) | 51 (45.5%) | 1.09 (0.64–1.87) | 0.74 |
| Brief lifestyle counselling (n = 307) | 20 (21.3%) | 16 (17%) | 17 (18.1%) | 41 (43.6%) | 0.97 (0.53–1.78) | 0.92 |
EQ-5D (quality of life) scores at baseline, 6 months and 12 months
| EQ-5D baseline | EQ-5D Month 6 | EQ-5D Month 12 | ||||
|---|---|---|---|---|---|---|
| n | Mean (SD) | n | Mean (SD) | n | Mean (SD) | |
| Client information leaflet | 178 | 0.84 (0.24) | 116 | 0.87 (0.21) | 101 | 0.88 (0.20) |
| Brief advice | 171 | 0.82 (0.22) | 127 | 0.82 (0.25) | 112 | 0.84 (0.23) |
| Brief lifestyle counselling | 157 | 0.88 (021) | 105 | 0.87 (0.21) | 97 | 0.86 (0.22) |
| P-valuea | 0.23 | 0.19 | ||||
| Brief advice—Client information leaflet Estimate (CI; P) | −0.040 (−0.089, 0.010; P = 0.12) | −0.035 (−0.086, 0.016; P = 0.18) | ||||
| Brief lifestyle counselling—Client information leaflet Estimate (CI; P) | −0.032 (−0.075, 0.012; P = 0.16) | −0.044 (−0.098, 0.010; P = 0.11) | ||||
aAdjusted for baseline EQ-5D score and using the Huber–White estimator to allow for clustering.
Patient satisfaction at 12 months
| Score | Mean difference (95% CI), P-value | ||||||||
|---|---|---|---|---|---|---|---|---|---|
| Client information leaflet | Brief advice | Brief lifestyle counselling | Brief advice/Client information leaflet | Brief lifestyle counselling/Client information leaflet | |||||
| n | Mean (SD) | n | Mean (SD) | n | Mean (SD) | Overall P-value | |||
| General satisfaction | 95 | 3.9 (0.63) | 105 | 3.7 (0.65) | 91 | 3.8 (0.80) | −0.19 (−0.38, 0.01) 0.07 | −0.06 (−0.28, 0.15) 0.55 | 0.17 |
| General communication | 96 | 4.0 (0.57) | 108 | 3.9 (0.60) | 90 | 3.9 (0.80) | −0.12 (−0.26, 0.03) 0.11 | −0.09 (−0.28, 0.93) 0.32 | 0.25 |
| Interpersonal manner | 96 | 4.0 (0.61) | 107 | 3.9 (0.62) | 91 | 3.9 (0.65) | −0.11 (−0.28, 0.05) 0.18 | −0.08 (−0.26, 0.09) 0.35 | 0.40 |
Recidivism data were obtained from 511 offenders (97% in both the client information leaflet and brief advice group and 98% in the brief lifestyle counselling group). Of the whole sample, 42% of offenders were convicted of an offence in the year following intervention. Differences were observed in the proportions in each group convicted (client information leaflet: 50%; brief advice: 36%; brief lifestyles counselling: 38%). The odds ratio of receiving a conviction was significantly lower in the brief advice (OR = 0.50; 95% CI = 0.33–0.80) and brief lifestyle counselling (OR = 0.54; 95% CI = 0.33–0.89) groups compared with the client information leaflet group (Table 7).
Recidivism rates by category 12 months post screening
| Client information leaflet, n (%), N = 177 | Brief advice, n (%), N = 172 | Brief lifestyle counselling, n (%), N = 158 | Brief advice/Client information leaflet | Brief lifestyle counselling/Client information leaflet | |||
|---|---|---|---|---|---|---|---|
| OR (95% CI) | P-value | OR (95% CI) | P-value | ||||
| Reoffend | 88 (49.7%) | 62 (36.0%) | 60 (38.0%) | 0.50 (0.33–0.80) | 0.005 | 0.54 (0.33–0.89) | 0.016 |
Analysis adjusted for baseline AUDIT score, number of cautions in the previous year, ever been in custody, age, gender and screening method.
DISCUSSION
This is the first large-scale pragmatic RCT to evaluate alcohol screening and brief intervention in the probation setting. The results highlighted 67% of offenders screened positive on the M-SASQ or the FAST, which were slightly higher than those found in the probation setting in the UK previously using the AUDIT (59–63%) (Newbury-Birch et al., 2009b; Orr et al., 2013), but lower than in our pilot study (73%) (Coulton et al., 2012). These figures may be an underestimate, as those already seeking help for alcohol problems were not eligible for the study. The prevalence of harmful or probably dependent drinkers (43%) was much higher in this population compared with 4% reported in the general population in England (Drummond et al., 2004).
This study and the results of our pilot study (Coulton et al., 2012) suggest that opportunistic screening and interventions are acceptable in this population, with a high proportion of offenders willing and able to participate. It is clear in this study, as with other studies in health settings (Crawford et al., 2004; Kaner et al., 2013), that a minority of offenders attend follow-up counselling. This was a pragmatic study; and this level of return for a subsequent session was outwith usual activity in probation and the return visit was entirely voluntary.
An increase in the proportion of AUDIT negative status at follow-up occurred in all three groups, but the difference between the groups was not statistically significant either in intention to treat or per protocol analysis on any of the outcome measures. Thus, we would not recommend the implementation of more complex brief interventions in this setting. Nevertheless, the large proportion of offenders who were drinking at the higher end of the AUDIT spectrum suggests a need for the development and evaluation of interventions that address the more severe cases in criminal justice settings, and this issue warrants further research.
We used PNC data to measure recidivism at 12 months post intervention (compared with 12 months pre-intervention) as other studies have done (Watt et al., 2008). The convention for reconviction studies is often 2 years (Friendship et al., 2002); however, it has been argued that the length of the follow-up period is entirely arbitrary (Maltz, 1984). It is important however, as we did, to give enough time for the PNC data to be updated (usually 3 months) before requesting the download to ensure that the data relate to a whole year. We found a significant difference in recidivism rates between the groups, with those randomized to brief advice and brief lifestyle counselling significantly less likely to be convicted in the 12 months after intervention than those randomized to the client information leaflet group. This finding is different to previous work in police settings where an increase in recidivism was found in those that received an alcohol intervention (McCracken et al., 2012). This discrepancy between the two studies could be as a result of them being focused at different points in the criminal justice system. However, the reduction in recidivism in the more intensive intervention groups in the current study was found in the absence of significant differences in drinking status between the groups. This unexpected finding requires further investigation to establish whether it is a real effect (valid finding) and, if so, to explore possible explanations and/or mechanisms. Both the brief advice and brief lifestyle counselling interventions encouraged reduced consumption but also promoted awareness of risks relating to excessive alcohol use, including the risk of offending whilst under the influence of alcohol. It could be that this increased awareness resulted in a significant change in offending behaviour rather than consumption per se or it may be that offending is linked to particular patterns of drinking (risky single occasion high intensity drinking) rather than overall consumption (such as average levels of drinking per week). More research is needed to ascertain the precise relationships between drinking level, drinking pattern, drinking context and offending behaviour.
As in other studies (Watt et al., 2008; McCracken et al., 2012), we included all crime rather than alcohol-related crimes such as violent offences. Watt et al.'s (2008) study of alcohol screening and brief intervention in the magistrates' court for alcohol-related offences found no differences between numbers of convictions for violent offences (52%) or non-violent offences (58%) amongst offenders at the 12-month follow-up. This may be because the measurement of whether an offence is alcohol related is a subjective measure made by the police and Crown Prosecution Service, and people may be convicted of offences other than those that they were originally arrested for.
Only 58% of randomized offender managers recruited at least one offender to the study, whereas 76% of those trained for the study recruited at least one offender. Although most staff were supportive of the study and saw working with offenders with alcohol issues as a legitimate part of their job, some staff were less interested. This lack of interest may have been caused by a number of contributing factors such as a perceived lack of importance of alcohol misuse in their workload, information overload, workload pressures and particularly maybe feeling aggrieved that they were told by their team leaders they were taking part in the study, which has been found in similar studies in the criminal justice system (Brown et al., 2010). We operated an informal drop in/telephone support system once a week for anyone who was in the office at that time to see how they were getting on. In future work, more formal support mechanisms from both the research team and the line managers should be put in place. It was also the case that some offender managers were incentivized for participating in the study, and this raises the important issue of how interventions in criminal justice populations aimed at addressing health-related behaviours can be integrated into normal working practice.
This study involved opportunistic screening in a population not seeking alcohol treatment and so who may not be aware of their level of alcohol-related risk or harm. In light of the large field of evidence supporting the effectiveness of brief alcohol intervention (Kaner et al., 2007), we did not feel it was ethically appropriate to use a no-input control group (i.e. withhold information about the screening outcome). Thus, we felt that the minimally acceptable control condition should be simple feedback following screening plus an alcohol information leaflet. There is a possibility that reductions observed across all three groups were due to regression to the mean or research participation (Hawthorn) effects, and this explanation cannot be totally discounted in our study although the reduction in the proportion of AUDIT positives in the control arm of this study was similar to the effect sizes reported in the brief intervention arms of other trials and greater than those reported for no-treatment control conditions (Moyer et al., 2002). However, it is also possible that the lack of differences between the groups was as a result of our control group including active ingredients of behaviour change such as screening, assessment, feedback and awareness raising via the written information and details of local treatment services.
Finally, it is possible that the lack of differences between interventions could have been due to the brief intervention protocols not being implemented correctly, despite the on-going support and clinical supervision during the trial, and analysis on this is currently underway. However, as a pragmatic study of effectiveness it aimed to reflect what would happen in real practice where intensive monitoring and supervision would be impractical.
The strengths of the study are as follows: this is the first large multicentre trial of screening and brief intervention in the criminal justice system; it was a pragmatic RCT in the typical probation setting; cluster randomization avoided the problems of contamination between interventions being delivered; the study used remote randomization and validated outcome measures of clinical relevance; rates of eligibility and consent were higher than in previous similar studies which add weight to the generalizability of the research. Although the follow-up rate at 6 months was 68% instead of the expected 76%, the higher than anticipated recruitment meant the numbers followed up at the primary end point were sufficient to detect the hypothesized differences stated in the power calculation. Furthermore, these were still substantially higher than the 20% follow-up rate at 6 months found in a recent study in the probation setting (Orr et al., 2013).
In conclusion, this article adds to the small but growing evidence base relevant to brief interventions in the criminal justice system. However, the paucity of clear evidence on the effectiveness of alcohol screening and brief interventions in criminal justice system settings would suggest that the evidence for their implementation in this setting is currently not clear, and more research is needed around the interplay between brief interventions and AUDIT status and between brief interventions and recidivism.
Funding
This study was funded by the UK Department of Health. The views expressed herein do not necessarily reflect those of the Department of Health, the National Health Service, the National Offender Management Service or the Home Office.
Conflict of interest statement
None declared.
Acknowledgements
We wish to thank all probation staff and offenders who have taken part in the trial.
