


Abstract
Objective The objective of the meta-analysis is to integrate available results on associations of general parenting (not specific to feeding and activity promotion) and parent–child relations with child weight status, eating, and physical activity. Methods Searching in electronic databases and cross-referencing identified 156 empirical studies. Random-effects meta-analysis was computed. Results A positive parent–child relationship and higher levels of parental responsiveness were associated with lower weight, healthier eating, and more physical activity of the child. Parental demandingness, overprotection, psychological control, inconsistency, and parenting styles showed associations with some of the assessed outcome variables. Most effect sizes were small and varied by study characteristics. Conclusions The small effects do not support making general parenting styles, parental demandingness, responsiveness, and the quality of the parent–child relationship a main target of preventing and treating obesity. Reducing parental inconsistency may be a better target if available results are replicated in future studies.
Introduction
In children and adolescents aged 2 through 19 years, overweight is defined as at or above the sex-specific 85th percentile on Body Mass Index (BMI)-for-age growth charts but less than the 95th percentile; obesity is defined as a BMI at or above the sex-specific 95th percentile (Ogden, Carroll, Kit, & Flegal, 2012). In 2009–2010, 16.9% of the U.S. children and adolescents from 2 through 19 years of age were obese (Ogden et al., 2012). Obesity often causes serious health consequences, such as hypertension, diabetes, fatty liver disease, and psychosocial complications (Daniels, 2009). Childhood obesity is also a significant risk factor for obesity in adulthood (Venn et al., 2007).
While research originally assessed associations of feeding-related and activity-related parenting with pediatric obesity (Davison & Birch, 2001), there is an increasing awareness that general parenting practices, parenting styles, and the parent–child relationship may also affect overweight and obesity. The concept of “parenting style” refers to the emotional climate within which parenting practices are applied (Darling & Steinberg, 1993). Related research has identified three core dimensions of parenting, namely (a) parental responsiveness (e.g., acceptance, emotional support, nurturance, warmth); (b) parental demandingness (monitoring, rules/structure, and disciplinary efforts) (Baumrind, 1967, Maccoby & Martin, 1983); and (c) the promotion of autonomy (vs. overprotection) of older children and adolescents (Steinberg, 2010). The combination of responsiveness and demandingness led to the typology of parenting styles (Maccoby & Martin, 1983): Authoritative parents balance high levels of demandingness with high levels of responsiveness. Authoritarian parents express high levels of demandingness and low levels of responsiveness. Permissive parents exhibit low levels of demandingness and high levels of responsiveness. Finally, neglectful parents exhibit low levels of both demandingness and responsiveness. Whereas parental demandingness measures behavioral control (parenting behaviors such as limit setting and monitoring), parental psychological control refers to intrusiveness and criticism/guilt induction (Barber, 1996).
Parenting styles and practices can be distinguished from the quality of the parent–child relationship. Across theories of parent–child relationships, the emotional bond formed between the parent and child (connectedness, closeness, or attachment security) is considered the most important characteristic (Clark & Ladd, 2000; Lamb & Lewis, 2011). The quality of the parent–child relationship shows positive, albeit small, correlations with parental responsiveness (DeWolff & van IJzendoorn, 1997).
Several pathways may link pediatric obesity with parenting behaviors, styles and the parent–child relationship. Regarding responsiveness, parents displaying more warmth and consideration of the child’s developmental abilities may foster a greater capacity in the child for regulating his or her eating behavior (Rhee, Lumeng, Appugliese, Kaciroti, & Bradley, 2006). In addition, parental responsiveness protects the child from low self-esteem and depression (DeLay, Hafen, Cunha, Weber, & Laursen, 2013), which may promote physical activity and healthy body weight. Such a protective effect could also be expected when considering positive parent–child relations (Lamb & Lewis, 2011).
Regarding parental demandingness, Rhee et al. (2006) suggested that parents with high expectations for self-control may have more defined boundaries regarding what and when their children eat, which could prevent obesity. In some cases, high parental control might also be a reaction to children’s unhealthy eating behavior or activity patterns and the associated overweight or obesity (Schuetzmann, Richter-Appelt, Schulte-Markwort, & Schimmelmann, 2008).
It has been suggested that authoritative parenting provides the structure and support needed for children to internalize and maintain positive behaviors (Baumrind, 1967). In contrast, permissive or neglectful parenting may not provide children with the guidance they need for the development of self-regulation in both the eating and activity domains (Lengua, Honorado, & Busch, 2007). Rhee (2008) suggested that general parenting style may have a greater impact on child weight compared with specific parenting practices alone because parenting style represents the context under which specific practices such as feeding behaviors are presented, thereby influencing how these practices are experienced by children.
Empirical research relating parenting styles and behaviors to child weight status, eating behavior, and physical activity levels is limited, and results from available studies tend to be inconsistent. A recent narrative review found some evidence that children raised in authoritative homes may eat more healthily, be more physically active, and have lower BMI levels compared with children who were raised with other parenting styles (Sleddens, Garads, Thijs, DeVries, & Kremers, 2011). However, the authors noticed discrepancies across studies, and less than half of the 25 studies reviewed found the expected associations of parenting with child weight. Ventura and Birch (2008) reported that two of the four studies reviewed found an association of general parenting with child weight status. In contrast, Berge (2009) reported that all of the six studies reviewed found that authoritative parenting style was associated with child BMI, availability of fruit and vegetables in the home, child consumption of fruit, vegetables, and dairy products, lower consumption of sugar sweetened beverages, and higher levels of physical activity. However, this review overlooked some relevant studies with nonsignificant results. Furthermore, Trost and Loprinzi (2011) reviewed the literature on parental influences on children’s and adolescents’ activity behavior, but the results on associations of general parenting style and child activity were inconclusive. Only one narrative review on five studies addressed the association between parent–child relationship and child obesity, with three studies finding that a negative parent–child relationship was associated with higher weight (Skouteris et al., 2012).
In sum, most narrative reviews included small numbers of studies and found considerable inconsistency between results of the individual studies. In addition, these narrative reviews could neither estimate the average size of associations of parenting with obesity nor test whether the size of this association is statistically significant and whether the size of the association varies by study characteristics. In the case of heterogeneous findings, meta-analysis is a good tool for integrating the study results (Lipsey & Wilson, 2001). First, some studies may not have found an association owing to limited test power associated with small sample sizes. Meta-analysis provides more robust results because it pools the effects across available studies. Second, meta-analysis provides an explicit statistical test of whether the average association is statistically significant and homogeneous. Third, in the case of heterogeneity of effects across studies, meta-analysis searches for study characteristics that may modify the size of effects. Identifying moderator effects of study characteristics is important for identifying conditions under which parenting may have the strongest effect on child weight, food consumption, and physical activity. The present study provides the first meta-analysis on the association between general parenting and parent–child relationship with child weight status, food consumption, and physical activity.
Hypotheses
Hypothesis 1 states that high levels of parental responsiveness and demandingness, authoritative parenting, and a positive parent–child relationship will be associated with lower risk for overweight/obesity, better dietary habits, and higher physical activity. The reverse is expected for overprotection, psychological control, inconsistent parenting, as well as authoritarian, permissive, and neglectful parenting.
In the next part of the study, we ask which study characteristics moderate the size of the associations of parenting and the parent–child relationship with child weight. The present study did not search for variables moderating associations with healthy eating and physical activity because test power was restricted due to lower numbers of available studies.
Moderating Effects of Study Characteristics
Based on theoretical considerations and available narrative reviews, the following moderator variables were considered.
Weight Measure
Following Sleddens et al. (2011), Hypothesis 2.1 states that associations of parenting and parent–child relationship with child weight are stronger when BMI was used as an outcome variable rather than obesity or overweight.
Time of Assessment
Concurrent association between parenting and pediatric obesity may indicate that parenting affects weight and/or vice versa. Thus, Hypothesis 2.2 states that associations of parenting/parent–child relationship with child weight are stronger in cross-sectional studies than in studies that assessed parenting or the quality of the parent–child relationship at an earlier point of measurement than child weight. Almost no longitudinal studies were available on the effects of initial child weight status on parenting at follow-up.
Child Age
Children shift their reference groups from parents to peers as they become adolescents (Steinberg, 2010). Thus, Hypothesis 2.3 states that stronger associations of parenting and parent–child relationship with weight status are found in children than in adolescents.
Parent Gender
Mothers tend to be the main caregiver for their child in most families (Lamb & Lewis, 2011). Thus, Hypothesis 2.4 states that stronger associations with child weight are found when focusing on mothers rather than fathers.
Ethnic Minority
In Western countries, families from ethnic minorities are more likely than other families to endorse collectivist values, such as obedience of the child (Huisberts, Oosterwegel, VanderValk, Vollebergh, & Meeus, 2006). Hypothesis 2.5 asks whether stronger associations of parenting/parent–child relation with child weight are found if studies include more families from ethnic minorities.
Rater
Some studies have found that child perception of parenting tends to show stronger associations with child eating behavior (Haines, Neumark-Sztainer, Hannan, & Robinson-O’Brien, 2008) and physical activity (Barr-Anderson, Robinson-O’Brien, Haines, Hannan, & Neumark-Sztainer, 2010) than parental perceptions. Thus, Hypothesis 2.6 states that stronger associations of parenting/parent–child relation with child weight are found if child reports rather than parent reports are used.
Study Quality
Most assessments of study quality have been developed in intervention research (Conn & Rantz, 2005). As some of their criteria could not be applied in the present study (e.g., randomization), we chose four criteria that would be relevant: (a) Studies with random samples rather than convenience samples provide representative results. (b) Results are less likely to be biased if studies test whether obese and nonobese participants differ by sociodemographic characteristics and statistically control for these differences, if necessary. (c) Studies of high quality should also use measures that are valid and reliable. (d) Studies published in peer-reviewed journals may provide more reliable results because peer-reviews could eliminate studies with serious methodological flaws. As sum scores of study quality are difficult to interpret (Conn & Rantz, 2005), we computed separate analyses for each criterion. A specific hypothesis could only be stated for one criterion of quality: Nonsignificant results may be less likely to be published (the file-drawer problem) (Lipsey & Wilson, 2001). Thus, Hypothesis 2.7 states that effect sizes will be larger in published than in unpublished studies.
Methods
Published and unpublished studies were identified through electronic databases [Adolesc, PSYCINFO, MEDLINE, Google Scholar, PSYNDEX—search terms: (obes* OR overweight OR weight OR BMI OR body mass index OR physical activity OR sedentary behavior OR eating OR dietary intake) AND (infant OR child* OR adolesc* or youth) AND (parenting OR child rearing OR parent-child relation OR mother-child relation OR father-child relation OR demandingness OR responsiveness OR authoritative OR authoritarian OR permissive OR indulgent OR neglectful OR overprotection OR inconsistence)] and cross-referencing. Criteria for inclusion of studies in the present meta-analysis were as follows:
The studies had been published/presented before December 2013.
They related parenting dimensions or styles or the quality of the parent–child relationship to child weight (obesity/overweight/BMI), indicators of healthy/unhealthy eating behavior, or level of physical activity, or they provided information for a comparison of children with obesity/overweight with established normative data.
Mean age of participants ≤20 years.
Standardized between-group differences in the outcome variables were reported or could be computed.
Studies were excluded if they focused on young people with underweight or eating disorders (anorexia, bulimia, binge eating). The electronic search identified k = 1,093 entries. An additional 17 studies were identified via cross-referencing. After checking the abstracts and the full texts, 954 studies had to be excluded (Figure 1). Thus, 156 papers were included in the final meta-analysis. A list of the included studies and the PRISMA checklist are available as supplementary material online at http://jpepsy.oxfordjournals.org.
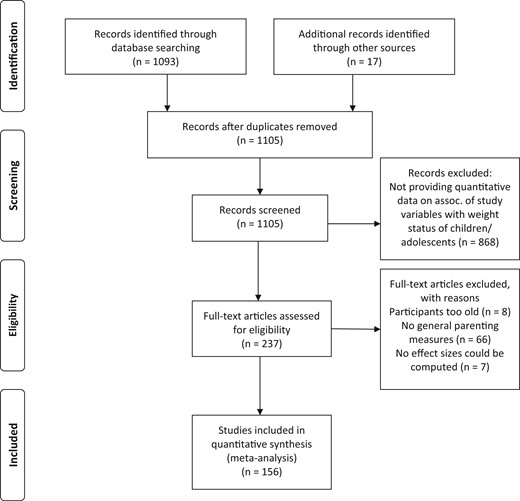
PRISMA 2009 flow diagram.
Data on the consumption of fruits and vegetables versus fast food, snacks, sweets, or soft drinks were used as indicators of (un-)healthy eating behavior, following Sleddens et al. (2011). We did not analyze data on other eating measures (e.g., eating regular breakfast, frequency of family lunch) because they were difficult to compare across studies or did not provide clear indicators of (un-)healthy food intake. As indicators of activity patterns, we coded the amount of physical activity (such as participation in sports; usually assessed as hours per day or week) versus the amount of sedentary activity (television/computer use).
We entered the total number of participants, the number of participants who are and are not obese/overweight, mean age, percentage of members of ethnic minorities, percentage of mothers, year of publication, the study design (1 = cross-sectional, 2 = longitudinal), the rater of parenting variables/parent–child relationship and weight/eating/activity variables (1 = child, 2 = parent, 3 = observer/clinician), the measurement of the variables (weight: 1 = BMI (continuous), 2 = overweight, 3 = obesity), sociodemographic equivalence of the obese and nonobese group (2 = yes, 1 = no/not tested), the quality of the measures (2 = evidence for validity and reliability, 1 = others), sampling procedure (2 = random (e.g., school-based), 1 = convenience), publication status (2 = published in peer-reviewed journal, 1 = others), and the standardized size of between-group differences in the assessed outcome variables. If between-group differences were provided for several subgroups within the same publication (e.g., for boys vs. girls), we entered them separately in our analysis instead of entering the global association. If data from more than one rater were collected, we entered the effect sizes separately because we were interested in whether they varied by the source of information. However, to avoid a disproportional weighting of these studies, we adjusted the weights of the individual effect sizes so that the sum of the weights of the effect sizes was equal to the weight of the study if only one effect size had been reported (Lipsey & Wilson, 2001). The author and a graduate student with experience in child psychology and research methods coded one-third of the studies separately, based on a review protocol. A mean inter-rater reliability was established (categorical variables: Cohen’s kappa .81; continuous variables: r = .92). Discrepancies were resolved by consensus.
Measures
Dimensions or styles of parenting were assessed with the Parenting Scale (Arnold, O’ Leary, Wolff, & Acker, 1993; 9 studies), the Parenting Styles and Dimensions Questionnaire (Robinson, Mandleco, Olsen, & Hart, 1995; 8 studies), the Authoritative Parenting Index (Jackson, Bee-Gates, & Henriksen, 1994; 7 studies), the Child Report of Parental Behavior Inventory (Schaefer, 1965; 7 studies), and related instruments (86 studies).
The quality of the parent–child relationship was assessed with the Kidscreen-52 (Ravens-Sieberer et al., 2006; 7 studies), the “I think I am” (Ouvinen-Birgerstam, 1985; 4 studies), the Pictorial Scale of Perceived Competence and Social Acceptance for Young Children (Harter & Pike, 1984; 3 studies), and related instruments (23 studies).
Forty-nine studies assessed obesity, 37 studies focused on overweight, and 58 studies used the BMI as a continuous measure. Twenty-four studies assessed the consumption of fruits and/or vegetables with food frequency questionnaires (Bogers, Van Assema, Kester, Westerterp, & Dagnelie, 2004), 10 studies provided data on consumption of snacks, four studies on consumption of sweets, four on consumption of sugared soft drinks, four on fast food, and another three studies used a global/sum measure of healthy eating. In addition, 18 studies used questionnaires on the amount of physical activity, such as the Previous-Day Physical Activity Recall (Weston, Petosa, & Pate, 1997). Another four studies assessed minute-by-minute movement counts by accelerometers. Regarding sedentary activities, six studies asked for hours of television use and another six studies provided sum measures of playing video games, computer, and television use.
Statistical Integration of the Findings
Calculations for the meta-analysis were performed in six steps using random-effects models and the method of moments (Lipsey & Wilson, 2001). Random-effects models were chosen because not all sources of heterogeneity may be identified in the meta-analysis.
We computed effect sizes d for each study as the difference in parenting or parent–child relationship between the sample with obesity/overweight and the control sample divided by the pooled standard deviation (SD). Outliers that were more than 2 SD from the mean of the effect sizes were recoded to the value at 2 SD.
Effect size estimates were adjusted for bias due to overestimation of the population effect size in small samples (using Hedges’ g).
Weighted mean effect sizes and 95%-confidence intervals were computed. The significance of the mean was tested by dividing the weighted mean effect size by the standard error of the mean. To interpret the practical significance of the results, we used Cohen’s criteria (Cohen, 1992). According to Cohen, differences of g = .80 are interpreted as large, of g = .50 as medium, and of g = .20 as small.
Homogeneity of effect sizes was tested by use of the Q statistic. Significant Q-scores indicate that the variability of effect sizes is larger than would be expected from sampling error. In this case, moderator analysis is recommended for identifying the sources of heterogeneity.
To test whether the results may have been influenced by publication bias, we used the “trim and fill” algorithm (Duval & Tweedie, 2000), which estimates an adjusted effect size in the presence of publication bias.
To test the influence of moderator variables, we used an analogue of analysis of variance. This procedure partitions the total Q-score into the proportion explained by the moderator variable (QB) and the residual pooled within groups portion (QW). Significant QB scores indicate a significant moderator effect.
Results
Data from 287,944 children and adolescents were included in the meta-analysis, 7,822 of them being obese, and 7,007 being in a sum-category of young people who are overweight or obese. Another 165,285 children and adolescents had normal weight, and the remaining 107,830 young people participated in studies with a continuous BMI measure that did not specify the number of obese participants. The children had a mean age of 11.61 years (SD = 3.18): 51.9% were girls, and 49.4% were members of ethnic minorities.
The first analyses addressed average associations of parenting/parent–child relationship with child weight. Only a subset of studies provided data on parent–child relationship and individual aspects of parenting (Table I). In support of Hypothesis 1, we found that a better parent–child relationship was associated with lower body weight (g = −.05), higher levels of healthy eating (g = .20), and more physical activity (g = .10). These relationships are interpreted as very small to small (Cohen, 1992). In addition, higher levels of parental responsiveness were associated with lower weight (g = −.11) and more physical activity of the child (g = .17)—very small effect sizes. Furthermore, higher levels of parental demandingness were related to lower weight (g = −.08), healthier eating (g = .15), and higher levels of physical activity of the child (g = .05)—very small associations. Parental overprotection (g = .20), psychological control (g = .16), and parental inconsistency (allowing a particular behavior at one time and forbidding it at another; g = .39) were associated with higher body weight, and these effect sizes were, on average, small.
Associations of Quality of the Parent–Child Relationship and Parenting With Body Weight Measures in Children and Adolescents
| Associations with weight/overweight/obesity | Associations with healthy eating | Associations with physical activity | ||||||||||||||||
|---|---|---|---|---|---|---|---|---|---|---|---|---|---|---|---|---|---|---|
| Aspect of parenting/parent-child relation | k | g | 95%-CI | Z | Q | k | g | 95%-CI | Z | Q | k | g | 95%-CI | Z | Q | |||
| Parent–child relation | 96 | −.05 | −.07 | −.04 | −5.77*** | 85.63 | 4 | .20 | .08 | .31 | 3.27** | 3.88 | 6 | .10 | .05 | .16 | 3.57*** | .65 |
| Responsiveness | 80 | −.11 | −.16 | −.05 | −4.02*** | 240.61*** | 14 | .14 | −.00 | .27 | 1.96 | 21.43* | 18 | .17 | .11 | .23 | 5.77*** | 12.18 |
| Demandingness | 70 | −.08 | −.13 | −.03 | −3.13** | 144.92*** | 14 | .15 | .02 | .27 | 2.30* | 25.83** | 19 | .05 | .00 | .10 | 2.12* | 20.27 |
| Overprotection | 8 | .20 | .07 | .33 | 3.13** | 8.21 | ||||||||||||
| Psychological control | 11 | .16 | .06 | .26 | 3.18** | 6.00 | 1 | −.02 | −.13 | .09 | −.36 | |||||||
| Inconsistent p. | 7 | .39 | .09 | .70 | 2.51* | 55.99*** | 1 | .16 | −.24 | .56 | .79 | 1 | −.05 | −.44 | .34 | −.25 | ||
| Authoritative p. | 39 | −.08 | −.14 | −.03 | −2.81** | 59.79* | 25 | .14 | .04 | .23 | 2.93** | 91.67*** | 19 | .04 | −.02 | .11 | 1.40 | 6.17 |
| Authoritarian p. | 41 | −.03 | −.09 | .04 | −.83 | 108.67*** | 19 | .01 | −.07 | .09 | .14 | 46.27*** | 13 | −.00 | −.08 | .07 | −.12 | 5.38 |
| Permissive p. | 41 | .04 | −.01 | .10 | 1.65 | 68.68** | 18 | −.04 | −.13 | .04 | −.97 | 43.33*** | 12 | −.02 | −.09 | .05 | −.59 | 10.47 |
| Neglectful p. | 21 | .12 | .02 | .21 | 2.38* | 105.55*** | 14 | −.09 | −.15 | −.03 | −3.13** | 16.95 | 7 | −.01 | −.09 | .07 | −.26 | 3.75 |
Note. k = number of studies; g = effect size (scores > 0 indicate that higher levels of the assessed parenting or parent–child variable were associated with higher body weight; 95% CI = lower and upper limits of 95% confidence interval; Z = test for significance of g; Q = test for homogeneity of effect sizes; p. = parenting. *p < .05; **p < .01; ***p < .001.
With regard to parenting styles, we observed that authoritative parenting was associated with lower weight (g = −.12) and healthier eating of the child (g = .14). Both effect sizes were very small. In addition, neglectful parenting was related to higher body weight (g = .12) and lower levels of healthy eating of the child (g = −.09)—very small effect sizes.
Effect sizes of parent–child relationship, responsiveness, demandingness, and parenting styles were, in part, heterogeneous. The heterogeneity of effect sizes indicates the need for moderator analyses that identify the sources of heterogeneity. Thus, moderator analyses were computed for these relationship and parenting variables.
Results of Moderator Analysis
Weight Measure and Study Design
A significant Q-score indicated that the weight measure moderated the size of the association of parent–child relationship with child weight: Associations were stronger in studies on obesity (g = −.15) than in studies on overweight (g = −.03) (Table II). Similarly, associations of neglectful parenting with child weight varied between studies on obesity, overweight, and BMI as a continuous measure. Neglectful parenting tended to show a stronger relationship with obesity (g = .30) than with other weight measures (g = −.01 to .01). Thus, Hypothesis 2.1 received no support.
Moderating Effects of Study Characteristics on the Association of Parent–Child Relation and Parenting With Child Weight
| Parent–child relation | Demandingness | Responsiveness | ||||||||||||||||
|---|---|---|---|---|---|---|---|---|---|---|---|---|---|---|---|---|---|---|
| Moderator | k | g | 95%-CI | Z | Q | k | g | 95%-CI | Z | Q | k | g | 95%-CI | Z | Q | |||
| Weight measure | 30.70*** | 1.48 | 3.01 | |||||||||||||||
| Obesity | 34 | −.15 | −.19 | −.11 | −7.54*** | 25.38 | 22 | −.05 | −.14 | .03 | −1.09 | 28.12 | 20 | −.18 | −.28 | −.09 | −3.88*** | 25.33 |
| Overweight | 52 | −.03 | −.05 | −.01 | −2.47* | 28.54 | 31 | −.11 | −.19 | −.03 | −2.57* | 35..35 | 33 | −.14 | −.22 | −.06 | −3.25** | 38.45 |
| Weight (BMI) | 10 | −.06 | −.20 | .08 | −.78 | .96 | 16 | −.02 | −.15 | .10 | −.32 | 1.40 | 26 | −.14 | −.25 | −.03 | −2.46* | 34.04* |
| Prospective vs. concurrent association | 13.30*** | 1.92 | 3.17 | |||||||||||||||
| Concurrent | 88 | −.04 | −.06 | −.02 | −4.32*** | 69.78 | 60 | −.08 | −.14 | −.03 | −2.92** | 52.19 | 61 | −.09 | −.16 | −.03 | −2.72** | 64.99 |
| Prospective | 8 | −.16 | −.21 | −.10 | −5.24*** | 2.32 | 9 | .02 | −.11 | .15 | .27 | 10.32 | 17 | −.18 | −.30 | −.07 | −3.06** | 8.75 |
| Child age | 20.67*** | .01 | 3.62 | |||||||||||||||
| ≤Md (10 years) | 15 | −.16 | −.21 | −.11 | −6.30*** | 14.43 | 32 | −.07 | −.15 | .00 | −1.86 | 33.27 | 44 | −.07 | −.14 | .01 | −1.72 | 44.85 |
| >Md | 81 | −.04 | −.06 | −.02 | −3.69*** | 49.99 | 33 | −.06 | −.14 | .01 | −1.61 | 27.18 | 33 | −.18 | −.27 | −.09 | −3.96*** | 34.72 |
| Parental gender | 14.05*** | 6.29* | .32 | |||||||||||||||
| Mothers | 29 | −.04 | −.07 | .00 | −1.87 | 7.84 | 14 | −.17 | −.30 | −.07 | −2.63** | 8.79 | 17 | −.14 | −.27 | −.00 | −2.02* | 18.40 |
| Mix | 36 | −.12 | −.17 | −.08 | −5.32*** | 26.77 | 33 | −.02 | −.07 | .05 | −.50 | 37.27 | 39 | −.11 | −.20 | −.03 | −2.68** | 41.93 |
| Fathers | 26 | −.01 | −.05 | .03 | −.67 | 9.08 | 22 | −.09 | −.17 | −.01 | −2.24* | 20.61 | 23 | −.09 | −.20 | .02 | −1.58 | 18.86 |
| Percentage of members of ethnic minority | .38 | 2.06 | 6.21* | |||||||||||||||
| ≤Md (27%) | 6 | −.11 | −.26 | .04 | −1.43 | 2.41 | 23 | −.07 | −.14 | .01 | −1.82 | 25.74 | 25 | −.20 | −.26 | −.13 | −5.93*** | 34.64* |
| >Md | 7 | −.16 | −.22 | −.10 | −5.30*** | 3.31 | 16 | −.16 | −.25 | −.07 | −3.41*** | 7.00 | 19 | −.07 | −.15 | .01 | −1.63 | 10.87 |
| Rater (parent−child relation; parenting) | 15.07*** | 1.94 | 8.20* | |||||||||||||||
| Child | 80 | −.04 | −.06 | −.02 | −4.02*** | 59.91 | 26 | −.12 | −.21 | −.03 | −2.63** | 11.98 | 40 | −.04 | −.11 | .04 | −.86 | 27.20 |
| Parent | 11 | −.12 | −.27 | .04 | −1.46 | 4.88 | 35 | −.05 | −.11 | .02 | −1.32 | 48.06* | 24 | −.17 | −.27 | −.07 | −3.48*** | 37.42* |
| Observer | 6 | −.16 | −.22 | −.10 | −5.31*** | 2.06 | 4 | −.10 | −.27 | .07 | −1.17 | .55 | 11 | −.23 | −.37 | −.10 | −3.55*** | 8.56 |
| Sample | 17.11*** | .14 | .11 | |||||||||||||||
| Convenience | 28 | −.18 | −.24 | −.11 | −5.59*** | 24.37 | 30 | −.09 | −.19 | .00 | −1.92 | 40.57* | 25 | −.13 | −.24 | −.01 | −2.21* | 53.61*** |
| Random | 69 | −.04 | −.06 | −.01 | −2.82** | 30.20 | 40 | −.07 | −.14 | −.00 | −2.08* | 28.38 | 54 | −.10 | −.17 | −.04 | −2.98** | 26.48 |
| Quality of assessment of parent−child relation/parenting | 7.97** | .00 | .72 | |||||||||||||||
| Low | 52 | −.03 | −.06 | −.00 | −2.19* | 20.51 | 32 | −.07 | −.13 | .00 | −1.95 | 35.82 | 36 | −.13 | −.22 | −.05 | −3.27*** | 21.24 |
| High | 45 | −.12 | −.18 | −.07 | −4.29*** | 21.67 | 37 | −.07 | −.15 | .02 | −1.57 | 26.60 | 43 | −.08 | −.17 | −.00 | −1.97* | 57.92* |
| Äquivalence of obese and nonobese sample | .44 | 6.12* | 2.17 | |||||||||||||||
| No/not tested | 90 | −.05 | −.08 | −.03 | −4.84* | 72.97 | 62 | −.06 | −.12 | −.00 | −2.07* | 61.47 | 70 | −.10 | −.16 | −.04 | −3.13** | 70.59 |
| Yes | 7 | −.14 | −.39 | −.11 | −1.09 | 2.07 | 8 | −.29 | −.46 | −.11 | −3.24** | 6.39 | 9 | −.26 | −.47 | −.05 | −2.46* | 7.75 |
| Publication status | 1.52 | 1.81 | .14 | |||||||||||||||
| Published | 89 | −.05 | −.07 | −.03 | −4.56*** | 63.29 | 58 | −.08 | −.13 | −.03 | −2.90** | 55.61 | 69 | −.11 | −.18 | −.05 | −3.59*** | 71.92 |
| Unpublished | 8 | −.17 | −.37 | .02 | −1.74 | 3.10 | 10 | .03 | −.12 | .18 | .38 | 7.49 | 10 | −.08 | −.26 | .10 | −.84 | 7.44 |
| Authoritative parenting | Authoritarian parenting | Permissive parenting | Neglectful parenting | |||||||||||||||||||||
|---|---|---|---|---|---|---|---|---|---|---|---|---|---|---|---|---|---|---|---|---|---|---|---|---|
| k | g | 95%-CI | Z | Q | k | g | 95%-CI | Z | Q | k | g | 95%-CI | Z | Q | k | g | 95%-CI | Z | Q | |||||
| Weight measure | 2.52 | 3.21 | 3.42 | 8.03* | ||||||||||||||||||||
| Obesity | 16 | −.13 | −.21 | −.04 | −2.96** | 18.09 | 18 | −.03 | −.13 | .08 | −.52 | 18.32 | 14 | .11 | .02 | .18 | 2.64* | 16.27 | 8 | .30 | .14 | .45 | 3.64*** | 17.97* |
| Overview | 13 | −.10 | −.25 | .04 | −1.41 | 11.62 | 9 | −.18 | −.33 | −.03 | −2.36* | 23.36* | 10 | .01 | −.09 | .11 | .25 | 18.48 | 9 | −.01 | −.22 | .20 | .12 | 1.64 |
| BMI | 15 | −.03 | −.12 | .06 | .10 | 7.92 | 14 | .06 | −.05 | .14 | 1.01 | 8.37 | 7 | .01 | −.06 | .09 | .40 | 13.44 | 4 | .01 | −.16 | .17 | .08 | 1.63 |
| Prospective vs. concurrent association | .00 | 2.25 | .02 | .00 | ||||||||||||||||||||
| Concurrent | 30 | −.08 | −.16 | −.01 | −2.30* | 32.99 | 30 | −.07 | −.15 | .02 | −1.53 | 40.22 | 30 | .05 | −.02 | .11 | 1.36 | 33.46 | 10 | .12 | −.04 | .28 | 1.43 | 10.54 |
| Prospective | 9 | −.09 | −.19 | .02 | −1.64 | 5.50 | 11 | .05 | −.07 | .16 | .75 | 12.34 | 11 | .04 | −.05 | .13 | .90 | 11.06 | 11 | .12 | −.05 | .28 | 1.41 | 12.24 |
| Child age | .10 | .00 | 1.53 | 2.79 | ||||||||||||||||||||
| ≤Md | 24 | −.09 | −.17 | −.01 | −2.31* | 18.51 | 26 | −.03 | −.13 | .07 | −.55 | 35.68 | 27 | .07 | .01 | .14 | 2.13* | 38.49 | 10 | .02 | −.14 | .18 | .25 | 2.59 |
| >Md | 15 | −.07 | −.16 | .01 | −1.70 | 20.19 | 15 | .03 | −.14 | .08 | .54 | 14.31 | 14 | .01 | −.07 | .08 | .26 | 7.32 | 11 | .21 | .06 | .36 | 2.68*** | 19.62* |
| Parental gender | .06 | 1.90 | .44 | 2.35 | ||||||||||||||||||||
| Mothers | 15 | −.09 | −.18 | .01 | −1.71 | 9.07 | 17 | −.07 | −.19 | .05 | −1.22 | 18.14 | 15 | .02 | −.07 | .12 | .43 | 9.67 | 5 | .04 | −.18 | .26 | .38 | 1.05 |
| Mix | 18 | −.09 | −.18 | −.00 | −2.01* | 21.38 | 17 | .03 | −.08 | .14 | .54 | 27.26* | 19 | .05 | −.03 | .12 | 1.15 | 21.69 | 12 | .20 | .05 | .34 | 2.59** | 21.92* |
| Fathers | 6 | −.07 | −.20 | .06 | −1.06 | 7.89 | 7 | −.07 | −.23 | .09 | −.86 | 3.53 | 7 | .07 | −.04 | .18 | 1.27 | 13.07 | 4 | .01 | −.22 | .24 | .10 | .08 |
| Percentage of members of ethnic minority | .04 | .95 | .09 | 2.98 | ||||||||||||||||||||
| ≤Md | 12 | −.12 | −.21 | −.03 | −2.55* | 13.67 | 12 | .01 | −.14 | .16 | .13 | 10.42 | 12 | .02 | −.05 | .09 | .58 | 16.43 | 8 | .22 | .06 | .38 | 2.73** | 14.04* |
| >Md | 10 | −.10 | −.21 | .00 | −1.94 | 6.56 | 10 | −.10 | −.26 | .06 | −1.21 | 15.98 | 12 | .03 | −.02 | .09 | 1.22 | 12.57 | 8 | .03 | −.13 | .18 | .32 | 2.13 |
| Rater (parenting) | .08 | 2.80 | 5.37 | 2.59 | ||||||||||||||||||||
| Child | 8 | −.10 | −.20 | −.00 | −1.99* | 8.83 | 9 | .01 | −.12 | .14 | .12 | 2.52 | 8 | −.01 | −.09 | .07 | −.23 | 2.74 | 6 | .19 | −.01 | .38 | 1.90 | 9.59 |
| Parent | 28 | −.09 | −.16 | −.01 | −2.29* | 26.91 | 29 | −.07 | −.16 | .02 | −1.60 | 46.19* | 30 | .08 | .02 | .15 | 2.65* | 40.51 | 11 | .04 | −.11 | .18 | .48 | 6.30 |
| Observations | 2 | −.12 | −.42 | .19 | .75 | .25 | 2 | .20 | −.16 | .56 | 1.11 | .00 | 2 | −.18 | −.48 | .12 | −1.19 | .20 | 4 | .25 | −.02 | .53 | 1.82 | 7.04 |
| Sample | .32 | .54 | .32 | 2.19 | ||||||||||||||||||||
| Convenience | 16 | −.05 | −.18 | .08 | −.77 | 13.52 | 15 | −.08 | −.24 | .08 | −1.08 | 26.86* | 17 | .01 | −.11 | .13 | .19 | 21.74 | 2 | −.21 | −.66 | .24 | −.92 | 0.00 |
| Random | 23 | −.09 | −.16 | −.02 | −2.79** | 24.75 | 26 | −.01 | −.10 | .07 | −.34 | 22.72 | 24 | .05 | −.01 | .11 | 1.71 | 22.31 | 19 | .14 | .02 | .25 | 2.38* | 22.12 |
| Quality of assessment of parenting | 1.20 | 1.32 | .12 | .94 | ||||||||||||||||||||
| Low | 15 | −.11 | −.19 | −.04 | −2.91** | 17.98 | 16 | .01 | −.10 | .11 | .12 | 7.64 | 17 | .05 | −.02 | .11 | 1.43 | 16.98 | 18 | .12 | .02 | .26 | 2.23* | 20.92 |
| High | 22 | −.04 | −.14 | −.06 | −.79 | 17.69 | 23 | −.09 | −.21 | .03 | −1.41 | 39.62* | 22 | .03 | −.08 | .13 | .50 | 25.42 | 3 | −.04 | −.37 | .30 | −.22 | 1.18 |
| Äquivalence of obese and nonobese sample | .01 | 1.03 | 2.61 | |||||||||||||||||||||
| No/not tested | 37 | −.08 | −.14 | −.03 | −2.79** | 38.26 | 39 | −.02 | −.10 | .05 | −.61 | 48.36 | 39 | .05 | −.00 | .10 | 1.84 | 42.54 | 21 | .12 | .02 | .21 | 2.38* | 105.55*** |
| Yes | 2 | −.10 | −.52 | .37 | −.42 | .23 | 2 | −.27 | −.74 | .20 | −1.12 | 1.32 | 2 | −.30 | −.72 | .12 | −1.42 | .01 | ||||||
| Publication status | 2.05 | .34 | .62 | 21.40*** | ||||||||||||||||||||
| Published | 30 | −.07 | −.13 | −.00 | −2.10* | 28.69 | 33 | −.02 | −.10 | .06 | −.46 | 38.94 | 32 | .05 | −.00 | .11 | 1.85 | 41.07 | 20 | .07 | −.00 | .14 | 1.93 | 28.97 |
| Unpublished | 9 | −.18 | −.32 | −.04 | −2.50* | 9.51 | 8 | −.08 | −.26 | .10 | −.85 | 11.01 | 9 | −.01 | −.14 | .13 | −.10 | 3.04 | 1 | .88 | .54 | 1.21 | 5.16*** | 0 |
Note. k = number of studies; g = effect size (scores > 0 indicate that higher levels of the assessed parenting or parent–child variable were associated with higher body weight; 95% CI = lower and upper limits of 95% confidence interval; Z = test for significance of g; Q = test for homogeneity of effect sizes. *p < .05; **p < .01; ***p < .001.
In contrast to Hypothesis 2.2, we observed a stronger association of quality of the parent–child relationship with weight status in longitudinal studies (g = −.16) than in cross-sectional studies (g = −.04). In line with Hypothesis 2.3, we found stronger associations of relationship quality with weight status in children (g = −.16) than in adolescents (g = −.04).
Sociodemographic Variables
We found limited support for Hypothesis 2.4. Associations of parental demandingness with weight measures were stronger in studies on mothers (g = −.17) than in studies that did not distinguish between mothers and fathers (g = −.02). However, associations of parent–child relationship with child weight were stronger in studies that reported average associations across both parents (g = −.12) than in studies that only provided data on the mother–child (g = −.04) or father–child relationship (g = −.01). Stronger associations of responsiveness with child weight were observed in studies with a lower percentage of families from ethnic minorities (g = −.20) than in other studies (g = −.07), thus not supporting Hypothesis 2.5.
In contrast to Hypothesis 2.6, effect sizes did not differ between parent and child ratings. However, associations between the quality of the parent–child relationship and weight status were weaker if child ratings were used (g = −.04) rather than observer ratings (g = −.16). A similar trend emerged for responsiveness (g = −.23 vs. g = −.04).
Study Quality
Analyses of study quality provided mixed results. Stronger associations of the parent–child relationship with child weight were found in studies with measures of proven validity and reliability than in other studies (g = −.12 vs. g = −.03). Associations of demandingness with child weight were stronger in studies that ensured sociodemographic equivalence of the obese and nonobese group (g = −.29 vs. g = −.06). However, associations of parent–child relationship with weight status were weaker in random samples than in convenience (clinical) samples (g = −.04 vs. g = −.18). Furthermore, associations of neglectful parenting with weight status were stronger in the included unpublished study (g = .88) than in published studies (g = .07), but only one unpublished study was available for this comparison.
The trim and fill algorithm found no evidence of file-drawer problems. There were some asymmetrical distributions of effect sizes but correcting them led to slightly higher effects for the association of weight with parental demandingness (g = −.11), responsiveness (g = −.17), permissive (g = −.08), and neglectful parenting (g = .23), and for associations of authoritative parenting with healthy eating (g = .26). No multivariate analyses for moderating effects were computed because of limited test power.
Discussion
In the first meta-analysis on associations of parenting and parent–child relationship with child weight, eating, and activity patterns, we observed in most cases very small associations. A positive parent–child relationship and higher levels of parental responsiveness were associated with lower weight, healthier eating, and more physical activity of the child. Parental demandingness, overprotection, psychological control, inconsistency, and parenting styles showed associations with some of the assessed outcomes. The effect sizes varied, in part, by weight measures used, time of assessment, child age, parental gender, ethnicity, rater, quality of the assessment of parenting/parent–child relationship, and publication status.
Average Associations of Parenting and Parent–Child Relation With Child Outcomes
The present meta-analysis indicates that the heterogeneous results of previous narrative reviews (Skouteris et al., 2012; Sleddens et al., 2011; Trost & Loprinzi, 2011; Ventura & Birch, 2008) are at least partly based on the fact that average effect sizes are very small and can only be detected in large samples. The very small effect sizes may not be surprising because many factors affect child obesity (Harrison et al., 2011), and each individual factor will explain a limited amount of variance.
Interestingly, we observed the largest effect size with regard to parental inconsistency. A lack of clear parental rules hinders the establishment of healthy eating behavior, physical activity patterns, and self-regulatory abilities in general.
When comparing different parenting styles, authoritative parenting was associated with a lower risk of obesity, whereas neglectful and permissive parenting related to higher obesity risk. Our results indicate that the effect of authoritative parenting on child weight may be explained by healthier eating patterns rather than by higher levels of physical activity. Activity levels may be influenced more by other factors, such as school activity requirements, local transportation practices, and leisure preferences of peers (Harrison et al., 2011). Permissive and neglectful parents are likely to tolerate unhealthy eating and activity patterns that are risk factors for higher body weight (Rhee et al., 2006; Harrison et al., 2011) although we found such an effect only for eating patterns in neglectful families. The lack of significant overall associations of authoritarian parenting with the outcome variables may indicate that some of these parents promote healthy behaviors through high parental control, while others provoke resistance and loss of child desire to eat healthily or exercise (Rhee et al., 2006).
Moderator Effects of Study Characteristics
Weight Measure and Study Design
In contrast to the review by Sleddens et al. (2011), our meta-analysis indicates that clearer results are found when contrasting obese or overweight children with their peers with normal weight rather than analyzing correlations of parenting with BMI. For example, as authoritative parenting may not only protect from overweight and obesity but also from underweight and anorexia nervosa (Enten & Golan, 2009), linear correlations of parenting and BMI blur the effects of parenting at both ends of the continuum of body weight.
We did not find weaker effect sizes in prospective studies than in concurrent studies, and associations of parent–child relationship with weight status were even stronger in prospective studies. However, the latter result should be interpreted with caution: A study that provided concurrent associations in samples from 24 countries (Al Sabbah et al., 2009) used a single-item relationship indicator and a median-split of high versus low relationship quality. Associated larger measurement errors and variance restrictions probably led to an underestimation of the concurrent association between relationship quality and weight status.
Sociodemographic Characteristics
Only studies on parent–child relations supported the suggestion that associations with weight were weaker in adolescents than in children. However, age differences were difficult to detect, as only 20% of the included samples focused on middle and late adolescence.
Effect sizes of studies with a focus on mothers versus fathers did not differ systematically, but few studies provided separate data on fathers in particular. The lower effect size in studies on the mother–child and father–child relationship than in studies on the parent–child relationship in general could, again, be explained by an underestimation of effect sizes in a large individual study with multiple samples (Al Sabbah et al., 2009).
In contrast to our initial expectations, we found weaker associations of responsiveness and neglectful parenting with weight status if more families from ethnic minorities were assessed. One reason for this may be that overweight is more accepted in parents from ethnic minorities (Kumanyika, 2008), so that positive parenting behaviors would be less likely to be associated with promoting healthy eating or physical activity. In addition, lower income may have limited the promotion of a healthy family environment in these samples.
We found weaker associations of parent–child relationship and parenting with weight status if self-ratings of family members rather than observer ratings were used. This may indicate that families of a child with overweight or obesity may not want to be different from other families, thus underreporting problems with parenting and parent–child relations. Alternatively, observers may hold perceptions that obese/overweight individuals possess negative characteristics, such as lack of willpower or laziness or flaws in central attributes of competence (Puhl & Brownell, 2001), which could lead to negative perceptions of parenting and parent–child relations.
Study Quality
Moderating effects of study quality varied between the considered criteria and outcome variables. For example, studies using measures of low quality could be expected to produce lower effects if low quality indicates low reliability of the measure and high error variance. This was the case in studies of the parent–child relationship where studies of low quality most often used single-item indicators. Effects of other criteria of the quality of the measures (e.g., use of well validated vs. home-made measures) are less consistent across studies and produce random rather than systematic differences.
We did not find any evidence of a possible file-drawer problem. The asymmetrical distribution of effect sizes and the slightly higher effect sizes of the trim and fill analysis (Duval & Tweedie, 2000) are unlikely to indicate that studies with larger effect sizes were more likely to remain unpublished. The asymmetrical distribution of effect sizes could rather be explained by the fact that clinical studies on obese children with stronger effect sizes tended to use smaller samples than school-based studies with continuous BMI measures and smaller effect sizes. In other words, if more large clinical studies on the comparison of obese and normal-weight children were done, we would find somewhat larger average associations of parenting and parent–child relationship with child weight.
Limitations and Conclusions
Some limitations of the present meta-analysis should be mentioned. First, although the number of included studies is much larger than that of available narrative reviews, few studies were available for some variables, such as parental inconsistency or overprotection. Effect sizes are less robust when they are based on a low number of studies. More associations of parenting with eating and activity may become statistically significant if more studies become available with similar positive findings and the test power increases. Second, as we focused on general parenting, associations of food- and activity-specific parenting with child weight must be addressed in another meta-analysis. Third, we focused on bivariate associations of parenting and the parent–child relationship with child weight, eating, and physical activity. Associations between parenting and weight status may, in part, be based on third variables, such as child temperament. Thus, significant associations of the parent–child relationship and parenting with child weight do not indicate causal relations. Causal relations could only be tested in experimental studies. A family-based intervention study (Stein, Epstein, Raynor, Kilanowski, & Paluch, 2005) showed that increase in father’s acceptance was significantly correlated with the amount of child weight loss. Fourth, few studies have identified interaction effects, for example, between general parenting style and specific feeding practices (Tung & Yeh, in press). Too few studies were available to meta-analyze these interaction effects. Fifth, although questionnaires on dietary intake and physical activity are common practice, their validity is less than optimal (Livingstone, Robson, & Wallace 2004).
Nonetheless, several conclusions can be drawn from the present meta-analysis. First, we conclude that associations of parental demandingness, responsiveness, authoritative parenting, and parent–child relations with child weight status tend to be very small. Second, although the number of available studies is limited, our results indicate that promoting consistent parenting behavior may be a good target of parenting-focused intervention components. Third, the very small effect sizes observed do not provide sufficient evidence for making general parenting styles, parental demandingness, responsiveness, and the quality of the parent–child relationship a main target of preventing and treating pediatric obesity. Fourth, with regard to future research needs, we recommend prospective studies on effects of weight status on change of parenting and of the parent–child relationship as these studies were almost totally lacking. Similarly, more studies on interaction effects of general parenting with weight-related parental behaviors are welcomed. Fifth, given the very small effect sizes we also recommend that researchers interested in associations of parenting and the parent–child relationship with pediatric obesity should ensure that their studies have sufficient test power. For example, when comparing obese and nonobese children, about 350 children are needed in each group to find a significant difference of .15 SD units. Finally, because comparative studies of obese and nonobese children provided clearer results than studies using the BMI, we recommend using obesity or overweight status rather than the BMI as a continuous measure. Alternatively, researchers should remove children who are underweight for analysis when using continuous weight data.
Conflicts of interest: None declared.
