


Abstract
Background: falling is a major health problem.
Objective: to investigate the predictive value for falls of the maximum step length and gait speed.
Design: a prospective cohort study.
Setting: geriatric outpatient clinic.
Subjects: three hundred and fifty-two community-dwelling older persons screened by their general practitioner.
Methods: maximum step length and gait speed were recorded as part of a comprehensive geriatric assessment. One-year follow-up was performed using the fall telephone system.
Results: one hundred and thirty-six (39%) of all subjects (mean age: 76.2 years, standard deviation: 4.3, 55% female), fell at least once, of whom 96 were injured. Predictive values for any falls of both maximum step length and gait speed were low (area under the curve (AUC): 0.53 and 0.50) and slightly better for recurrent falls (maximum step length AUC: 0.64 and gait speed AUC: 0.59). After adding age, gender and fall history to the prediction model, the AUC was 0.63 for maximum step length and 0.64 for gait speed, and for recurrent falls, the AUC was 0.69 both for maximum step length and gait speed. The prediction of fall-related injuries showed similar results. A higher maximum step length score indicated a lower likelihood for falls (hazards ratio 0.36; 95% confidence interval 0.17–0.78).
Conclusions: maximum step length and gait speed as single-item tools do not have sufficient power to predict future falls in community-dwelling older persons.
Introduction
Falling is a major problem in our ageing population [1, 2]. The ability to quickly identify changes in mobility by clinicians, which could be early warning signals for future falls and a deterioration in health status [1], would allow early implementation of appropriate fall prevention strategies. In addition, identifying changes in mobility at home by patients themselves would offer an excellent opportunity for older persons to take responsibility of their own mobility-related well-being. This could minimise the impact of their fall tendency on their lives and, moreover, might also mean a significant step in reaching a more improved and sustainable quality of our fall-related health-care services. However, meeting the goal of improved self-management and allowing the identification of relevant changes in mobility are only possible with a mobility assessment tool that is simple, quick, reliable, feasible and has sufficient predictive validity for future falls.
Maximum step length is potentially such a measure, as it simply is the maximum distance someone can step out without losing balance. Gait speed, measured over 4 m, can potentially also be such a measure. Recent studies have investigated the predictive value for future falls of maximum step length and gait speed, but they are equivocal [2–13]. Several studies showed maximum step length to be simple, reliable and feasible in measuring balance and mobility in both community-dwelling and frail older individuals; however, prospective studies linking maximum step length and falling are limited [2–6]. Gait speed proved to be feasible, valid and predictive for future adverse effects, such as falls, in community-dwelling older individuals [7–13]. However, the relationship between falls and gait speed has yet to be thoroughly explored using a fall assessment that is less prone to recall bias. Before these tests can be used as self-assessments in the home setting, this study, therefore, studied the predictive value for falling of maximum step length and gait speed as a single-item tool in a one-year follow-up study in community-dwelling older individuals using a more reliable method of fall follow-up: the fall telephone (FT) system [14, 15].
Methods
Study population
This study was part of the two-step older persons screening study (TOS-study), in which six general practitioners (GPs) began to screen all their patients aged over 70 for frailty [16]. Patients judged to be too ill to be screened by the GPs, and patients who were either currently receiving treatment from a geriatrician or who had received a comprehensive geriatric assessment in the past 3 months were excluded. A total of 1,159 older patients were screened, and 593 of these subjects were included in the TOS-study. Subjects were excluded from a specific test if they could not perform it independently or safely, based on the judgment of the geriatric nurse or subjects themselves. The local ethics committee approved the study (approval number 2009/223).
Comprehensive geriatric assessment
A specialized geriatric nurse and geriatrician administered all tests as part of a standardised geriatric assessment at a geriatric outpatient clinic. Functional performance was evaluated with the Katz scale (Katz 15-item scale, which measures basic and instrumental activities of daily living, score range 0–15, lower scores indicating better functional performance) [17]. Disease burden was assessed using the Cumulative Illness Rating Scale for Geriatrics (CIRS-G; 14 categories scored on a 0–4 scale (maximum score 56), higher scores reflecting more co-morbidities) [18]. Cognitive status was evaluated with the Mini Mental State Examination (MMSE, range 0–30, higher scores indicating better cognitive status) [19]. Geriatric Depression Scale (GDS) evaluated mood (range 0–15, higher scores indicating more depressive symptoms) [20]. Short Physical Performance Battery (SPPB) included usual gait speed measured over 4 m, five chair rises without using arms and the ability to stand in the side-by-side, semi-tandem and tandem positions (summary score (range 0–12), higher scores indicating better lower body function) [21]. Timed Up and Go (TUG) assessed the number of seconds needed to stand up, walk 3 m past a line on the floor as quickly as possible, turn around, walk back to the chair and sit down again with the back against the chair (best of two trials) [22]. Frailty was assessed using the Fried criteria (range 0–5; 0: not frail, 1–2: pre-frail, ≥3: frail): unintentional weight loss (defined as 4.5 kg or 5% of body weight over the previous year), self-reported exhaustion (defined as an affirmative answer to two questions), low energy expenditure (assessed with the Minnesota Leisure Time Physical Activity Questionnaire [23] and defined as <393 kcal/week for males and <280 kcal/week for females), slow gait speed (defined as <0.76 m/s, using the SPPB measurement) and weak grip strength (defined as <30 kg force for males and <18 kg for females) [24]. Grip strength was measured with a JAMAR™ hand dynamometer.
Maximum step length
Maximum step length was assessed by asking subjects to step forward with one leg as far as possible and to bring the other leg up to the first in one fluid movement without use of a walking aid [4]. A trial was unsuccessful when more than one step was needed to maintain balance or when balance was lost. After two instruction trials, the subject performed a maximum of five trials to obtain three successful trials. Step length was measured as the distance between the initial and final position of the leg that stepped first and was normalised with respect to leg length (step length divided by the distance between the spina iliaca anterior superior and lateral malleolus). Maximum step length was calculated as the maximum step length among the three successful trials.
Gait speed
The gait speed measurement of the SPPB was used [21], in which the time needed for subjects to walk a distance of 4 m at their usual speed (a walking aid was allowed) was measured by hand using a stopwatch. Subjects performed the test two times and gait speed was calculated as the mean speed of the two separate walks.
Falls
Falls were defined as ‘an unexpected event in which the subject comes to rest on the ground, floor or lower level’ [25]. At baseline, subjects were asked the number of falls they experienced in the past 12 months. After completing the baseline assessment, subjects were instructed about the FT system. The FT system (ASK Community Systems, Rotterdam, The Netherlands) is a computerised system that automatically contacts subjects by telephone using pre-recorded messages and proves to be feasible, reliable and valid for assessing falls in older persons [14, 15]. The FT system telephoned subjects weekly on their day of preference, and subjects reported the number of falls in the past week two times (in case a wrong number was entered the first time). If the call was not answered, the system called back up to a maximum of four times per day and then tried again the following day. The research assistant called subjects to verify each registered fall and those with no reply to the FT system.
Statistical analyses
The study population was divided into three groups based on whether they fell zero, one, or two or more times during the one-year follow-up (No-Fall group, One-Fall group and Recurrent-Falls group, respectively). Baseline characteristics of these groups were compared using one-way analysis of variance (ANOVA). Predictive values of the absolute cut-offs of baseline measures of maximum step length and gait speed for one or more future falls and recurrent (>1) falls were calculated as the areas under the curve (AUCs) of the receiver operating characteristic curves. Logistic regression models for fall risk (any faller or recurrent faller as dependent variable) included maximum step length and gait speed as predictor, along with the following covariates: age, gender and fall history. Additional analysis was performed with logistic regression for gait speed and maximum step length for predicting any injury, serious injury and falls at 1, 3 and 6 months of follow-up, separately. Cox proportional hazards models were determined for gait speed and maximum step length, both as continuous and categorical values (based on tertiles). Significance was set at two-tailed P < 0.05. All analyses were done using SPSS, version 20.0.01 (SPSS, Chicago, IL).
This work was supported by the National Programme for Elderly Care (grant number 311050301), which is coordinated and sponsored by ZonMw, The Netherlands, Organisation of Health Research and Development.
Results
Figure 1 shows the flow of subjects from the source population to the subjects who completed follow-up (n = 388). Data of all subjects who successfully performed both maximum step length and gait speed (n = 352) were used in the analyses. The median follow-up time was 53 weeks.
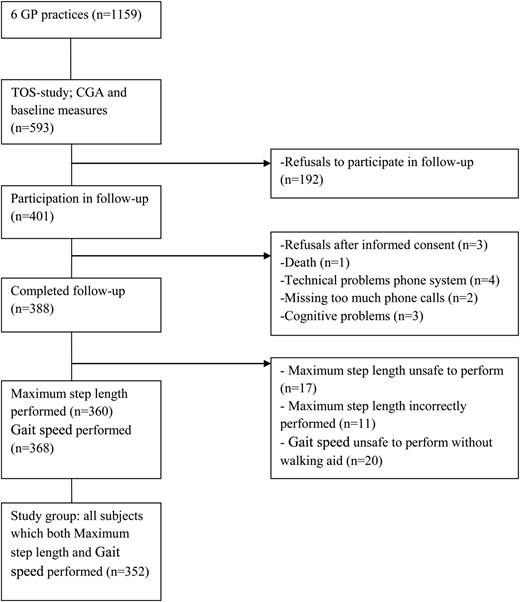
The flow of subjects from the source population to the analysed subjects.
In total, 285 falls (median 1.0 ± 3.6) were reported for 136 subjects (39%), 52 of them (15%) fell recurrently during follow-up (median number of falls 2.0 with a range of 1–38). Of all reported falls, 95.8% could be verified by the research assistant. Mean time to the first fall was 142 ± 114 days. There were 38 fallers without injury, 73 fallers with minor injuries, 23 fallers with serious injuries and 2 fallers with unknown injury.
Baseline characteristics of the total study group, No-Fall group, One-Fall group and Recurrent-Falls group, are reported in Table 1. Mean age of the study group was 76.2 (±4.3) years; 55% were female, and 34% reported at least one fall during the previous year. The Recurrent-Falls group was significantly older than the No-Fall and One-Fall groups (77.6 versus 76.3 and 75.9 years, respectively, P = 0.04). Fall history was significantly more common in the One-Fall (43%) and Recurrent-Falls groups (52%) compared with the No-Fall group (25%, P < 0.001). The Recurrent-Falls group used a walking aid significantly more, had a significantly lower grip strength, performed significantly worse on all the mobility measures (TUG, SPPB, gait speed and maximum step length) and had a significantly higher mood score (GDS) compared with the other groups. There were more injurious falls in the Recurrent-Falls group and a shorter time to the first fall (both P < 0.001).
Comparison of community-dwelling older subjects who did not fall with those who fell once and those who fell more than once during the follow-up period
| Total group (n = 352) | No-Fall group (n = 216) | One-Fall group (n = 84) | Recurrent-Falls group (n = 52) | Overall P value | |
|---|---|---|---|---|---|
| Age (years) | 76.2 ± 4.3 | 75.9 ± 4.3 | 76.3 ± 4.2 | 77.6 ± 4.4 | 0.04 |
| Gender (m/f) | 159/193 | 104/112 | 38/46 | 17/35 | 0.13 |
| Fall history (%) | 34 | 25 | 43 | 52 | 0.000 |
| Fried frailty categories | |||||
| Not frail (score 0; %) | 49.7 | 52 | 52.5 | 36 | 0.24 |
| Pre-frail (score 1, 2; %) | 45.5 | 42.5 | 44 | 60 | |
| Frail (score 3, 4, 5; %) | 4.8 | 5.5 | 3.5 | 4 | |
| Walking aid | |||||
| None (%) | 84 | 85 | 88 | 69 | 0.04 |
| Cane (%) | 7 | 6 | 6 | 15.5 | |
| Walker (%) | 9 | 9 | 6 | 15.5 | |
| MMSE (0–30) | 27.8 ± 2 | 27.7 ± 2.1 | 28.1 ± 1.5 | 27.6 ± 2.1 | 0.21 |
| GDS (0–15) | 2.0 ± 2.2 | 1.9 ± 2.1 | 1.7 ± 1.8 | 2.9 ± 2.6 | 0.007 |
| Katz (0–15) | 1.0 ± 1.2 | 0.9 ± 1.2 | 1.1 ± 1.2 | 1.3 ± 1.2 | 0.09 |
| CIRS-G (0–56) | 7.7 ± 4.2 | 7.6 ± 4.3 | 7.4 ± 3.8 | 8.6 ± 4.6 | 0.25 |
| Hand grip strength (kg) | 25.5 ± 9.7 | 26.8 ± 10.0 | 25.2 ± 9.4 | 20.9 ± 7.9 | 0.000 |
| TUG (s) | 8.8 ± 3.3 | 8.6 ± 3.0 | 8.7 ± 3.4 | 10.0 ± 4.1 | 0.03 |
| SPPB (0–12) | 9.7 ± 2.0 | 9.8 ± 1.9 | 10.0 ± 1.9 | 9.0 ± 2.3 | 0.01 |
| Gait speed (m/s) | 1.13 ± 0.34 | 1.13 ± 0.32 | 1.20 ± 0.38 | 1.03 ± 0.32 | 0.02 |
| Maximum step length | 1.08 ± 0.22 | 1.10 ± 0.22 | 1.12 ± 0.18 | 0.98 ± 0.25 | 0.001 |
| No injury/injury | na | na | 30/52 | 8/44 | 0.000 |
Overall P value of the ANOVA between the groups. The results are presented as the means ± standard deviation. The numbers within parentheses are the score ranges.
MMSE, Mini Mental State Examination; GDS, Geriatric Depression Scale; CIRS-G, Cumulative Illness Rating Scale for Geriatrics; TUG, Timed Up and Go test; SPPB, Short Physical Performance Battery; Maximum step length is corrected for leg length; na, not applicable.
Logistic regression models showed low predictive values for any future fall for maximum step length (AUC 0.53) and gait speed (AUC 0.50) (Table 2). Maximum step length was slightly superior to gait speed for recurrent falls (AUC 0.64 versus AUC 0.59, respectively). The model that combined gait speed with age, gender and fall history resulted in slightly better predictive values for any future fall (AUC 0.64) and recurrent falls (AUC 0.69). The predictive value of maximum step length combined with age, gender and fall history (AUC 0.63 for any future falls and AUC 0.69 for recurrent falls) was slightly less predictive than the complete model based on gait speed. The prediction for falls at 1, 3 and 6 months of follow-up did not show an improved predictive value for either test (data not shown). The predictive value of maximum step length and gait speed for any future fall resembles the predictive value for any injury, and, similarly, the predictive value for recurrent falls resembles the predictive value for a serious injury (Table 2).
Areas under the curve (AUC) of the receiver operating characteristics figure showing the diagnostic value of baseline gait speed and maximum step length measures for predicting falls and recurrent falls, and any injury and serious injury
| Model | Prediction of any fall (n = 136/352) | Prediction of recurrent falls (n = 52/352) | Prediction of any injury (n = 96/350) | Prediction of serious injury (n = 23/350) | |||||
|---|---|---|---|---|---|---|---|---|---|
| AUCa value | 95% CI | AUCa value | 95% CI | AUCa value | 95% CI | AUCa value | 95% CI | ||
| Maximum step length | Maximum step lengthb | 0.53 | 0.47–0.59 | 0.64 | 0.55–0.72 | 0.54 | 0.47–0.61 | 0.65 | 0.54–0.76 |
| Maximum step lengthc | 0.57 | 0.51–0.63 | 0.66 | 0.57–0.75 | 0.60 | 0.54–0.67 | 0.68 | 0.58–0.79 | |
| Maximum step lengthd | 0.63 | 0.57–0.69 | 0.69 | 0.61–0.77 | 0.62 | 0.56–0.69 | 0.69 | 0.58–0.79 | |
| Gait speed | Gait speedb | 0.50 | 0.43–0.56 | 0.59 | 0.50–0.68 | 0.52 | 0.46–0.59 | 0.57 | 0.45–0.70 |
| Gait speedc | 0.58 | 0.52–0.64 | 0.65 | 0.57–0.72 | 0.60 | 0.54–0.67 | 0.66 | 0.55–0.76 | |
| Gait speedd | 0.64 | 0.58–0.70 | 0.69 | 0.61–0.77 | 0.62 | 0.56–0.69 | 0.67 | 0.56–0.77 | |
95% CI, 95% confidence interval.
aAUC, area under the receiver operating characteristic curves for the maximum step length and gait speed for fallers versus non-fallers, for recurrent fallers versus non-fallers, for any injury versus non-injury and for serious injury versus non-injury.
bModel for maximum step length or gait speed alone.
cModel including age and gender.
dModel including age, gender and fall history.
Maximum step length as a continuous predictor had a hazards ratio (HR) of 0.36 (95% confidence interval (CI) 0.17–0.78, P = 0.01) per unit (1 m) increase in maximum step length. When maximum step length was divided into categories based on tertiles, subjects with a maximum step length >1.18 m showed a lower chance for falling, with a HR of 0.65 (95% CI 0.44–0.96, P = 0.03) relative to a reference group of people with a maximum step length between 1 and 1.18 m (middle tertile). The HR of 1.02 for subjects with a maximum step length <1 m (lowest tertile) was not significantly increased compared with the reference group. Gait speed was not significantly related to the time to the first fall.
Discussion
This study showed maximum step length and gait speed as simple single-item tools to have low predictive values for any falls within 12 months and moderately predictive values for recurrent falls. The full model, including age, gender and fall history, was best for predicting future falls, but still not sufficiently strong to be used in clinical practice. This prospective study showed that though tempting by their simplicity, gait speed and maximum step length measured cross-sectionally cannot be used for predicting or anticipating upcoming falls.
Using a more reliable assessment of falls follow-up did not result in the same predictive values of gait speed as found in previous research [9, 11]. This study did confirm earlier findings that gait speed is better in predicting recurrent falls than first-time falls, and adding fall history to the model increases the predictive ability of gait speed [9, 12, 13]. However, since AUCs were not above the relevant 0.7 threshold, they still cannot be used in clinical practice. Future research into these cross-sectional predictions should therefore be discouraged.
Although several thresholds have been suggested for gait speed for different health outcomes [11], our findings, based on tertiles, did not give significant thresholds. However, the findings did show that a higher maximum step length at baseline resulted in a lower chance for falling compared with a median or lower maximum step length. These results are in accordance with the findings of Schulz et al. [26] who found that older fallers could not step as far as older non-fallers.
The current prospective study used a large, community-based sample of older subjects of which 93% successfully completed the one-year follow-up. Furthermore, all measurements at baseline were assessed using high-quality, standardised geriatric assessments. Another major strength of this study was the use of the FT system, which is a reliable and valid tool to prospectively record falls, and resulted in few missing data through the verification of falls by the research assistant [14, 15]. It also gave the ability to accurately document any fall-related injuries.
A limitation of this study was the selection bias caused by informed consent refusal and, more importantly, not being able to safely carry out maximum step length and gait speed, and not being able to use the FT system. The subsequent attrition of the frailest subjects, supported by lower frailty levels compared with other community-dwelling populations reported in literature [24], might indicate an underestimation of the predictive value of maximum step length and gait speed. However, our study group showed a fall history (34%) and percentage of fallers (39%) comparable with literature [27], and therefore, external validity should be confirmed.
The current study demonstrated that maximum step length and gait speed as simple mobility measurements are insufficient to predict fall risk. It remains to be studied whether repeated (self-)measurements of maximum step length and gait speed show better predictive values for falls and have clinical relevance for self-management in predicting increased fall risk, as we would wish that (pre-)frail older persons could do.
Maximum step length and gait speed are insufficiently valid in predicting fall risk and fall-related injuries.
Combining maximum step length or gait speed with fall history increases predictive value for falls and fall-related injuries.
A higher maximum step length at baseline results in a lower chance for falling compared with a median or lower maximum step length at baseline.
Conflicts of interest
The authors report no conflicts of interest. The authors alone are responsible for the content and writing of the paper.
Authors' contributions
K.T.J.B. and Y.S. contributed equally to the paper. K.T.J.B. interpretation of the data, literature review, and drafted the paper. Y.S. involved in design of the study, supervision of patient measurements, analysis and interpretation of the data, literature review, and drafted the paper. M.J.G. contributed to the analysis of the data. H.J.S. involved in the design of the study. R.J.M. involved in the design of the study and critically reviewed the paper. M.G.M.O.R. involved in design of the study, study supervision, interpretation of the data, and critically reviewed the paper.
Acknowledgements
We thank Joep Scheltinga for coordinating the FT system, and Janneke van Kempen for conducting the TOS-study.

Comments