


Abstract
People cope with relationship tensions in different ways. One such tension that is frequently reported is how adult children respond to conflicts with their aging parents when they see their parents as insisting, resisting, or persisting in their behaviors—acting in ways commonly attributed to stubbornness.
Middle-aged adults (N = 383) completed measures regarding their parents’ stubbornness, their responses to that stubbornness, depressive symptoms, positive and negative relationship quality, and support they provide their parents. Multiple regression and multilevel models were utilized to examine whether middle-aged offspring’s responses to perceived parent stubbornness were associated with the offspring’s reported depressive symptoms, positive and negative relationship quality, and provision of support.
Adult children most frequently endorsed responding to parents’ “stubborn” behaviors by “just letting their requests go.” Results revealed associations of adult children’s response strategies with their reports of depressive symptoms (more letting go), positive relationship quality (less letting go and more reasoning), negative relationship quality (more arguing, more rewording their request, and less reasoning), and the amount of support they provide to their parents (more arguing, more reasoning, and more waiting to address the concern another day).
Adult children’s responses to perceived parent stubbornness are linked to individual and relationship functioning, as well as the support the children provide. Interventions to develop adaptive responses when there are differences in goals may prove useful for families.
Family members provide support to one another across the life span. As individuals age, health declines and support is needed to maintain levels of everyday functioning (Baltes, Freund, & Li, 2005). Adult children often step in to providing such support. However, relying on others can become complicated, particularly if an older parent’s goals for daily life do not align with his/her child’s. Of particular interest are situations where there is a mismatch of goals between an older person and an adult child and the older adult is thought to insist, resist, or persist—acting in a way commonly attributed to stubbornness. Popular media (Kernisan, 2015) and recent empirical evidence (Heid, Zarit, & Fingerman, 2015; Heid, Zarit, & Van Haitsma, 2015) document the frequent occurrence of such behaviors, but little is known about how families respond to such behaviors and the implications of their responses.
Goal Conflicts in Relationships
Older adults and their adult children may experience differences in perspectives because parents are no longer able to do things for themselves, and children must help them (Birditt, Miller, Fingerman, & Lefkowitz, 2009; Fingerman, 1996). Adult children often experience increasing power in the relationship (Pyke, 1999). In such instances, children’s efforts to act on behalf of their parents may challenge parents’ own goals and preferences, resulting in relationship tension (Birditt, Miller et al., 2009). As one person acts to reach a goal, the other has to respond and accept or reject that action (Haley, 1963). If the older adult rejects the requested behavior, or goal of the child, (s)he may act, or be seen as acting resistively or with “stubbornness” (Heid, Zarit, & Fingerman, 2015). When a grown child views a parent as acting with “stubbornness,” the child may experience frustration, which may increase feelings of stress or strain, and impact the way children respond to parents. How children cope and respond may also affect relationship functioning and individual well-being (Heid, Zarit, & Fingerman, 2015).
Although the broader social relationship literature addresses dynamics of relationship conflict (Fingerman & Charles, 2010), interactions where an older adult is seen as insisting, resisting, or persisting are not well understood. This study takes an initial cross-sectional approach to examine the association of grown children’s responses to perceived parental stubbornness with children’s depressive symptoms, parent–child relationship quality, and the support children provide to parents.
Responses to Goal Conflict
Parental persistence in the face of conflicting goals may evoke a variety of responses from the child, as individuals cope differentially with stress and conflict (i.e., Folkman, Lazarus, Pimley, & Novacek, 1987). Researchers typically differentiate responses to interpersonal conflict along two dimensions (Rusbolt & Zembrodt, 1983). One dimension has a positive/negative valence, labeling behaviors as “constructive” or “destructive.” The other dimension refers to whether the partners are engaged and interact with one another or are not engaged. These dimensions are labeled “active” or direct and “passive” or indirect. The dimension of positive and negative valence is less relevant here, as responses to stubbornness could have either destructive or constructive effects. Parent “stubbornness” is a set of behaviors by the parent and adult child (Heid, Zarit, & Fingerman, 2015; Heid, Zarit, & Van Haitsma, 2015), where one person acts and the other reacts; therefore, coping responses on this second dimension of engagement are of particular interest. Grown children may respond directly to their parents’ behaviors or more indirectly (Birditt, Cichy, & Almeida, 2011; Fingerman, 1998), and these reactions may be associated with different qualities and behaviors in the relationship.
Research suggests that indirect or passive avoidant strategies are most frequently employed in responding to conflict with older adults (Fingerman & Charles, 2010); such indirect responses are beneficial for relationship functioning when the relationship ties are strong (Fingerman, 2001). Meanwhile direct or active response strategies have been linked to decreased solidarity and increased ambivalence in the relationship (Birditt, Rott, & Fingerman, 2009). However, prior studies have assessed general conflict in response to “annoyance” or “irritation” with a social partner. The context of “stubbornness” has not been addressed. Yet, conflicts of differential goals commonly attributed to “stubbornness” with an aging parent are described as frustrating (Kernisan, 2015) and represent potential power struggles between aging parents and adult children that likely carry unique implications for families.
Once a child perceives a parent as acting with stubbornness, this attribution may limit the child’s range of responses in ways that researchers who have studied conflict have not considered, or may result in behavioral coping responses that uniquely affect the parent–child relationship. For example, attributions of stubbornness are often made by an adult child when a parent is seen as resisting something in his/her best interests. Direct responses by the child to change the parent’s behavior may escalate this goal difference and be associated with negative relationship outcomes and decreased support. Meanwhile, avoidance might be associated with less stress/fewer depressive symptoms because relationship tensions do not increase, though the child may still be concerned about the parent’s “stubbornness.” The differential responses used by children may therefore be associated with their well-being or relationship quality, and/or the amount of support they provide to a parent (Merz, Consedine, Schulze, & Schuengel, 2009; Schwarz, Trommsdorff, Albert, & Mayer, 2005).
Other Factors Associated With Responses to Stubbornness
In examining the association of child coping responses to parent stubbornness with individual and relational well-being and support, we considered several covariates. Women are known generally to report higher levels of depression, distance is linked to the level of support delivered, and race has been linked to differential beliefs about parental support in later life (Fingerman et al., 2010; Fingerman, VanderDrift, Dotterer, Birditt, & Zarit, 2011). In addition, younger children or children with more health concerns may be less able to provide support to parents as they juggle competing needs. Indicators of the child’s socioeconomic status (i.e., education) may be associated with the resources available to a family to cope with tensions.
There may also be differences in how adult offspring navigate stubbornness with a parent depending upon the gender of the parent or the parent’s level of functional need. Beginning in childhood, mothers and fathers communicate differently with their children (Tomasello, Conti-Ramsden, & Ewert, 1990), and such gendered responses continue into adulthood (Willson, Shuey, & Elder, 2003). As a result, we examined child perceptions of and responses to parent stubbornness for mothers and fathers. For example, we might expect fathers to be perceived as more stubborn, whereas for mothers there may be a greater use of indirect strategies when stubbornness is perceived as children attempt to maintain emotional closeness (Fingerman, 1996). Additionally, level of parent functioning has been linked in prior work to the perception of stubbornness (Heid, Zarit, & Fingerman, 2015).
Overall, exploration of how offspring respond to perceived stubbornness of parents may help identify how people can deal with goal conflict to maximize parents’ and children’s well-being and functioning. If specific responses to perceived parent stubbornness are associated with negative individual and relationship functioning, interventions may be able to teach families to use more adaptive coping strategies to resolve goal differences.
The Present Study
This study sought to answer the research question: How are adult children’s direct and indirect responses to their aging parents’ “stubborn” behaviors associated with the child’s depressive symptoms, the parent–child relationship quality, or the amount of support offspring provide to their aging parent(s)? We hypothesized that higher reports of direct response strategies by adult children (i.e., getting upset, arguing with a parent, reasoning with a parent, and wording a request differently) when perceiving parent stubbornness would be associated with higher reports of depressive symptoms, higher negative and lower positive relationship quality, and lower support provided to parents. Conversely, higher reports of indirect response strategies by adult children that are less conflict provoking (i.e., letting their request go, getting someone else to convince a parent to do or not do something, and waiting and talking to parent another day) were expected to be associated with fewer depressive symptoms, higher positive and lower negative relationship quality, and greater support provided (Figure 1). No specific hypotheses were tested regarding parent gender, though we examine potential differential effects for responses to mothers and fathers.
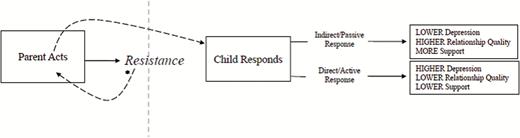
Hypothesized consequences of child response patterns to parents’ behaviors attributed to stubbornness. *Resistance refers to a conflict in care or relationship-based goals.
Methods
Participants and Procedures
The sample included middle-aged adults (aged 45–65 years; 169 men and 214 women) drawn from a larger pool of 490 middle-aged adults who participated in a second wave of the “The Family Exchanges Study” (FES2; see Fingerman et al., 2010 for details regarding Family Exchanges Study 1). These 490 adults represented 79% of the middle-aged adults who participated in Wave 1 of the study. Of these 490 individuals, 383 had at least one living parent and were selected for the current analysis. The middle-aged adults reported on a total of 494 living parents (171 fathers and 323 mothers). Participants in this subsample were significantly younger than those without living parents who also participated in FES2 [t(488) = 3.51, p < .001 M = 55.40 vs 57.27] and had slightly higher incomes [t(488) = −1.99, p = .05; M = 6.39 vs 5.75]. They did not differ from the larger FES2 sample with regard to gender, education, or race (see Table 1 for sample descriptives). Participants completed a telephone or web-based survey regarding their behaviors, feelings, and beliefs about family members. This study focused on everyday exchanges of supports within families rather than caregiving for a parent, per se.
Sample Demographics and Descriptives (N = 383 middle-aged adult children)
| n (%) | M (SD) | |
|---|---|---|
| Demographics and covariates | ||
| Gender (Female = 0, Male = 1) | 169 (44%) | — |
| Race (Non-White = 0, White = 1) | 257 (67%) | — |
| Age | — | 55.40(4.87) |
| Educationa | — | 3.32(1.11) |
| Incomeb | — | 6.39(2.81) |
| Physical healthc | — | 3.31(0.98) |
| Geographic distance from parent (miles)d | — | Mothers: 238.94(604.44) |
| Fathers: 231.80(454.93) | ||
| Parent disabilitye | — | Mothers: 1.38(1.43) |
| Fathers: 1.12(1.37) | ||
| Parent stubborn behaviorsf | — | Mothers: 6.15(3.93) |
| Fathers: 6.60(4.00) | ||
| Dependent variables | ||
| Child depressive symptoms | — | 1.49 (0.71) |
| Positive relationship quality | — | Mothers: 4.08(0.86) |
| Fathers: 3.78(1.06) | ||
| Negative relationship quality | — | Mothers: 2.02(0.83) |
| Fathers: 1.68(0.72) | ||
| Support provided | — | Mothers: 4.42(1.45) |
| Fathers: 3.49(1.54) |
Notes: N = 383 middle-aged adults.
aEducation was coded 1 (no high school) to 5 (post graduate).
bIncome was coded 1 (less than $10,000) to 12 ($250,001 or more).
cChild physical health was rated from 1 (poor) to 5 (excellent).
dDistance was log transformed (M = 1.25, SD = 1.02).
eAdult children rated four parent abilities coded as 0 (no) or 1 (yes) and totaled.
fFour behaviors were rated 0 (never) to 4 (always) and a total score was computed (range 0–16).
Measures
Demographics
Participants reported their age, race, gender, education, income, physical health, and geographic distance. We coded race 0 (minority) and 1 (White), gender 0 (female) and 1 (male), and education 1 (no high school) to 5 (post graduate). Income was coded 1 (less than $10,000) to 12 ($250,001 or more). Participants rated their physical health from 1 (poor) to 5 (excellent; Idler & Kasl, 1991). Distance was recorded in number of miles and log-linear transformed due to positive skew (Fingerman et al., 2010; see Table 1). All demographic variables were included as covariates in analyses to account for child differences on the associations tested.
Independent Measures
Parent Stubbornness Measure
An independent sample of middle-aged adults (N = 88) completed a pilot study of parental insistence, persistence, and resistance, that is, “stubbornness,” that resulted in the development of four-stem questions of occurrence of “stubborn” behaviors and 7 items about how adult children respond to such behaviors. Participants rated four behaviors from 0 (never) to 4 (always) separately for each living parent: “To what extent does your father/mother ever…”: (a) ignore suggestions or advice from you that would make his/her life better safer or easier, (b) ignore or refuse to do what his/her doctor tells him/her to do, (c) insist on doing things his/her own way even if it makes his/her life more difficult or unsafe, and (d) insist on doing things his/her own way even if it makes someone else’s life more difficult, inconvenienced, or unsafe. A total score was used in analyses (reports on mothers: α = .86; reports on fathers: α = .84; Heid, Zarit, & Fingerman, 2015) to account for the overall occurrence of stubbornness on dependent variables before examining the unique effects of response style.
If offspring endorsed occurrence of at least one “stubborn” behavior, they were asked to rate how often from 1 (never) to 5 (always) they used each of the seven possible responses. Offspring reported on four direct response strategies—getting upset, arguing with a parent, reasoning with a parent, and wording their request differently—and three indirect strategies—letting it go, trying to get someone else to convince a parent to do or not do something, and waiting and talking to a parent about it another day. The response items functioned as a “risk scale,” that is, each category represented a qualitatively different response to occurrences of stubbornness, and endorsement of one strategy reduced the likelihood of responding with another strategy. Both factor analysis and estimates of internal reliability of summary scores for total indirect and direct responses confirmed that items did not form an index of similar events that could be summed into a total score. Thus, response strategies were included as separate variables in the analyses. (Table 2)
Middle-aged Adult Children’s Responses to Parents’ Behaviors Attributed to Stubbornness
| Item | Mothers (n = 287) | Fathers (n = 150) | ||||||
|---|---|---|---|---|---|---|---|---|
| M (SD) | Range | Skew (SE) | Kurtosis (SE) | M (SD) | Range | Skew (SE) | Kurtosis (SE) | |
| Direct strategies | ||||||||
| To what extent does it bother or upset you…? | 2.85 (1.03) | 1–5 | 0.05 (0.14) | −0.29 (0.37) | 2.81 (1.02) | 1–5 | 0.21 (0.20) | −0.03 (0.40) |
| To what extent do you… | ||||||||
| …Get into an argument with him/her? | 1.82 (0.89) | 1–5 | 1.02 (0.14) | 0.52 (0.37) | 1.82 (0.96) | 1–5 | 1.23 (0.20) | 1.31 (0.40) |
| …Try to word your request differently? | 2.89 (0.94) | 1–5 | −0.08 (0.14) | 0.14 (0.37) | 2.89 (1.08) | 1–5 | −0.16 (0.20) | −0.29 (0.40) |
| …Try to reason with him/her? | 3.09 (0.94) | 1–5 | −0.18 (0.14) | 0.38 (0.37) | 3.03 (0.96) | 1–5 | 0.13 (0.20) | 0.04 (0.40) |
| Indirect strategies | ||||||||
| To what extent do you… | ||||||||
| …Wait and talk to him/her about it another day? | 2.67 (0.85) | 1–5 | −0.42 (0.14) | 0.21 (0.37) | 2.59 (0.96) | 1–5 | −0.14 (0.20) | −0.34 (0.40) |
| …Try to get someone else to convince your father/mother to do or not do something? | 2.48 (0.98) | 1–5 | 0.06 (0.14) | −0.31 (0.37) | 2.48 (1.03) | 1–5 | 0.18 (0.20) | −0.52 (0.40) |
| … Just let it go? | 3.45 (1.01) | 1–5 | −0.55 (0.14) | −0.24 (0.37) | 3.53 (1.08) | 1–5 | −0.60 (0.20) | −0.18 (0.40) |
Note: N = 383 middle-aged adults reporting on responses to stubbornness with 287 mothers and 150 fathers. All response strategies were rated from 1 (never) to 5 (always).
Parent Disability
Children rated parents’ abilities regarding four activities of daily living (e.g., Does s/he need help with personal care such as bathing and dressing?) as 0 (no) or 1 (yes). Responses were totaled; higher values indicated greater disability (α = .78 for reports on fathers and mothers; Bassett & Folstein, 1991).
Dependent Measures
Depressive Symptoms
Depressive symptoms were assessed utilizing six items of the Brief Symptom Inventory (BSI; Derogatis & Melisarator, 1983). Individuals indicated how much the following problems distressed or bothered them during the past 7 days: feeling lonely, blue, no interest in things, hopeless about the future, worthlessness, and depressed rated from 1 (not at all) to 5 (extremely) and combined as a mean-item score (α = .90).
Positive Relationship Quality
Participants answered two questions about positive relationship quality with each parent (e.g., how much does your father/mother understand you) on a scale of 1 (not at all) to 5 (a great deal; Fingerman, Chen, Hay, Cichy, & Lefkowitz, 2006). A mean-item score was created (reports on mothers: α = .68; reports on fathers: α = .78).
Negative Relationship Quality
Participants answered four questions about negative relationship quality with each parent (e.g., how much does your father/mother criticize you) from 1 (not at all) to 5 (a great deal; Fingerman et al., 2006). A mean-item score was created (mothers: α = .70; fathers: α = .73).
Support Provided
Participants completed the Intergenerational Support Scale (Fingerman et al., 2010) regarding the frequency of support they provide to each of their parents. The scale consisted of the mean-item score of six items (i.e., emotional support, practical support) rated 1 (less than once a year or not at all) to 8 (daily; mothers: α = .86; fathers: α = .87).
Analyses
Analyses examined the association of behavioral responses reported by middle-aged adult children when they perceive their parent(s) acting with stubbornness with individual and relationship-based constructs (depressive symptoms, positive and negative relationship quality, and provision of support). First, we calculated descriptive statistics for all variables, continuous variables were mean centered, and correlations among variables were assessed. Second, to address our hypothesis for depressive symptoms, hierarchical multiple linear regression was utilized to examine the association of demographic and response variables with adult child depressive symptoms. Two models were estimated, one for adult child reports of responses to mother’s stubbornness and one for adult child responses to father’s stubbornness. For the other three dependent variables tested (i.e., positive relationship quality, negative relationship quality, and provision of support), multilevel models were utilized to account for the fact that these variables were reported for both mothers and fathers by a shared reporter (middle-aged adult child; SAS PROC MIXED; Singer & Willett, 2003). Multilevel modeling accounts for variance at Level 1 (within-person) and Level 2 (the average within-person effects or the between-person; Kenny, Kashy, & Cook, 2006).
A series of models was completed for (i) positive relationship quality, (ii) negative relationship quality, and (iii) provision of support. First, an unconditional means model with no predictors was conducted to examine the amount of within-person and between-person variance explained in each dependent variable. The variances attributed to similarities within families were as follows: (i) 27% for positive relationship quality, (ii) 10% for negative relationship quality, and (iii) 10% for support provided. Second, parent status was entered into the Level 1 equation to account for differences in adult child’s responses to mothers’ versus fathers’ behaviors. Mother was coded as −1 and father was coded as 1, such that 0 represented the mean level report across family (Model 1). Third, demographic variables and covariates were then entered into the models to account for the association of each with each dependent variable before modeling the association of response strategies (Model 2). These models included constructs at the within-family (within-person) level—geographic distance, prevalence of parent stubbornness, and parent disability—and the between-family (between-person) level—age, race, gender, physical health, and education. Model 2 for each dependent variable also included an interaction of stubborn behaviors with parent status (mother or father) to account for the differential effects depending upon whether the reports were about mothers or fathers.
Fourth, to directly test our hypotheses, response styles (i.e., upset, let go, argue, reason, reword, wait, and get someone else) were entered into the model at Level 1. Interaction effects across parent status (mother or father) were again included to account for the differential effects of response strategies on the dependent variables by parent. Only significant interactions were retained (p < .10). Our models were specified with a heterogeneous compound symmetry variance structure, which allows for heterogeneity in variance across the members of the dyad (Kenny et al., 2006). Model fit statistics were noted after each model to ensure improved fit.
To ease interpretation of interactions, post hoc tests were conducted with multilevel models to examine the effects for mothers and fathers separately by re-running the final model for each dependent variable with an estimate statement for each significant interaction. This provided p values for child reports on each parent to determine whether a given interaction effect was significant for reports on mothers, fathers, both, or neither.
Results
Ninety-one percent of adult children endorsed parent stubbornness occurring for at least one parent and reported at least one response strategy used. Adult children endorsed responding to their parents’ behaviors commonly attributed to stubbornness in direct and indirect ways. The most frequently reported strategy was just letting their own requests go (Table 2).
Tables 3 and 4 display the associations between response strategies and each of the dependent variables—child depressive symptoms, positive relationship quality, negative relationship quality, and support provided. First, the models account for the association of child, parent, and relationship-based characteristics with the dependent variables. Lower child health was associated with greater depression for children when reporting on mothers or fathers, as well as more negative relationship quality. Child race (non-Hispanic white) was associated with greater negative relationship quality. Closer proximity and greater parent disability were related to more support provided. In addition, higher levels of perceived parent stubborn behaviors were positively associated with lower positive relationship quality, more negative relationship quality (for mothers only, B = 0.08, p <. 001), and less support.
Multiple Regression Examining Adult Child Responses to Parent Behaviors Attributed to Stubbornness and Adult Child Reports of Depressive Symptoms
| Variables | Responses to mothers | Responses to fathers | ||||||||||
|---|---|---|---|---|---|---|---|---|---|---|---|---|
| Model 1 | Model 2 | Model 1 | Model 2 | |||||||||
| B | SEB | β | B | SEB | β | B | SEB | β | B | SEB | β | |
| Intercept | 1.42*** | 0.09 | — | 1.46*** | 0.09 | — | 1.36*** | 0.12 | — | 1.38** | 0.12 | — |
| Step 1 | ||||||||||||
| Child age | 0.00 | 0.01 | 0.01 | 0.00 | 0.01 | 0.01 | 0.00 | 0.01 | 0.01 | 0.00 | 0.01 | 0.02 |
| Child race (Non-White = 0) | 0.12 | 0.10 | 0.08 | 0.06 | 0.10 | 0.04 | 0.18 | 0.13 | 0.12 | 0.16 | 0.14 | 0.10 |
| Child gender (Female =0) | −0.00 | 0.09 | −0.00 | 0.02 | 0.09 | 0.01 | −0.07 | 0.12 | −0.04 | −0.07 | 0.12 | −0.05 |
| Child educationa | −0.07 | 0.04 | −0.11 | −0.06 | 0.04 | −0.09 | −0.10 | 0.06 | −0.15 | −0.11 | 0.06 | −0.17 |
| Child healthb | −0.20*** | 0.05 | −0.27 | −0.21*** | 0.05 | −0.28 | −0.25*** | 0.06 | −0.34 | −0.25*** | 0.06 | −0.34 |
| Distancec | 0.02 | 0.04 | 0.03 | 0.02 | 0.04 | 0.03 | −0.00 | 0.06 | −0.00 | 0.01 | 0.06 | 0.01 |
| Parent disabilityd | −0.02 | 0.03 | −0.04 | −0.01 | 0.03 | −0.02 | 0.05 | 0.04 | 0.09 | 0.05 | 0.05 | 0.11 |
| Stubborn behaviorse | 0.01 | 0.01 | 0.04 | −0.02 | 0.02 | −0.10 | 0.02 | 0.02 | 0.08 | 0.03 | 0.02 | 0.16 |
| Step 2 | ||||||||||||
| Direct response strategiesf | ||||||||||||
| Child gets upset | — | — | — | 0.08 | 0.06 | 0.11 | — | — | — | −0.06 | 0.08 | −0.09 |
| Child argues | — | — | — | 0.08 | 0.06 | 0.09 | — | — | — | −0.06 | 0.07 | −0.08 |
| Child re-words request | — | — | — | 0.00 | 0.05 | 0.00 | — | — | — | 0.06 | 0.06 | 0.10 |
| Child reasons | — | — | — | −0.04 | 0.05 | −0.06 | — | — | — | −0.10 | 0.07 | −0.14 |
| Indirect response strategies | ||||||||||||
| Child waits | — | — | — | 0.02 | 0.06 | 0.03 | — | — | — | 0.02 | 0.07 | 0.02 |
| Child goes to someone else | — | — | — | 0.00 | 0.05 | 0.01 | — | — | — | −0.00 | 0.07 | −0.01 |
| Child lets go | — | — | — | 0.13** | 0.05 | 0.17 | — | — | — | −0.06 | 0.06 | −0.09 |
| R2 | .09 | .13 | .17 | .20 | ||||||||
| ∆R2 | — | .04 | — | .03 | ||||||||
| F | 3.24** | 2.58*** | 3.31** | 2.07* | ||||||||
Notes: Models were run on middle-aged adult children’s responses to 287 (of 323 total) mothers and n = 150 (of 171 total) fathers who had complete data on all variables on interest.
aEducation was coded 1 (no high school) to 5 (post graduate).
bChild physical health was rated from 1 (poor) to 5 (excellent).
cDistance was log transformed (M = 1.25, SD = 1.02).
dAdult children rated four parent abilities coded as 0 (no) or 1 (yes) and totaled.
eFour behaviors were rated 0 (never) to 4 (always) and a total score was computed (range 0–16).
fAll response strategies were rated from 1 (never) to 5 (always). All nondichotomous predictor variables were mean centered for analyses to ease interpretation.
*p < .05. **p < .01. ***p < .001.
Multilevel Modeling Examining Adult Child Responses to Parent Behaviors Attributed to Stubbornness and Adult Child Reports of Relationship Quality and Support Provided
| Positive relationship quality | Negative relationship quality | Support provided | ||||||||||||||||
|---|---|---|---|---|---|---|---|---|---|---|---|---|---|---|---|---|---|---|
| Model 1 | Model 2 | Model 3 | Model 1 | Model 2 | Model 3 | Model 1 | Model 2 | Model 3 | ||||||||||
| B | SE | B | SE | B | SE | B | SE | B | SE | B | SE | B | SE | B | SE | B | SE | |
| Fixed effect | ||||||||||||||||||
| Intercept | 3.91*** | 0.05 | 4.27*** | 0.46 | 4.44*** | 0.47 | 1.85*** | 0.04 | 2.47*** | 0.39 | 2.30*** | 0.40 | 3.97*** | 0.07 | 4.39*** | 0.75 | 5.19*** | 0.75 |
| Parent (mother vs father) | −0.16*** | 0.04 | −0.011 | 0.04 | −0.08* | 0.04 | −0.17*** | 0.03 | −0.16*** | 0.03 | −0.15 | 0.04 | −0.46*** | 0.07 | −0.46*** | 0.06 | −0.47*** | 0.06 |
| Controls (between-family) | ||||||||||||||||||
| Child race (non-White =0) | — | — | −0.03 | 0.09 | −0.02 | 0.09 | — | — | −0.20** | 0.07 | −0.30*** | 0.08 | — | — | 0.19 | 0.14 | −0.24 | 0.14 |
| Child age | — | — | −0.01 | 0.01 | −0.01 | 0.01 | — | — | −0.01 | 0.01 | −0.00 | 0.01 | — | — | −0.00 | 0.01 | −0.01 | 0.01 |
| Child gender (Female = 0) | — | — | 0.11 | 0.08 | 0.10 | 0.08 | — | — | −0.05 | 0.07 | −0.05 | 0.07 | — | — | −0.16 | 0.13 | −0.21 | 0.13 |
| Child educationa | — | — | 0.02 | 0.04 | 0.04 | 0.04 | — | — | 0.01 | 0.03 | 0.00 | 0.03 | — | — | 0.02 | 0.06 | 0.03 | 0.06 |
| Child healthb | — | — | 0.05 | 0.04 | 0.05 | 0.04 | — | — | −0.09* | 0.04 | −0.09* | 0.04 | — | — | −0.03 | 0.07 | −0.06 | 0.07 |
| Controls (within-family) | ||||||||||||||||||
| Geographic distancec | — | — | −0.04 | 0.04 | −0.05 | 0.04 | — | — | −0.08* | 0.03 | −0.06 | 0.03 | — | — | −0.68*** | 0.06 | −0.64*** | 0.06 |
| Parent disabilityd | — | — | −0.03 | 0.03 | −0.02 | 0.03 | −0.03 | 0.02 | −0.05 | 0.03 | — | — | 0.15*** | 0.04 | 0.19*** | 0.04 | ||
| Stubborn behaviorse | — | — | −0.07*** | 0.01 | −0.08*** | 0.01 | — | — | 0.08*** | 0.01 | 0.06*** | 0.01 | — | — | 0.01 | 0.02 | −0.06* | 0.02 |
| Parent * Stubborn | — | — | 0.03** | 0.01 | 0.01 | 0.01 | — | — | −0.02* | 0.01 | −0.02* | 0.01 | 0.01 | 0.02 | 0.01 | 0.02 | ||
| Within-family effectsf | ||||||||||||||||||
| Direct response strategies | ||||||||||||||||||
| Child gets upset | — | — | — | — | −0.01 | 0.05 | — | — | — | — | 0.02 | 0.04 | — | — | — | — | 0.01 | 0.07 |
| Child argues | — | — | — | — | −0.06 | 0.05 | — | — | — | — | 0.24*** | 0.04 | — | — | — | — | 0.15* | 0.07 |
| Child re-words request | — | — | — | — | −0.06 | 0.04 | — | — | — | — | 0.09* | 0.04 | — | — | — | — | 0.10 | 0.07 |
| Child reasons | — | — | — | — | 0.22*** | 0.054 | — | — | — | — | −0.09* | 0.04 | — | — | — | — | 0.15* | 0.07 |
| Parent * Child reasons | — | — | — | — | 0.12** | 0.04 | — | — | — | — | −0.07 | 0.04 | — | — | — | — | — | — |
| Indirect response strategies | ||||||||||||||||||
| Child waits | — | — | — | — | 0.08 | 0.05 | — | — | — | — | 0.02 | 0.04 | — | — | — | — | 0.29*** | 0.08 |
| Child goes to someone else | — | — | — | — | 0.05 | 0.04 | — | — | — | — | −0.03 | 0.04 | — | — | — | — | −0.10 | 0.07 |
| Child lets go | — | — | — | — | −0.10** | 0.04 | — | — | — | — | 0.01 | 0.04 | — | — | — | — | −0.05 | 0.06 |
| Parent * Child lets go | — | — | — | — | — | — | — | — | — | — | — | — | — | — | — | — | 0.14* | 0.06 |
| Random effect | ||||||||||||||||||
| Var (1)g | 0.74*** | 0.06 | 0.52*** | 0.04 | 0.53*** | 0.05 | 0.68*** | 0.05 | 0.46*** | 0.04 | 0.44*** | 0.04 | 2.10*** | 0.17 | 1.51*** | 0.13 | 1.33*** | 0.12 |
| Var (2) | 1.14*** | 0.13 | 0.92*** | 0.11 | 0.65*** | 0.08 | 0.51*** | 0.06 | 0.46*** | 0.05 | 0.47*** | 0.06 | 2.39*** | 0.26 | 1.75*** | 0.20 | 1.48*** | 0.18 |
| CSH | 0.35*** | 0.09 | 0.33** | 0.10 | 0.41*** | 0.12 | 0.18 | 0.10 | 0.03 | 0.10 | −0.03 | 0.11 | 0.21* | 0.10 | 0.33*** | 0.10 | 0.40*** | 0.10 |
| −2 Log likelihood | 1,310.7 | 1,118.3 | 993.2 | 1,164.8 | 994.3 | 919.2 | 1,791.0 | 1,530.9 | 1,346.4 | |||||||||
| AIC | 1,316.7 | 1,124.3 | 999.2 | 1,170.8 | 1,000.3 | 925.2 | 1,797.0 | 1,536.9 | 1,352.4 | |||||||||
Notes: N = 383, reports on n = 323 mothers and n = 171 fathers. Each analysis used available data for each dependent variable. Model 3 tested the interaction effect of Parent * (variable) for all within-person variables; nonsignificant effects were removed.
aEducation was coded 1 (no high school) to 5 (post graduate).
bChild physical health was rated from 1 (poor) to 5 (excellent).
cDistance was log transformed.
dAdult children rated four parent abilities coded as 0 (no) or 1 (yes) and totaled.
eFour behaviors were rated 0 (never) to 4 (always) and a total score was computed (range 0–16).
fAll response strategies were rated from 1 (never) to 5 (always). All nondichotomous predictor variables were mean centered for analyses to ease interpretation.
gHeterogeneous compound symmetry variance structure estimating parameters for each diagonal element.
*p < .05. **p < .01. ***p < .001.
Second, the models illustrate that how adult children responded to their parents’ stubbornness was associated with both individual and relationship-based constructs. Regarding indirect response strategies, results demonstrated effects on depression, positive relationship quality, and support provided. Specifically, when reporting on responses to mothers’ stubbornness, children who reported letting their requests go reported higher levels of depressive symptoms (B = 0.13; see Table 3). Those who reported more letting go also reported lower positive relationship quality (B = −0.10; see Table 4). Regarding direct response strategies, analyses revealed effects on positive relationship quality, negative relationship quality, and support provided. Adult children who reported more reasoning reported higher positive relationship quality (B = 0.22), less negative relationship quality (B = −0.09), and more support provided (B = 0.15). In addition, adult children who reported more rewording of their requests (B = 0.09) or more arguing (B = 0.24) reported more negative relationship quality. More arguing was also associated with higher levels of support provided (B = 0.15; see Table 4).
Third, post hoc analyses revealed differential effects of response strategies on the tested dependent variables depending upon whether adult children were reporting on fathers or mothers. Although a negative effect of letting go was found for child depressive symptoms when reporting on responses to mothers, no response strategies were significantly associated with child depressive symptoms for responses to fathers (Table 3). For reasoning, the positive effect on relationship quality was found for reports on fathers only (B = .34, p < .001). Further, although there was not a main effect for adult children’s responses of letting go on support provided, there was a significant interaction effect by parent with more letting go linked to less support provided for mothers only (B = −0.19, p = .01; Table 4).
Discussion
The results of this study demonstrate three primary findings: (i) when adult children perceive their parents as acting in ways commonly attributed to stubbornness, they respond in both direct and indirect ways; (ii) adult children’s responses to parents’ stubborn behaviors are linked to individual and relationship-based functioning; and (iii) the response styles used by children may have differential associations with their relationships and own well-being depending upon which parent they are responding to—mothers or fathers. These findings carry several implications for research and practice.
Adult children endorse use of various coping strategies when encountering parent “stubborn” behaviors. Consistent with prior research, children reported trying more than one of these, but most commonly endorsed “just letting it go” (Fingerman & Charles, 2010). In addition after controlling for the frequency of perceived stubbornness by parents and associations with other demographic characteristics, coping response strategies were associated with both individual and relationship-based constructs (Birditt, Rott, et al., 2009). The way an adult child responds matters. At least one response strategy was significantly associated with each of the dependent variables of depressive symptoms, positive and negative relationship quality, and support provided.
The results here expand our understanding of the association of direct and indirect responses in the context of perceived parent stubbornness with individual and relationship-based functioning for adult children. Contrary to our hypothesis, where we suspected that less reactive, passive, approaches would be associated with fewer depressive symptoms and better relationship quality, we found instead that more letting go was linked to more child depression and less positive relationship quality. These findings may reflect that avoiding the issue leads to internalizing the distress. Prior work supports this notion. Younger adults who avoid an argument experience as much emotional reactivity as having an argument (Charles, 2010). In this context, “letting it go” may proxy as an “exit strategy” that removes adult children from conflict but leaves them ruminating about the interaction. Internalizing of conflict is a frequent antecedent of depressive symptoms.
We also see that indirect strategies of letting go and waiting were associated with levels of support provided—more letting go was linked to less support (mothers only), and more waiting was linked to more support. It may be that in giving support middle-aged adults cannot as readily avoid the conflict in goals with parents and cannot let go as frequently. While not a caregiving sample, previous research has demonstrated that families caring for someone with Alzheimer’s disease who used positive conflict resolution methods provided more help than families not using such strategies (Lieberman & Lawrence, 1999). It could be the lack of resolution evoked from the response of the child’s indirect strategies is what matters most and results in the associations found here.
Regarding direct response strategies, more arguing and rewording were linked to more negative relationship quality. These direct confrontational strategies may be increasing the negative sentiments within the relationship as they inherently imply less compromise or collaboration. The mitigation of such strategies when there are differences in goals may reduce negative relationship quality. Or, it may be those that have poorer relationship quality are more likely to use such strategies—decreasing negativity in the relationship may in turn reduce the use of direct confrontational strategies. In addition, we see positive effects of reasoning on relationship quality and support provided. Reasoning implies a rational discussion of needs, wants, or values. In fact, the use of direct conversation has been perceived as more effective for addressing older adults’ problem behaviors in past research (Morgan & Hummert, 2000) and therefore may carry positive implications here as well. The use of reasoning in conversation may keep relationships open to exchanging more support or for fathers it may improve the relationship overall.
More arguing was also linked to more support being provided. In this case it could be that children providing support to parents are interacting more, which could lead to greater engagement when conflict. Similarly, providing support may be stressful, resulting in more tension leading to arguments. Or, arguing may proxy for an emotional investment in the relationship whereby ideas are hashed out rather than simply let go. Further, not captured here is the sequence of responses utilized that is associated with each dependent construct. For example, if a child always argues first and then just lets the tension go, it might result in differential effects as opposed to someone who lets a conflict fester until it reaches a certain intensity and then argues about it. Both instances would result in high rates of use of these response strategies (Heid, Zarit, & Van Haitsma, 2015). Further work should determine whether it is a single response, a pattern of responses employed by an adult child, or the resolution evoked that has the strongest effect on personal and relationship well-being. In addition, further work should consider the potential bidirectionality of effects as depression, relationship functioning, or delivery of support may predispose a child to respond in a particular way.
Findings also highlight differential effects when a child is responding to a mother versus a father, regardless of child gender. We see a negative effect for letting go on child’s depression and support provided with mothers, but no effects for fathers. This may be due to the unique emotional ties children have with mothers (Fingerman, 1996). We also see a stronger effect of reasoning on positive relationship quality and support provided for fathers with more reasoning linked to higher levels of both constructs. Consistent with traditional gendered roles, it may be that fathers respond better to the use of direct approaches such as reasoning when there is conflict as opposed to indirect, passive approaches.
Overall, these results are consistent with findings that suggest the importance of intervening at the level of the relationship to bring about positive changes (i.e., Berg & Upchurch, 2007; McGilton, 2002; Shellenberger, Watkins, & Drake, 1989). Dyadic-based interventions can improve quality of life, family communication (Logsdon et al., 2010), and mental health (Martire, Lustig, Schulz, Miller, & Helgeson, 2004). Adult children are often called on to serve as advocates of aging parents, particularly as parents’ needs increase and sense of autonomy is challenged in late life (Baltes, 1995). The findings here indicate that how children respond to parents in the face of goal conflict in daily life is linked to resources that affect provision of support and the actual provision of that help. Adaptive interventions that design clinical support around each family’s (i.e., dyad’s) unique risk factors and concerns may help them learn how to better navigate goal conflicts in relationships, developing response strategies that work for their own family unit where a parent (mother or father) is perceived to act with stubbornness (Zarit, Femia, Kim, & Whitlatch, 2010). Interventions may prove particularly useful in helping families mitigate the negative effects of response strategies or improve the relationship dynamics overall. Early intervention may be particularly valuable in allowing families to sort out conflict before parents need extensive assistance.
This study is not without limitation. Though the initial sample was a randomized probability sample, the sample that completed this survey was willing to take part in a longitudinal investigation regarding family support exchanges. Second, the primary predictors (response strategies) were single-item constructs. Developing multi-item scales for each response, strategy may improve statistical inference. Third, the response strategies were generated from a pilot study, but adult offspring may utilize additional strategies in response to parent stubbornness. An open-ended option would allow for examination of possible missed, salient constructs. Fourth, reports here are retrospective and ask about general behaviors. More could be learned from studying patterns of behaviors over time, in specific situational contexts, and in regard to different types of stubborn behaviors. Finally, this study focused on adult children’s perceptions of their parents’ behaviors and their perceptions of their own responses. More could be learned from collecting reports on responses from parents as well.
Overall, despite limitations, these findings demonstrate that adult children’s responses to perceived parental stubbornness are linked to individual and relationship-based functioning, as well as the support they provide to their aging parents. These findings are unique in the literature. They contribute to our understanding of how adult children and parents interact on a day-to-day basis. Future work can provide insight on practical strategies for helping older adults and their adult children around issues of conflict in daily goals.
Funding
This study was supported by grants from the National Institute on Aging, R01AG027769 The Family Exchanges Study II (Karen Fingerman, principal investigator), and a grant from the MacArthur Foundation Research Network on an Aging Society (Jack Rowe, Network Director). The content is solely the responsibility of the authors and does not necessarily represent the official views of the National Institutes Health or the MacArthur Foundation.
References
Idler, E. L., & Kasl, S. (1991). Health perceptions and survival: do global evaluations of health status really predict mortality? Journals of Gerontology, 46, S55–S65.
Author notes
*Address correspondence to Allison R. Heid, PhD, New Jersey Institute for Successful Aging, Rowan University School of Osteopathic Medicine, 42 E. Laurel Road, Stratford NJ 08084. E-mail: allisonrheid@gmail.com
Decision Editor: Suzanne Meeks, PhD

