


Abstract
Quality improvement (QI) is a key strategy for improving diabetes care in low- and middle-income countries (LMICs). This study reports on a diabetes QI project in rural Guatemala whose primary aim was to improve glycemic control of a panel of adult diabetes patients.
Formative research suggested multiple areas for programmatic improvement in ambulatory diabetes care.
This project utilized the Model for Improvement and Agile Global Health, our organization's complementary healthcare implementation framework.
A bundle of improvement activities were implemented at the home, clinic and institutional level.
Control charts of mean hemoglobin A1C (HbA1C) and proportion of patients meeting target HbA1C showed improvement as special cause variation was identified 3 months after the intervention began. Control charts for secondary process measures offered insights into the value of different components of the intervention. Intensity of home-based diabetes education emerged as an important driver of panel glycemic control.
Diabetes QI work is feasible in resource-limited settings in LMICs and can improve glycemic control. Statistical process control charts are a promising methodology for use with panels or registries of diabetes patients.
Quality Issue
Quality improvement (QI) is a key element of strengthening health systems and improving diabetes care in low- and middle-income countries (LMICs) [1, 2]. Statistical process control (SPC) is a set of powerful QI methods—which include the use of control charts—that can detect statistical changes in a healthcare process earlier than traditional research methodologies, including during the testing phase of an intervention [3]. There have been limited published applications of control charts in resource-limited settings or with diabetes panels [4].
Globally, >400 million people live with diabetes [5]. Approximately 75% of people with diabetes live in LMICs where quality chronic disease management is frequently unavailable [6]. In this study, we report on a small primary care QI project in rural Guatemala whose primary aim was to improve glycemic control in patients with Type 2 diabetes.
Initial assessment
Context
Wuqu' Kawoq | Maya Health Alliance is a non-governmental organization delivering primary healthcare in indigenous Maya areas in rural Guatemala. The organization's diabetes program was created in 2010 and serves ~160 adults with Type 2 diabetes. Our clinical program is described in detail elsewhere [7].
Formative research
In 2012, we conducted a needs assessment of diabetes care in rural Guatemala [8], which suggested several areas for improvement. First, diabetes patients generally had limited health literacy on topics including the natural history of the disease, the role of diet and lifestyle, and prevention of common complications. Second, due to economic difficulties and health system shortcomings, diabetes patients often sought care at multiple health facilities and lacked care continuity. Third, patients’ family members played a pivotal role in supporting dietary choices and medication adherence. Fourth, patients expressed strong preference for Mayan-language care delivery. Finally, group-based sessions emerged as a strategy to foster diabetes self-management and reduce patients’ perceptions of social isolation.
Choice of solution
Framework of improvement
This project utilized the Model for Improvement [9] and Agile Global Health, [10] our organization's complementary healthcare implementation framework that emphasizes program flexibility, field experience for program managers, patient input into design and implementation elements, and cycles of improvement analogous to Plan, Do, Study, Act cycles. The theory of change for the intervention was visualized in a key driver diagram [9] in Fig. 1.
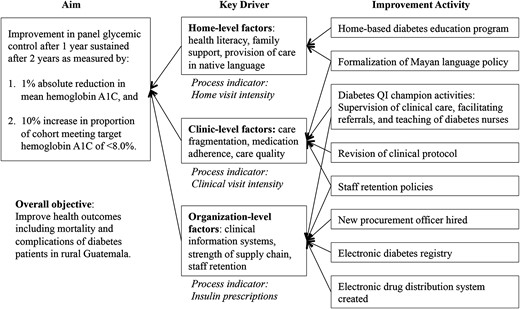
Key driver diagram for diabetes QI in rural Guatemala. Primary drivers for the diabetes QI project were conceptualized at the Home, Clinic and Organizational levels. Improvement activities were structured to address each level.
Improvement team
In October 2013, a diabetes improvement team was formed consisting of the institution's chief medical officer, diabetes coordinator, clinical diabetes nurse, and diabetes educators.
Implementation
Improvement activities
The QI intervention, which began in October 2013, addressed key drivers drawn from formative research.
Interventions targeting home-level drivers
The primary activity at the home level was the implementation of a diabetes education program for patients and family members. We previously had adapted a well-known Latino chronic disease curriculum for use in Mayan-speaking populations [11], and in October 2013 we initiated group-based education sessions. However, despite formative research on the feasibility of group education, actual attendance at group sessions was very low. In May 2014, therefore, we re-launched our education intervention as a home-visit program delivered by a nurse educator consisting of eight sessions over 1 year. The group-based curriculum was revised to encourage family participation, emphasize dietary and lifestyle aspects, and incorporate motivational interviewing techniques. Any patient with hemoglobin A1C (HbA1C) >8.0%, insulin prescription, or diabetes-related end-organ disease was targeted for these home visits.
Interventions targeting clinic-level drivers
In October 2013, we created and filled the position of diabetes coordinator, who managed the panel, expedited subspecialty referrals, and delivered training to diabetes nurses. Next, in June 2014, the institution's diabetes protocol was revised to place a stronger emphasis on insulin-based therapy and to promote monthly clinic visits for improved continuity of care for complex or uncontrolled patients [7]. At this time, language policies were also formalized to mandate care delivery in Mayan languages when applicable. Finally, retention of diabetes ground-level staff (clinical nurses and diabetes educators) became a potentially critical problem due to staff burnout. In September 2014, we implemented a package of retention strategies including salary increases, flexible work arrangements and formal professional development opportunities.
Interventions targeting organization-level drivers
Three activities were most important at this level. First, in March 2014, an electronic diabetes registry was created to track individual patient data in real time, display trends in cohort-level control, and provide clinical reminders to providers. Simultaneously, we instituted monthly diabetes panel reviews in which members of the QI team discussed each patient's data and care plan. In July 2014, our institution hired a pharmaceutical procurement specialist and implemented a new electronic drug distribution system. The new procurement officer and distribution system together were intended to reduce supply chain failures—especially for insulin—and free up clinical staff from responsibilities relating to medicine distribution.
Evaluation
Sample
This QI project was carried out with all 160 adult type 2 diabetes patients served in the diabetes program. The analytic sample for this study was comprised of patients with at least one clinical encounter in the 12 months prior to the beginning of the intervention (Q4 2013; n = 64) who remained active in care (Q1 2016; n = 56). This sampling decision permitted evaluation of the impact of the QI project on long-term patients under active management for whom sufficient baseline clinical data were available. Among the eight patients in the eligible sample who were dropped from the analysis due to lack of longitudinal data, two had abandoned care in the 12 months prior to the launch of the QI program and six were lost to follow-up after the launch. There were no statistically significant differences in gender, age or community location between those who dropped out and those retained; however, baseline HbA1C was higher in patients who dropped out (9.1 ± 2.1% vs. 11.6 ± 2.2%, P = 0.002).
Measures
The primary outcome measure was glycemic control as defined by mean HbA1C and proportion of patients meeting target HbA1C. In this study and in our clinical work, we aim for HbA1C <8.0% [7], which is a less strict goal than that endorsed in many major clinical guidelines but similar to that employed by others delivering diabetes care in similar resource-limited settings [12]. We justify our target as appropriate to our context given the high risk of severe hypoglycemia in rural Guatemalan towns with limited access to emergency services.
Secondary measures were process indicators we considered proxies for each key driver (Fig. 1). At the home and clinic level, we measured visit intensity as defined by the mean number of visits in each setting per patient quarter. At the organization level, we considered insulin use to be a proxy for overall institutional capacity (as well as, given the psychological and cultural barriers to insulin use [13], a marker for the acceptability to patients of offered services), and we assessed the proportion of patients with insulin prescriptions.
Data collection and analysis
Diabetes program data were collected and stored in our electronic medical record, OpenMRS (http://openmrs.org/), and extracted by two independent data coders. We used Stata version 13 (College Station, TX) to generate descriptive statistics for baseline patient characteristics. We used Minitab version 17 (State College, PA) to construct control charts as detailed below.
Control charts
Control charts are the primary tool of SPC and permit analysis of process data [14]. In SPC, ‘common cause variation’ refers to the natural variation in a system, while ‘special cause variation’ refers to changes in the system unlikely to be due to chance alone. Special cause in SPC replaces statistical significance in traditional statistics; it is identified by comparing the evolution of data over time with baseline system performance, typically defined by a baseline mean value and its surrounding ‘control limits’ [3]. Control charts have been used in a variety of health settings [15].
We created three complementary control charts of panel glycemic control: an X-bar and S chart of mean HbA1C, a P chart of the proportion of patients meeting target HbA1C, and a cumulative sums (CUSUM) chart of mean HbA1C. X-bar and S and P charts permit underlying data of variable subgroup sizes, which is an important feature of longitudinal diabetes program evaluation, as HbA1C values are typically not available for all patients during each period. The CUSUM chart was selected to assess for cumulative improvement of panel performance as each data point incorporates information from prior time periods [14]. Secondary process measures were assessed via X-bar and S charts for mean home and clinic visits per quarter and a P chart for the proportion of patients receiving insulin prescriptions each quarter.
For all of the control charts, we followed methods well established in the literature for identifying special cause variation. First, we used the first 12 data points to generate the baseline mean. For our data set, this included 10 quarters of pre-intervention data and two data points that overlapped with the intervention (2013 Q4 and 2014 Q1). The reference line for the CUSUM chart was the mean HbA1C during the baseline period. We applied the following criteria to identify special cause variation [14]: (i) a single point outside control limits, (ii) a run of eight or more points in a row above or below the baseline, (iii) six consecutive points increasing or decreasing and (iv) two of three consecutive points near a control limit. For the CUSUM chart, we utilized Rule 1 and visual analysis only.
Sensitivity analysis
A challenge of assessing improvement in panel quarterly mean HbA1C with control charts is that individuals with better or worse disease control may be monitored at a different frequency in the intervention period relative to the baseline period. If differential monitoring occurs, the detection of special cause in a control chart may not reflect true changes in underlying panel glycemic control. We, therefore, conducted a sensitivity analysis using the full-rank cohort by carrying forward HbA1C values from prior quarters, and replacing them as new values became available [14]. An X-bar and S chart of mean HbA1C and a P chart of the proportion of patients meeting target HbA1C were produced using full-rank data and analyzed visually. Following methods described in the literature, control limits were adjusted to account for autocorrelation [14].
Ethical considerations
The Institutional Review Boards of Wuqu' Kawoq | Maya Health Alliance and Harvard Medical School approved the use of chart review data for this study. SQUIRE 2.0 guidelines were utilized in the drafting of the manuscript [16].
Results
Patient characteristics
Baseline demographic and clinical characteristics of the patient sample (Table 1) included a female preponderance among clinic patients, low levels of formal education and high proportion of patients with abnormal body mass index (BMI). Mean age was 56.9 ± 12.6 years, and the median years since diabetes diagnosis was 7 years. Most patients expressed preference for the local Mayan language over Spanish.
Baseline demographic and clinical characteristics of diabetes patient sample
| Characteristic (n = 56) | Value |
|---|---|
| Age—years ± SD | 56.9 ± 12.6 |
| Female—% | 83.9 |
| Language preference—% | |
| Kaqchikel Maya | 62.5 |
| Spanish | 37.5 |
| Education | |
| Grades completed—years, median (IQR) | 2 (0–4) |
| Completed primary school—% | 21.4% |
| Time with diabetes diagnosis—years, median (IQR) | 7 (4–13) |
| Age at diagnosis, mean—years ± SD | 48.2 ± 12.4 |
| Time enrolled in program—years, median (IQR) | 2.3 (1.9–2.4) |
| Body mass index (n = 53) | |
| Mean ± SD | 27.6 ± 3.8 |
| BMI ≥ 25 (overweight)—% | 77.4 |
| BMI ≥ 30 (obese)—% | 24.5 |
For continuous variables with normal distribution, values are described as mean ± standard deviation (SD). For continuous variables with non-normal distribution, median and interquartile range (IQR) are displayed.
Primary outcomes
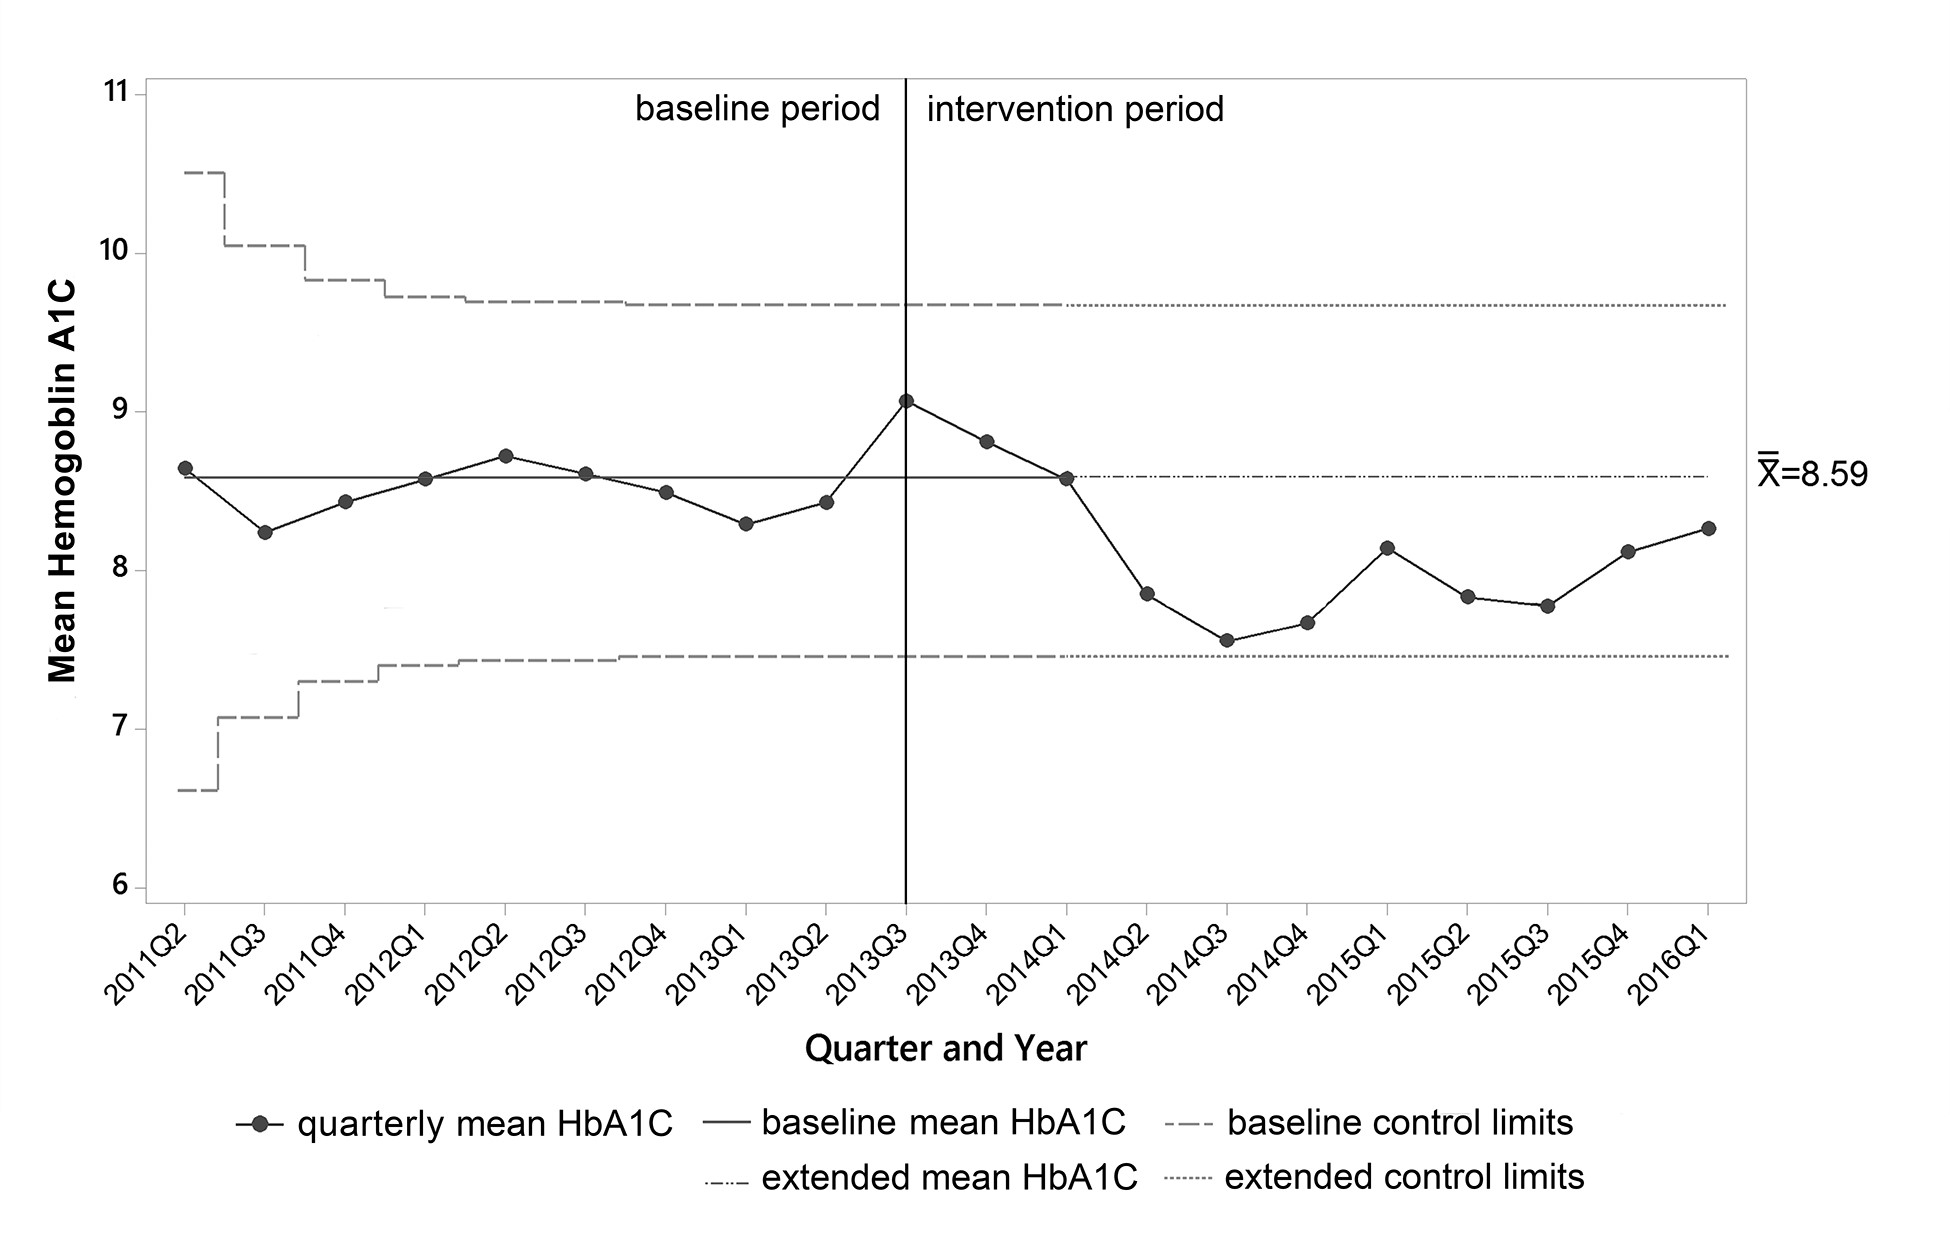
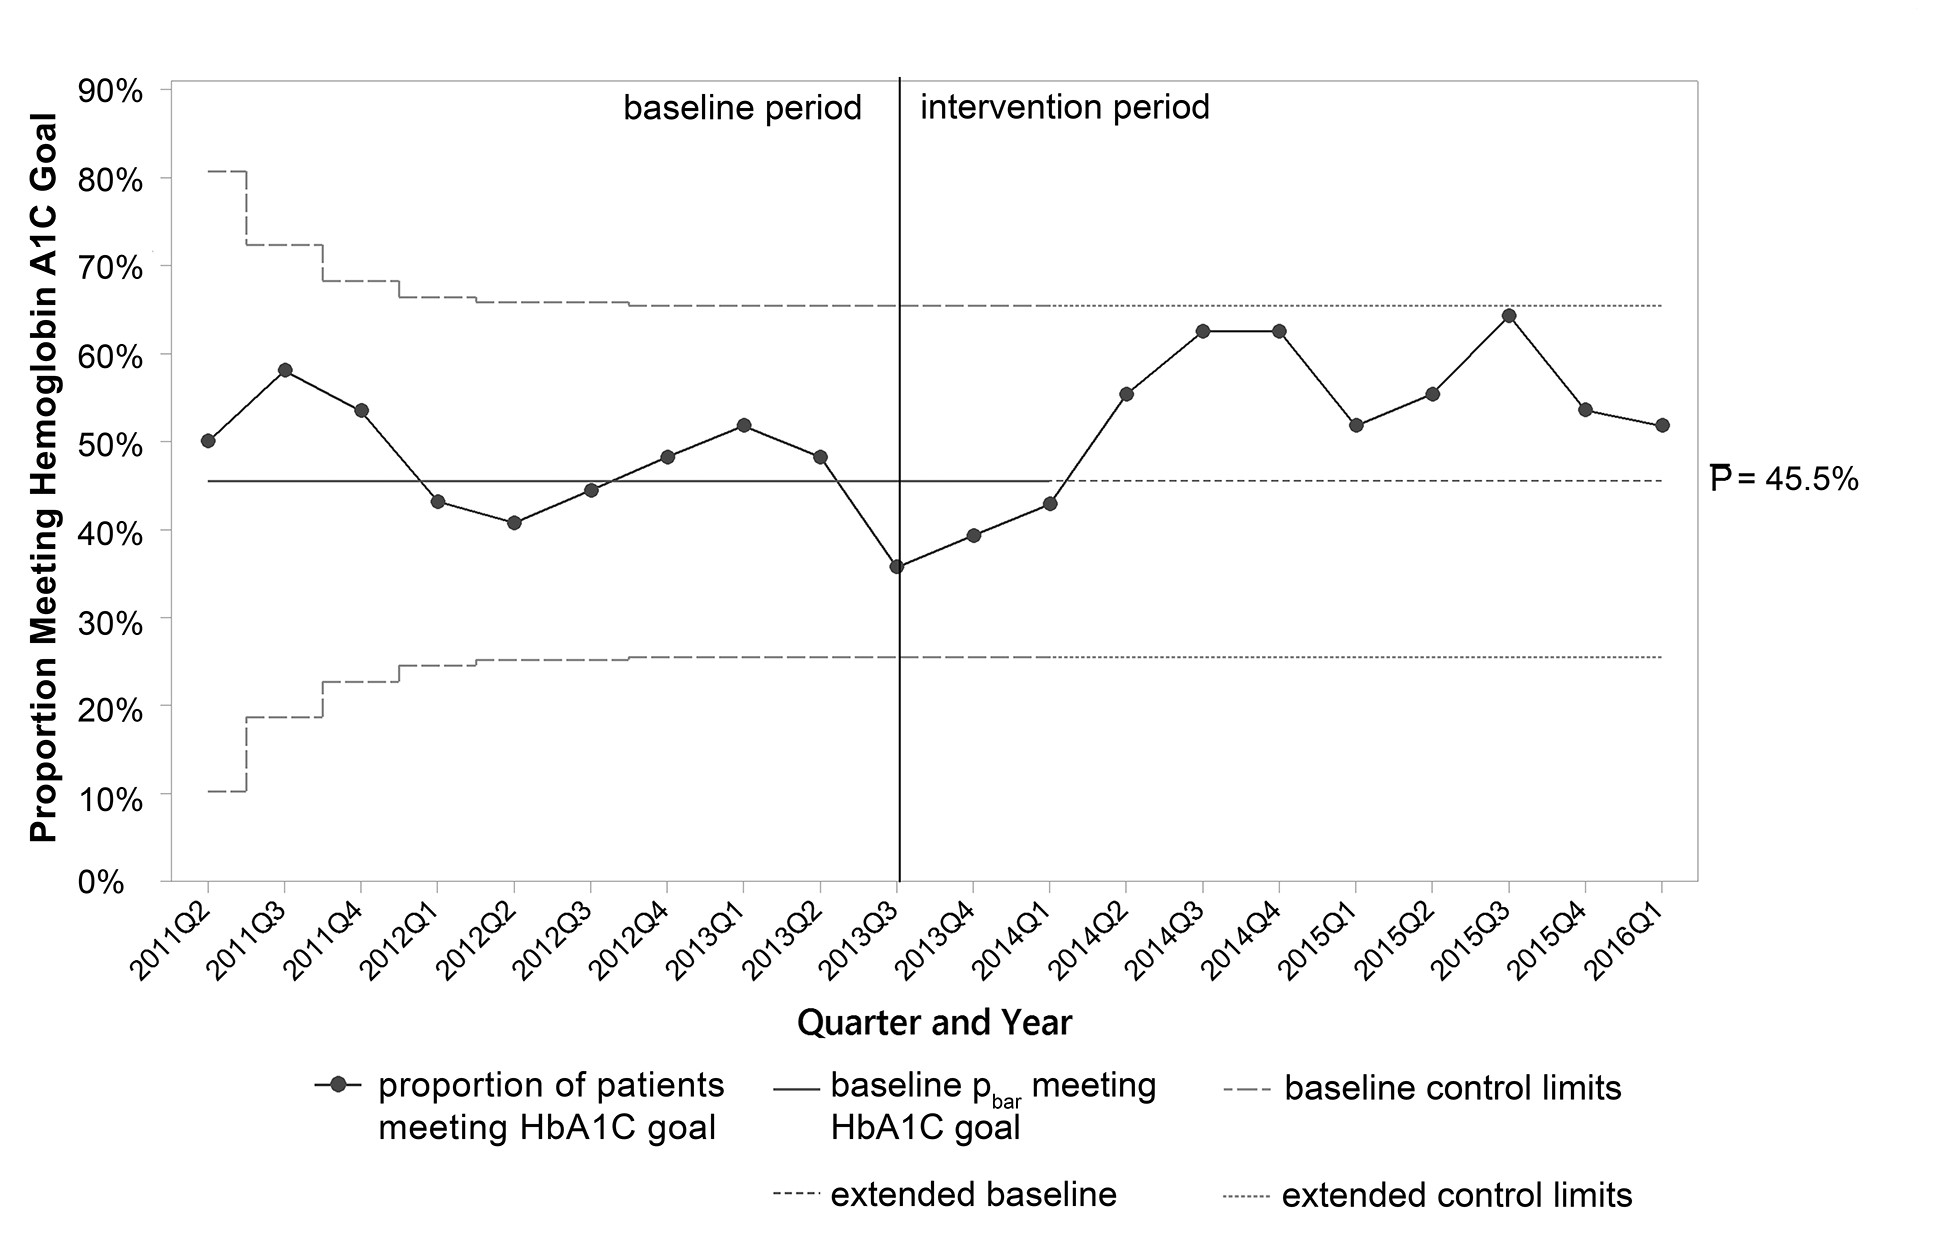
Figure 2A shows the X-bar control chart of mean HbA1C by quarter. In the intervention period, special cause was noted in 2014 Q3 when the mean decreased from the baseline mean of 8.66% below the lower control limit to 7.65%. The P chart for the proportion of patients meeting target HbA1C is depicted in Fig. 2B. During the baseline period, 42.9% met target, and then a run of six consecutive quarters began in 2013 Q3 that meets special cause criteria for a trend. Qualitatively, both control charts appear to show maximal improvements in both mean HbA1C and proportion of patients meeting target in 2014 Q3 and 2014 Q4 with subsequent waning of improvements over time. Figure 2C shows the CUSUM chart. The plot representing lower CUSUM statistic—meaning the cumulative number of individuals with HbA1C dropping below the baseline mean HbA1C for the cohort shows special cause beginning in 2014 Q4 when the line dropped below the lower control limit. The upper CUSUM plot—representing individuals with HbA1C rising above the baseline mean—revealed no special cause.
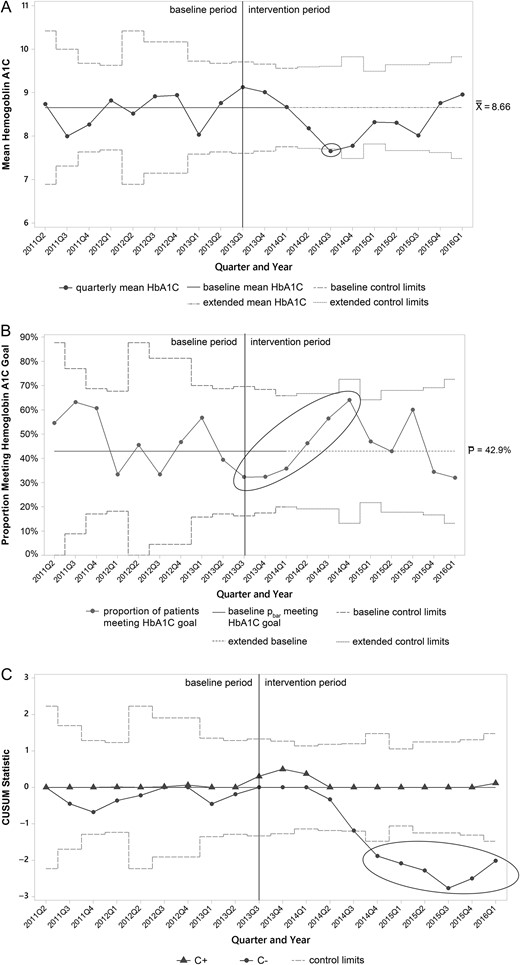
Control charts for HbA1C targets. (A) X-bar control chart of mean HbA1C. A corresponding S chart did not show any special cause variation and is omitted. (B) P chart for proportion of patients meeting HbA1C goal. (C) CUSUM chart of mean HbA1C. In all charts, the vertical line at 2013 Q3 represents the start of improvement activities, the dashed horizontal lines at 2014 Q1 represents the time at which baseline limits are extended to the future, and ellipses indicate special cause. X double bar, baseline; P bar, baseline proportion of patients meeting target; C+, upper CUSUM statistic; C−, lower CUSUM statistic.
Secondary process measures
Control charts for secondary process measures are portrayed in Figs 3–5. Mean home visits per quarter increased rapidly in the intervention period, then declined after a peak in 2014 Q2 as individual patients began completing the home-based curriculum (Fig. 3). Special cause occurred in and was sustained after 2014 Q1 when the upper control limit was exceeded. Mean clinic visits per quarter also increased from baseline during the intervention period (Fig. 4), with special cause again occurring in and sustained beyond 2014 Q1 when the upper control limit was exceeded. Finally, a P chart of the proportion of patients receiving insulin therapy showed progressive increases from the baseline through the intervention period (Fig. 5). Special cause was also achieved in and sustained beyond 2014 Q1, with the proportion of patients using insulin rising from ~15 to 30%.
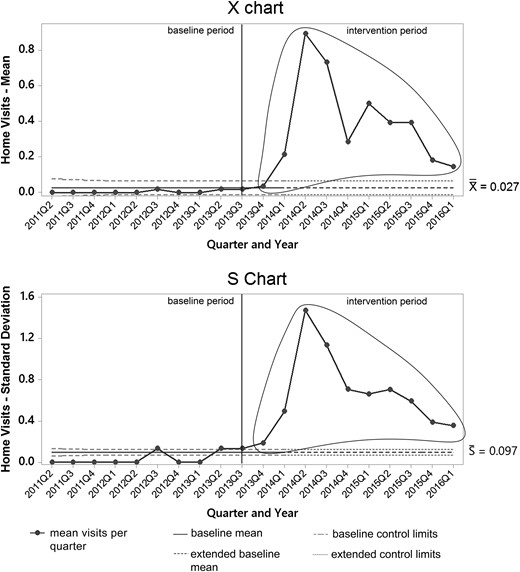
X-bar and S chart of mean home visits per quarter. The solid vertical line at 2013 Q3 represents the start of improvement activities, and the dashed horizontal lines at 2014 Q1 represents the time at which baseline limits are extended to the future. Ellipses indicate special cause during the intervention period.
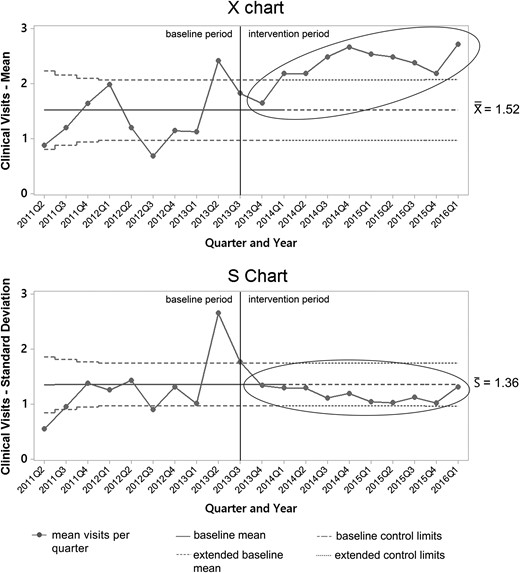
X-bar and S chart of mean clinical visits per quarter. The solid vertical line at 2013 Q3 represents the start of improvement activities, and the dashed horizontal lines at 2014 Q1 represents the time at which baseline limits are extended to the future. Ellipses indicate special cause during the intervention period.
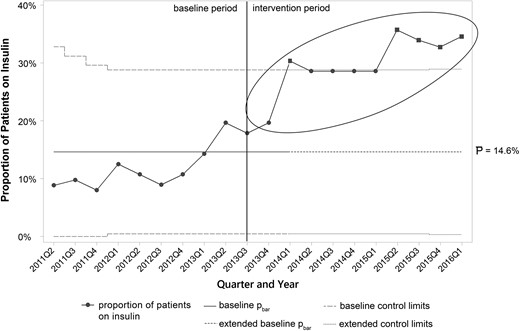
P chart of insulin prescriptions per quarter. The solid vertical line at 2013 Q3 represents the start of improvement activities, and the dashed horizontal lines at 2014 Q1 represents the time at which baseline limits are extended to the future. Ellipses indicate special cause during the intervention period.
Sensitivity analysis
The sensitivity analysis of mean HbA1C using the full-rank data approach yielded findings consistent with those from the main analyses. On visual analysis, the X-bar control chart for mean HbA1C (Supplementary data, Fig. 1) showed improvements in panel HbA1c throughout the intervention period. The P chart for the proportion of patients meeting HbA1C goal (Supplementary data, Fig. 2) also showed findings similar to the main analysis. The special cause criterion of crossing control limits was not met, however, as control limits were widened to account for autocorrelation in the full-rank data; similarly, with autocorrelated data, other special cause criteria cannot be formally applied [14]. Taken together, we conclude that the improvements observed in Fig. 2 were unlikely to be due to variation in sampling.
Discussion and lessons learned
This study describes a diabetes QI project in a resource-limited setting that utilized SPC charts to show evidence of improved diabetes care and panel glycemic control.
The primary aim of the QI project of improving mean HbA1C and the proportion of patients meeting target HbA1C were achieved as special cause was noted on control charts of the primary outcomes (Fig. 2A and B).
In addition to offering statistical evidence of improvement, the control charts offered insights into our QI intervention that might not have been discerned with traditional pre- and post-test statistical analysis. First, the control charts detected improvements early in the course of the intervention—qualitatively, after just two quarters, and formally with the detection of special cause after four quarters of the intervention period. Early detection of improvement or lack of improvement informed intervention refinement and built morale for ongoing QI efforts by the clinical team. Second, the control charts help indicate at which points in time the interventions worked best, and when the primary (outcome) and secondary (process) charts are considered together, they offer a window into how the interventions are working.
For example, the control charts of mean HbA1C (Fig. 2A) and proportion of patients meeting target (Fig. 2B) suggest that panel glycemic control was best in 2014 Q3 and 2014 Q4, but after these periods there was a tendency for improvements to wane over time. Examination of the control charts of the secondary process measures (Figs. 3–5) reveals a temporal association between higher frequency of home visits early in the intervention and better glycemic control. In particular, mean HbA1C and proportion of patients meeting HbA1C tended to be best during the periods when our home education program was most active (Fig. 3). In subsequent time periods, mean home visits declined as patients ‘graduated’ from the education program while the HbA1C control charts (Fig. 2A and B) suggested worsening glycemic control. On the other hand, other process indicators—mean clinical visits (Fig. 4) and insulin use (Supplementary data, Fig. 5)—did not decline during this time period.
These process findings will help us to consider how to optimally structure our home-visit program going forward. Although systematic reviews generally have suggested higher contact intensity as a key feature of successful diabetes behavioral and education interventions [17, 18], there is less evidence about how to ‘dose’ education and over what period of time. This issue is particularly relevant to our setting in Guatemala where we must allocate scarce clinical resources. Home-visit intensity and identification of patients who would benefit from periodic educational ‘booster doses’ have emerged as important research and QI areas for our institution.
Many authors have called for increasing the role of QI in LMICs [2, 19]. In this study, we build on previous efforts relating to diabetes QI in LMICs including a collaborative practice intervention in Lebanon [20], an evaluation of the utility of clinical audits in South Africa [21], and an assessment of improvements in national diabetes care in Mozambique [22]. We also note some of the excellent examples of SPC methods applied in recent QI reports from LMICs [23–27]. Expanding on prior work utilizing SPC for diabetes QI [28–31], this report is one of the first published applications of control charts to a longitudinal panel of diabetes patients.
We believe that the longitudinal control chart methods used in this report represent a useful practical contribution to the broader field of diabetes QI given their flexibility to be applied within existing diabetes primary care panel management systems and ability to assess improvement with small groups of patients such as those typically followed in ambulatory clinics. As illustrated in our results, diabetes control charts are useful for detecting evidence for change earlier than classical hypothesis testing, which permits implementers to interpret mechanisms and refine interventions.
Weaknesses and limitations
Our study has several limitations. First, while our overarching QI approach including the use of control charts should be highly generalizable, the degree of external validity of our specific QI improvement activities is uncertain given that they were finely tailored to the rural Guatemalan context. Nevertheless, we encourage other diabetes implementers to consider aspects of our intervention that may work in other rural and resource-limited settings, such as high-intensity interactions, use of home visits, locally adapted clinical protocols and burnout reduction strategies for front-line providers. Second, our sample size of patients is small, and our follow-up period was too short to statistically assess for the sustainability of improvement using a revised baseline in our control charts.
Third, our analysis for this QI project was restricted to patients who already had been enrolled in our program for several years. This permitted us to assess, in the context of rapid new growth in clinic volume, improvement among patients already under active clinical management and with sufficient baseline data to conduct such an analysis. However, we may have overestimated the impact of improvement activities by over-selecting for more adherent patients. At the same time, since we only had 10 quarters of baseline data prior to the intervention and included 2 quarters of intervention data to satisfy the minimum of 12 time points [14], the intervention's overall impact could be underestimated.
Despite these weaknesses, this article makes a meaningful contribution to the improvement of global diabetes care by demonstrating: (i) it is feasible to use QI approaches in LMIC resource- limited settings, such as our rural Guatemalan site; (ii) our integrated diabetes interventions focused on home, clinic and organizational factors were effective in improving care and glycemic control; and (iii) the application of SPC methods for panels or registries of diabetes patients is a powerful technique for identifying improvements sooner and for illustrating the mechanisms behind the improvements.
Supplementary material
Supplementary material is available at International Journal for Quality in Health Care online.
Authors’ contributions
All authors participated in the conception of this study, selection of the cohort, data analysis and interpretation, and drafting of the manuscript. D.F. was the diabetes coordinator during the intervention period and drafted the initial manuscript. K.D. and V.G. were responsible for data extraction and coordinated the study team during the data analysis phase. B.M. and P.G. assisted in data extraction and analysis. M.A. contributed methodological expertise on QI and assisted in drafting the manuscript. P.R. founded the diabetes program, managed on-the-ground QI work and supervised the drafting process. All authors critically reviewed and approved the manuscript as submitted.
Acknowledgements
We thank Sandy Mux and Carol Teleguario for their persistence in delivering clinical diabetes care in rural Guatemala. We are also grateful for the support of Anne Kraemer Diaz, Waleska Lopez and Merida Coj at Wuqu' Kawoq | Maya Health Alliance.
Funding
The authors received no specific funding for this work.
Conflict of interest statement
None declared.
Data sharing statement
De-identified replication data for this study is available at: doi:10.7910/DVN/QROEMV.
