


Abstract
Empirical evidence examining how risk and protective behaviors may possibly mediate the association between gang membership and school violence is limited. This study utilizes a statewide representative sample of 152 023 Latino, Black and White seventh graders from California to examine a theoretical model of how school risk (e.g. truancy, school substance use and risky peer approval) and protective (e.g. connectedness, support and safety) behaviors and attitudes mediate the effects of gang membership on school violence behaviors. The dataset was collected in the 2005–2006 and 2006–2007 academic school years using the ongoing large-scale California Healthy Kids Survey conducted by WestEd for the State of California. Approximately 9.5% of the sample considered themselves to be a member of a gang. The findings indicate that school risk behaviors and attitudes mediate the association between gang membership and school violence behaviors. Although the direct negative association between gang membership and school violence perpetration is weak, the positive indirect effect mediated by school risks behaviors and attitudes is strong. This indicates that when gang members engage in school risk behaviors, they are much more likely to be school violence perpetrators. Implications for further research, theory and practice for both gang and school violence researchers are discussed.
Introduction
Middle schools are important developmental contexts with potentially great influence on adolescent behavior. However, during middle school, students may be victimized, exposed to risky peers or attend schools where gang members are present. Results from the 2007 School Crime Supplement to the National Crime Victimization Survey indicate that between 15 and 21% of middle school students reported a gang presence at school [1]. Males reported a slightly higher percentage (25%) than females (21%), and Latino and Black students reported much higher percentages (between 36 and 38%) than White students (16%) [1]. More recently, in 2010, the National Survey of American Attitudes on Substance Abuse XV: Teens and Parents revealed that 35% of middle school students reported that there were gangs or students who consider themselves to be part of a gang in their schools [2]. These findings indicate that youth are likely to interact with gang-affiliated peers in school settings. However, less is known about whether such interactions with risky peers at school increase or decrease the likelihood of a student becoming a gang member, perpetrator or victim of school violence. Additionally, empirical evidence examining how gang membership may contribute to the involvement in other risk behaviors at school, such as truancy, substance use or school violence is warranted. Furthermore, given the fact that protective factors are frequently neglected in the gang and school violence literature, inquiries that examine how school connectedness, support and safety may possibly mediate the association between gang membership and school violence have rarely been explored [3–6].
This study is one of the first inquiries using statewide representative data in California to examine the following research questions: (i) Is gang membership directly associated with school violence behaviors in the middle school setting? and (ii) Is gang membership indirectly associated with school violence behaviors through risk and protective behaviors and attitudes that occur in school?
A theoretical model to explore gang membership in the school context
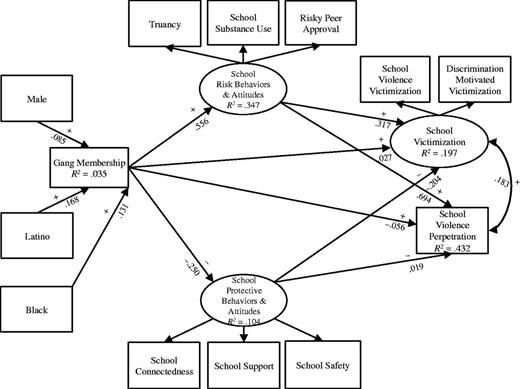
Recognizing the gap within previous theories and empirical evidence, this study will situate the school as the nucleus of a socioecological model to better understand how students’ behaviors and attitudes interact and influence gang membership and school violence behaviors in California middle schools [7]. This study proposes that school victimization and school violence perpetration are directly associated with gender, ethnicity, gang membership and school risk and protective behaviors and attitudes. Figure 1 displays the theoretical model used in this study. Direct path lines with plus and minus signs in the model denote the hypotheses in this study. Plus signs specify a positive relationship between the two variables and minus signs designate a negative association.
Structurual equation model and results for California middle school students. Notes: The plus and negative signs denote the hypotheses in this study. Plus signs specify a positive relationship between the two variables and minus signs designate a negative association. Dummy variables for Male, Latino and Black were included in the overall analysis but pathways were removed from the figure to simply the model and highlight the most relevant results. Results for these dummy variables showed very weak associations and are detailed in the text.
This model is unique from those in previous studies because it proposes that individual-level variables (i.e. gender, ethnicity and gang membership) will have indirect effects on the school violence behaviors (i.e. school victimization and school violence perpetration) that are mediated through student behaviors and attitudes that occur in school (i.e. school risk and school protective behaviors and attitudes). For instance, this model hypothesizes that gang membership will indirectly influence school violence perpetration by impacting student risk behaviors and attitudes that occur in school. Specifically, students who are gang members are possibly more likely than non-gang members to have higher levels of school truancy, substance use and risky peers, and in turn, their levels of school violence perpetration and victimization will most likely increase. Conversely, students who are non-gang members are possibly more likely than gang members to report higher levels of connectedness, support and safety, which may in turn result in a lower likelihood of school violence perpetration and victimization. Empirical support that helps explain the importance of each variable included in the model is discussed below.
Gender, ethnicity and gang membership
Gang research tends to focus heavily on individual factors that contribute to gang affiliation [8, 9]. A thorough review of self-report studies conducted by Klein and Maxson [9] concluded that rates for males were 1.5 to 2 times higher than female gang membership prevalence rates. Correspondingly, in results from a national sample of almost 1300 schools, 7.1% of males and 3.6% of females reported gang participation [10]. Additionally, much wider differentials in gang membership rates exist for ethnicity [9]. White gang membership prevalence rates are considerably lower (at least half and often one-third lower) than that of Black and Latino youth [9]. In Gottfredson and Gottfredson’s [10] study, gang membership was higher for Blacks (12.6% males and 6.0% females) and Latinos (9.8% males and 6.8% females) than for Whites (5.3% males and 2.1% females). Considering the differential rates produced by gender and ethnicity in previous research, it was important to include these variables in the model to determine associations they may have with gang membership, school risk and protective behaviors, and school violence perpetration and victimization.
Gang membership and risk and protective behaviors and attitudes
Several risk and protective behaviors that occur in schools have been found to be associated with gang membership. For the purposes of this study, behaviors and attitudes occurring in school that increase a student’s vulnerability for gang membership are considered school risk behaviors and attitudes [9, 11]. School protective behaviors and attitudes are those on the opposite end of the continuum that protect students from gang membership [9].
As Figure 1 illustrates, truancy, school substance use and risky peer approval were included in the model as the students’ school risk behaviors and attitudes. It was important to include these variables since they have all been consistent correlates of gang membership in previous research. For instance, truancy can be related to negative behaviors that include gang involvement, drug use and delinquency [12–15]. Maxson et al. [14] reported that non-gang members were significantly less truant when compared with gang members. Additionally, early drug use has been found as an indicator of gang membership [16–18]. Hill et al. [19] found students who had tried marijuana at ages 10–12 years were nearly four times more likely to join a gang at ages 13–18 years old. Studies also consistently find affiliations with risky peers to be a gang risk factor [9]. In a sample of youth from Denver who were either non-offenders, gang members or non-gang street offenders, Esbensen et al. [20] reported both gang members and non-gang street offenders reported lower levels of commitment to positive peers, higher levels of commitment to delinquent peers and higher tolerance for their peers’ criminal activity. Similarly, the school violence literature has consistently found that risky peer groups are a major contributing factor for victimization and perpetration of school violence behaviors [7, 21–23]. Risky peers increase the likelihood of both school violence perpetration and victimization [7, 21–23].
Although previous scholarship has established these variables to be strongly correlated with gang membership, little is known about how, together as student school risk behaviors in the middle school context, they may have a mediating direct or indirect effect on the association between gang membership and school violence behaviors. Furthermore, mediating effects of school protective behaviors and attitudes is also understudied and therefore also included in the model.
School connectedness, school support and school safety were the variables labeled in the model as the students’ school protective behaviors and attitudes. School connectedness and support have generated mixed outcomes when analyzed as indicators of gang membership [19, 24]. Hill et al. [19] revealed that when compared with students with high levels of school attachment and commitment, students with lower attachment and commitment in fifth and sixth grades were nearly twice as likely to join a gang during their 7–12th grade years. Yet, contrary to these findings, Maxson et al. [24] found that associations between school commitment or attachment and gang membership were not significantly associated in multivariate models that include variables from different domains. Thus, further exploration of school connectedness and support as protective factors is warranted.
Perceptions of school safety have also produced mixed results as an indicator of increased gang membership [25]. Klein and Maxson [9] report that a youth’s perception of his or her school being a safe or unsafe environment has not been consistently supported as a gang risk factor in prior research. For instance, Esbensen and Deschenes [25] found that a student’s perception of a hostile school environment significantly increased the likelihood of being a gang member by 78%. However, results from Maxson et al. [14] indicated that the fear of being hurt before, during or after school did not differentiate between gang and non-gang members and was not found to be a significant predictor in multivariate analyses.
An explanation of the variation in these results may be the fact that perception of one’s school as a hostile environment is quite different than the fear of being personally victimized before, during or after school [7]. Other research has suggested that only certain places in and around the school are seen as safe or unsafe [26]. Still other research has shown that safety is associated more with the knowledge of risky peer group behavior on school grounds rather than with personal victimization [21–23, 27, 28]. How students who are gang and non-gang members differ in their perceptions of school safety may be a critical variable to study. Therefore, due to the mixed outcomes surrounding school safety, support and connectedness, this study will examine these school protective behaviors and attitudes to determine whether they have a direct or indirect effect on gang membership and school violence behaviors.
The association between gang membership and school violence
Previous research indicates that when compared with non-gang members, gang members are more likely to commit violent acts at higher rates [29–31]. Also, while studied less frequently, the contribution gang membership has on the prediction of violence victimization received attention in recent research [32–34]. In a study consisting of 5935 eighth-grade middle school students, Taylor et al. [34] found gang members were significantly more likely to be violently victimized and experienced a greater number of victimizations than non-gang members in both general and serious types of violence. In a cross-sectional study of eighth-grade middle school students from 11 cities across the United States, Esbensen and Deschenes [25] found that compared with gang members, non-gang members reported lower levels of violence at school and a significantly lower degree of victimization. Additionally, Bjerregaard and Lizotte [35] found gang members were more than twice as likely than non-gang members to carry a gun and engage in violent delinquency.
As for school violence, research within the United States and internationally indicates an association between school violence behaviors (i.e. perpetration and victimization) and other school behaviors and attitudes, such as, truancy, substance use and the perceptions of fear and safety [7, 27, 36–38]. However, associations between school violence and gang membership, and how risk and protective behaviors and attitudes in school may medicate that relation are understudied. Therefore, a particular inquiry of this study will be to explore the direct and indirect associations between gang membership and school violence behaviors in the middle school context.
Methods
The data used in this study are from the ongoing large-scale California Healthy Kids Survey (CHKS) conducted by WestEd for the State of California [39]. The CHKS consists of a core survey module that includes demographic background data (e.g. age, sex and race/ethnicity) and numerous questions about students’ health-related behaviors, tobacco use, alcohol use, drug use, violence behaviors and school safety. Given that certain districts are surveyed every other year, this study will consider two academic school years to get a more representative sample of the entire State of California.
The dataset used for this study were collected in the 2005–2006 and 2006–2007 academic school years using the CHKS core module (CHKS Version 9). The CHKS is administered to 7th, 9th and 11th grade youth in California school districts which meet Title IV requirements (approximately 85% of districts statewide). In this study, only middle school students, in the seventh grade, were selected. Additionally, given that Latinos, Blacks or Whites comprise the three largest ethnic groups in California and the ethnic differentials between them for gang joining are so wide, only students who are Latino, Black or White were included so that differences and similarities could be studied in depth. The resulting sample for this study consisted of 152 023 middle school students. Appropriate institution-, district- and state-level permissions and reviews were completed.
Measurement
Gang membership
Most gang studies rely on self-identification of gang membership [29, 40, 41]. According to Curry and Decker [42], ‘the most powerful measure of gang membership is self-nomination’ (p. 6). Therefore, for the purpose of this study the question, ‘Do you consider yourself a member of a gang?’ was used to determine a participant’s gang membership. Students who answered affirmatively were classified as gang members and those who responded negatively were classified as non-gang members.
Dependent and mediating variables
As Fig. 1 illustrates, student background characteristics and gang membership effects on school victimization (i.e. school violence and discrimination-motivated victimization) and school violence perpetration (i.e. physical fights, damaging property and weapon carrying) are mediated by risk (i.e. truancy, substance use and risky peers) and protective (i.e. connectedness, support and safety) behaviors and attitudes. Latent variables for school violence victimization and school risk and protective behaviors and attitudes were constructed based on theoretical and empirical methodology using several of the items and scales from the CHKS core module.
The school violence variables in the model were theoretically and empirically separated by perpetration and victimization behaviors. School violence perpetration consists of behaviors where a student has perpetrated violence on school property during the past 12 months and includes being in a physical fight, damaging school property on purpose and carrying a gun or other weapon, such as a knife or club. On the other hand, school victimization includes two types of behaviors that have occurred on school property within the past 12 months; one that includes generic violence victimization behaviors, such as being pushed, shoved, slapped, hit or kicked, and the other labeled discrimination-motivated victimization that includes being harassed or bullied because of a particular identity group that a student may belong to (e.g. race, religion, gender and sexual orientation). Table I displays the latent variables, the manifest variables, alphas, factor loadings and items used to create the latent variables integrated in the structural equation model.
Latent variables, manifest variables, factor loadings, alphas and items
| Latent variables | Manifest variables (alpha and/or factor loadings for the three different components) | Items |
|---|---|---|
| Ethnicity | ‘How do you describe yourself?’ | |
| Gang membership | ‘Do you consider yourself a member of a gang?’ | |
| School risk behaviors and attitudes | Truancy | ‘During the past 12 months, how many times did you skip school or cut classes?’ |
| (loading = 0.688) | ||
| School substance use scale | ‘During the past 30 days, on how many days on school property did you … | |
| (α = 0.73, loading = 0.660) | ||
| … smoke cigarettes?’ | ||
| … have at least one drink of alcohol?’ | ||
| … smoke marijuana?’ | ||
| Risky peer approval scale | ‘How much would your friends disapprove of you … | |
| (α = 0.85, loading = 0.610) | ||
| … for using cigarettes?’ | ||
| … for using alcohol?’ | ||
| … for using marijuana?’ | ||
| … for carrying a weapon to school?’ | ||
| School protective behaviors and attitudes | School connectedness scale | ‘I feel close to people at this school.’ |
| (α = 0.82, loading = 0.856) | ‘I am happy to be at this school.’ | |
| ‘I feel like I am a part of this school.’ | ||
| School support scale | ‘At my school, there is a teacher or some other adult … | |
| (α = 0.91, loading = 0.705) | … who really cares about me.’ | |
| … who notices when I’m not there.’ | ||
| … who listens to me when I have something to say.’ | ||
| … who tells me when I do a good job.’ | ||
| … who always wants me to do my best.’ | ||
| … who believes I will be a success.’ | ||
| School safety | ‘I feel safe in my school.’ | |
| (loading = 0.839) | ||
| School victimization | School violence victimization scale | ‘During the past 12 months how many times on school property … |
| (α = 0.75, loading = 0.792) | ||
| … have you been pushed, shoved, slapped, hit or kicked by someone who wasn’t just kidding around?’ | ||
| … have you been afraid of being beaten up?’ | ||
| … have you had mean rumors or lies spread about you?’ | ||
| … have you had sexual jokes, comments or gestures made to you?’ | ||
| … have you been made fun of because of your looks or the way you talk?’ | ||
| … have you had your property stolen or deliberately damaged, such as your car, clothing or books?’ | ||
| … have you been threatened or injured with a weapon (gun, knife, club, etc.)?’ | ||
| … have you seen someone carrying a gun, knife or other weapon?’ | ||
| Discrimination motivated victimization scale | ‘During the past 12 months, how many times on school property were you harassed or bullied for any of the following reasons … | |
| (α = 0.69, loading = 0.820) | ||
| … your race, ethnicity or national origin?’ | ||
| … your religion?’ | ||
| … your gender?’ | ||
| … because you are gay or lesbian or someone thought you were?’ | ||
| … a physical or mental disability?’ | ||
| … any other reason?’ | ||
| School violence perpetration scale | ‘During the past 12 months how many times on school property … | |
| (α = 0.66) | ||
| … have you been in a physical fight?’ | ||
| … have you damaged school property on purpose?’ | ||
| … have you carried a gun?’ | ||
| … have you carried any other weapon, such as a knife or club?’ |
Analytical plan
All analyses were conducted using Mplus 6.11. A confirmatory factor analysis was first conducted to verify the goodness of fit of the measurement model and to assess the adequacy of the hypothesized relations between the measured indicators and underlying latent variables (see Table I for further details). Goodness of fit was assessed using χ2, Comparative Fit Index (CFI) and Root Mean Square Error of Approximation (RMSEA) [43, 44]. Table II reports the means and standard deviations of the variables included in the model, separated by gender. It also indicates the ranges of responses for each item and scale and how the mean scale scores were derived by averaging the item scores.
Means and standard deviations by gender for middle school sample
| Latent variable | Overall | Males | Females | |||
|---|---|---|---|---|---|---|
| Item/scale | Mean | SD | Mean | SD | Mean | SD |
| School risk behaviors and attitudes | ||||||
| Truancya | 0.23 | 0.49 | 0.24 | 0.51 | 0.22 | 0.47 |
| School substance use scaleb | 0.01 | 0.13 | 0.02 | 0.14 | 0.01 | 0.11 |
| Risky peer behavior approval scalec | 1.54 | 0.90 | 1.62 | 0.95 | 1.46 | 0.86 |
| School protective behaviors and attitudes | ||||||
| School connectedness scaled | 3.23 | 1.04 | 3.13 | 1.07 | 3.32 | 1.01 |
| School safetyd | 3.41 | 1.13 | 3.34 | 1.18 | 3.47 | 1.07 |
| School support scalee | 2.58 | 0.88 | 2.52 | 0.89 | 2.63 | 0.87 |
| School victimization | ||||||
| School violence victimization scalef | 0.20 | 0.41 | 0.21 | 0.42 | 0.18 | 0.39 |
| Discrimination motivated victimization scalef | 0.04 | 0.21 | 0.05 | 0.23 | 0.04 | 0.19 |
| School violence perpetration scale | 0.09 | 0.31 | 0.13 | 0.37 | 0.05 | 0.24 |
aOn a scale: 0 = never, 1 = a few times a year and 2 = at least once a month. bOn a scale: 0 = no past month use, 1 = 1–9 days, 2 = 10 or more days. Participants’ mean score on the scale was derived by averaging the item scores. Scale scores range from 0 to 2. cOn a scale: 1 = a lot, 2 = some, 3 = not much and 4 = not at all. Participants’ mean score on the scale was derived by averaging the item scores. Scale scores range from 1 to 4. dOn a scale: 1 = strongly disagree to 5 = strongly agree. Participants’ mean score on the scale was derived by averaging the item scores. Scale scores range from 1 to 5. eOn a scale: 1 = not at all true, 2 = a little true, 3 = pretty much true and 4 = very much true. Participants’ mean score on the scale was derived by averaging the item scores. Scale scores range from 1 to 4. fOn a scale: 0 = never, 1 = once and 2 = more than once. Participants’ mean score on the scale was derived by averaging the item scores. Scale scores range from 0 to 2.
The structural equation model estimated for this study was completed using the weighted least squares mean and variance-adjusted estimation (WLSMV) due to the complex analysis of both categorical and continuous indicators [45]. Cases missing complete information (0.02%, N = 2320) were handled using the pairwise deletion procedure Mplus employs when using the WLSMV estimator. The structural modeling analysis was performed using a weighting procedure to adjust the total of grade-level respondents to represent the total district enrollment counts. These weights are included in the CHKS database used for the current analysis.
Given that large sample sizes tend to produce statistically significant values for even minute direct and indirect effects, interpretation of the structural equation modeling results will follow previous research and will be based on beta weights and variance explained by the R2, rather on significance of coefficients [7, 22, 23, 27, 28, 46].
Results
Descriptive statistics
The overall sample included in the analysis consisted of 149 703 middle school students from California. Respondents were approximately evenly split by gender (48.1% male and 51.9% female). Nearly 59% of the respondents were Latino, 34% were White and 7.5% were Black. Approximately 9.5% (N = 13 503) of the middle school student sample reported that they considered themselves to be a member of a gang and 56.2% were male (N = 7589), 43.8% female (N = 5914), 69.1% were Latino (N = 9326), 20.9% were White (N = 2818) and 10.1% were Black (N = 1359). When broken down by the percentage within each gender, 11.3% of all male and 7.9% of all female students surveyed considered themselves to be a member of a gang. Within ethnicity groups, 5.7% of all the White students, 11.3% of all the Latino students and 13.3% of all the Black students surveyed considered themselves to be a member of a gang.
The overall model
Figure 1 displays results of the structural analysis for the overall sample. For this model, the χ2 was (42, N = 149 703) = 717.969, P = 0.000. Since χ2 is sensitive to large sample sizes like that used in this study, two other indices of practical fit were used to determine model fit. The RMSEA for this model was 0.010 and the CFI was 0.932. The goodness-of-fit assessments indicated the overall model had acceptable fit. In order to make the coefficients comparable and to determine which variable had the greatest effect, the standardized regression weights were reported.
The direct association between gang membership and school violence perpetration was negative and weak (β = −0.056). However, the indirect effect mediated by the association between gang membership and school risk behaviors and attitudes (β = 0.556) and the association between these risk behaviors and attitudes and school violence perpetration (β = 0.694) was positive and strong (β = 0.386). The very high overall amount of explained variance for perpetration was R2 = 0.432. Much of the explained variation was derived from the contributions of gang membership and school risk behaviors and attitudes.
The role of gang membership with victimization was weaker than perpetration. The model explained about 20% of the variance for school victimization. Correspondingly, there was a weak direct association between gang membership and school victimization (β = 0.027). However, the indirect association between gang membership and school victimization strengthened when it was mediated by school risk behaviors and attitudes (β = 0.176). This, in turn, indirectly contributed to the positive direct association between school risk behaviors and attitudes and school victimization (β = 0.317).
Examination of the model indicates that there is little evidence for the gang membership effects on school violence perpetration and victimization mediated by school protective factors. Gang membership was negatively associated with school protective behaviors and attitudes (β = −0.250). However, the latent variable of school protective behaviors and attitudes was negatively and weakly associated with school victimization (β = −0.204) and very weakly associated with school perpetration (β = 0.019). Hence, the indirect effects of gang membership through school protective behaviors and attitudes on school violence perpetration and victimization were very small (β = 0.051 and −0.005, respectively).
The covariates of gender and ethnicity did not have strong direct or indirect (mediated) effects on school victimization or school violence perpetration. Being male, Latino or Black was weakly associated with gang membership (β = 0.085, 0.168 and 0.131, respectively) and had a very minimal increase on the level of school risk behaviors and attitudes (β = 0.018, 0.124 and 0.077, respectively). Being Latino or Black slightly decreased the level of school protective behaviors and attitudes (β = −0.149 and −0.099, respectively), school victimization (β = −0.135 and −0.064, respectively) and school violence perpetration (β = −0.065 and −0.044, respectively). Being male had a very weak negative association with school protective behaviors and attitudes (β = −0.079), and a weak positive association with school victimization (β = 0.020) and school violence perpetration (β = 0.088).
Discussion
Utilizing a large sample of middle school students in California, this cross-sectional study examines how school risk and protective behaviors and attitudes mediate the effects of gang membership on school victimization and school violence perpetration. Associations between gender, ethnicity, gang membership, school risks and protective behaviors and attitudes, school victimization and school violence perpetration were examined.
Gender and ethnicity
Results indicate that gender and ethnicity have a very weak association with gang membership, school risk and protective behaviors and attitudes, and school violence behaviors. This finding challenges previous research, which indicates that there is an over-representation of males and minorities, specifically Latinos and Blacks, in gangs [47–49]. As Vigil’s [50, 51] multiple marginality framework suggests, gangs become a fulfilling replacement for many Latinos and Blacks; however, the problem does not stem from one being Latino or Black or even male. This street socialization is a combination of multiple effects that include unaccommodating school environments. As the findings of this study indicate, it is possible that the socialization that occurs within the school environment (i.e. school risk behaviors and attitudes) may materialize into violent perpetration. This relatively weak association suggests that theories on gang membership and school violence should include gender and ethnicity but devote more attention to variables within the school context, primarily school risk behaviors and attitudes. As some researchers suggest, despite the individual factors that may make some youth more prone to join a gang, ‘gang-aware school staffs, supportive school environments, and vigorous school academic and social programs may be an essential component in prevention for many potential future gang members’ [2, p. 50].
Gang membership
Given the lack of consensus between gang scholars on an acceptable and comparable definition of gang membership, as well as methodological variation between studies, prevalence rates have been as low as 6% [52] and as high as 30% [18, 53, 54]. Using self-report data, this study found that 9.5% of Latino, Black and White middle school students in California consider themselves to be a member of a gang. However, the most important finding of this study is that the direct effects of gang members on school violence perpetration and school victimization were very weak. Based on prior research, it was expected that gang members alone would have a strong direct effect on school perpetration as well as victimization. Yet, this is not the case in the overall model. This may suggest that there is something unique about the school context that possibly impacts a gang member’s behaviors and attitudes. Perhaps there are others that surround and protect gang members in school from victimization. Maybe there are too many witnesses in a school that prevent gang members from perpetrating school violence. Schools may possibly be perceived as neutral zones for rival gangs and therefore school violence perpetration and victimization are limited. Further research should explore these and other questions that may provide an understanding of why the direct effect of gang membership on school violence behaviors is weak when in a middle school setting.
Another important finding is that gang membership had a strong indirect effect on school violence perpetration and school victimization that was mediated through school risk behaviors and attitudes. This indicates that when a gang member engages in school risk behaviors, such as truancy, substance use and risky peers, the likelihood of school perpetration and victimization can be amplified. Therefore, the dynamics of the school and how a gang member interacts within the school context can directly and indirectly effect levels of school violence perpetration and victimization.
As anticipated, the direct linear association between gang membership and school risk behaviors and attitudes had the second strongest effect in the model. This strong association was expected since previous research indicates that the manifest variables (i.e. truancy, school substance use and risky peers) that make up the school risk behaviors and attitudes latent construct have been found to be significant predictors of gang membership [9, 14, 16–18]. Consequently, these findings support the hypothesis that gang membership is strongly associated with school risk behaviors and attitudes.
Conversely, another strong direct effect is that gang membership is negatively associated with school protective behaviors and attitudes for middle school students. Although this finding may be expected, it brings up interesting probes to consider. For instance, gang members may not feel close, happy or a part of a school since the gang culture is often not accepted or incorporated into the school context. Furthermore, do teachers provide an equal amount of support to gang members or do negative perceptions hinder their supportive efforts? Such inquiries need to be explored in further research.
School risk and protective behaviors and attitudes
School risk and protective behaviors and attitudes had indirect effects as significant mediators of the effect of gang membership on school victimization and school violence perpetration. The findings support the theoretical model that school victimization and school violence perpetration are subjective to a variety of school variables, which can mediate the contributions from individual factors such as ethnicity and gang membership [7].
The results show that the school risk behaviors and attitudes latent variable have the greatest direct and indirect effects on school violence perpetration for the overall model. This variable also has strong direct and indirect effects on school victimization. Given that a student’s individual level characteristics have been found to play a significant role in shaping the degree to which problems will manifest, it is understandable why having a higher score on school risk behaviors and attitudes can possibly lead to higher levels of school victimization and school violence perpetration [7, 36–38, 55, 56]. Unfortunately, schools that have a high rate of truancy, substance use problems and risky peers are often ill-equipped to deal with elevated school violence victimization and perpetration incidents because of inadequate environmental and organizational factors. Overall, the findings imply that socioecological factors of a school, such as the school’s ability to manage truancy, substance abuse, risky peers and other related issues, should play the most important role in school-based theory development and implementation [7, 56].
Results also show that the school protective behaviors and attitudes latent variable had direct and indirect effects on school victimization and school violence perpetration for the overall model. When a middle school student feels safe, connected and supported by a teacher or other adult in school, the probability of school violence victimization most likely decreases [7, 36–38, 55]. Yet, when examining the association between school protective behaviors and attitudes and school violence perpetration, an unexpected finding emerged. School protective behaviors and attitudes may minimally increase the level of school violence perpetration. This may suggest that regardless of a student’s positive attitudes toward school, they may still feel the need or even be forced by peers or circumstances to perpetrate violence. However, it is important to note the coefficient from school protective behaviors and attitudes to school violence perpetration was extremely low. Although this path was significant in this large sample, we suggest not over-interpreting this minuscule finding. Yet, it is important to further explore this factor to determine why a student who feels safe, connected and supported at school would possibly engage in perpetration behaviors.
Summary
Overall, what the findings imply is that the patterns between gang membership and school risk behaviors and attitudes have the most powerful effect on school violence perpetration, and to a lesser extent on school victimization. Therefore, theories, policies and interventions that focus on reducing gang membership, truancy, school substance use and risky peers may lead to a large reduction of school violence perpetration and school victimization.
Limitations
A study limitation is that the data are a school-based survey using only self-reports from California students in the seventh grade. Even so, many researchers in the school violence and gang literature believe that self-report is often more reliable than police records, arrest rates or observation [7, 42]. Clearly, there are more youth in gangs that may self-identify that have not been caught or convicted by law enforcement agencies. Only a slight percentage of school-aged gang members engage in serious or violent crimes that would get them arrested and identified by law enforcement databases [40, 57]. Additionally, gang membership was measured using only one item. A more comprehensive list of items that capture information about a student’s degree and association of gang involvement, gang activities, gang peers, etc. would have provided a more judicious examination of gang membership.
Moreover, due to the specific sample selection, the results are generalizable to only Latino, Black and White seventh grade middle school students in traditional public schools within California. Consequently, students who were absent on the day of the survey or from continuation/community day schools were excluded from the sample, resulting in a possible under-representation of high-risk youth that may have been gang members in public schools. Additionally, some measures inquired about behaviors during the past year and/or past month, which may lead students to sometimes under or over report behaviors [7]. This is less of a concern for infrequent high severity events, which students remember better. Finally, causality cannot be attributed in this study since the cross-sectional nature of the data precludes discussion of causal–effect relations.
Implications
Educators may be inclined to focus on gang membership as a problem independently. However, this study found that gang membership has an indirect effect on school violence perpetration and school victimization that is mediated through school risk behaviors and attitudes. Therefore, rather than focusing on gang membership as a separate major issue, schools should spend more energy addressing the risk behaviors and attitudes that are related to school violence perpetration and victimization. Theoretical approaches aimed at reducing the impact of school violence in schools need to consider the school risk behaviors occurring on campus and the degree in which gang members are participating. More importantly, theories need to incorporate the role school risk behaviors and attitudes plays on school-based gang members and school violence, and explore how these variables impact each other.
The findings of this study suggest that gang members may or may not influence school violence directly, but do so primarily through indirect associations between gang membership and school risk behaviors and attitudes that, in turn accentuate school violence perpetration for middle school students in California. Furthermore, this study supports the implications of previous research that indicates school risky peer group factors play a crucial role in determining the extent problems will manifest [7, 36–38, 55, 56]. Future research should explore the pattern of associations between other school risk and protective behaviors and attitudes, gang membership, and school violence perpetration and victimization.
In summary, this study provides empirical and conceptual linkages between the gang and school violence literatures. However, longitudinal studies are necessary to examine causal associations. Additionally, school-level analyses that examine how proportions of gang members within a school impact the associations between school risk and protective behaviors and school violence should be strongly considered in future research. Studies that collect information from multiple school sources, such as teachers, administrators and peers, would provide comparative data that would be useful in determining what factors consistently influence the associations between school risks and protective behaviors and attitudes, gang membership and school violence behaviors.
Conflict of interest statement
None declared.