


Abstract
Objective Identify profiles of functioning in families of children with asthma and examine whether profile membership predicts subsequent child mental and physical well-being. Methods Primary caregivers and children (N = 1,030) from the Childhood Asthma Management Program completed questionnaires assessing family functioning and child adaptation at five time points. Asthma severity was also assessed via spirometry. Results Latent profile analyses identified a four-profile solution as best fitting the data: cohesive, permissive, controlling/disengaged, and controlling/enmeshed families. Distal outcome analyses using Bolck–Croon–Hagenaars techniques suggested that children from families that were more cohesive had fewer internalizing and externalizing symptoms. These associations remained stable across time. Family profiles did not differ with regards to child asthma severity. Conclusion Results highlight the importance of looking beyond the effects of distinct components of family functioning and instead using pattern-based approaches. Recommendations for incorporating screenings and services for families in pediatric care settings are provided.
Asthma is the most prevalent pediatric chronic illness, affecting approximately 10% of children and adolescents in the United States (Center for Disease Control and Prevention, 2013). Effective treatment options can ameliorate asthma symptoms, allowing most children to lead a relatively active life. Nonetheless, many children continue to experience poor asthma control (Gustafsson, Watson, Davis, & Rabe, 2006). In fact, in 2010, 22.2% of children in the United States visited emergency rooms for asthma-related issues, 5.5% were hospitalized, and 48.6% missed at least 1 day of school (CDC, 2013). The public health significance of pediatric asthma is profound.
The family, as the primary context of development for children, is where the majority of asthma management takes place (Kaugars, Klinnert, & Bender, 2004). As such, linking aspects of family functioning to child mental and physical health outcomes in pediatric asthma has been of central interest to researchers for decades (Minuchin et al., 1975). It is now understood that the challenges of managing a child’s asthma can place significant strain on families by introducing additional responsibilities that can adversely impact family members’ quality of life (QOL) and psychological well-being (Everhart, Fiese, & Smyth, 2008; McQuaid, Kopel, & Nassau, 2001). Further, family burden and overall family climate are associated with adherence to medical treatments and child health (Fiese & Wamboldt, 2000).
Dynamic, interactive processes by which the family, as a group, navigates the challenges of managing chronic illness (Fiese, Rhodes, & Beardslee, 2013) are less understood. By focusing specifically on group-level processes, one can account for the overall family climate including the active role of individual members and the child (Sameroff & Fiese, 2000). For example, McQuaid and colleagues (2005) used an interview, the Family Asthma Management System Scale, to understand how families manage childhood asthma, with a specific emphasis on examining strengths and weaknesses of the family in various domains of functioning. The present study extended this work by using a pattern-based approach to identify categories of family functioning and their associations with child adjustment and asthma severity.
In prior research, several discrete, family-level characteristics have been consistently associated with child mental health, including family cohesion, communication, organization, and control. Among youth with and without asthma, families characterized as highly cohesive have fewer parent- and teacher-reported internalizing and externalizing symptoms (Lucia & Breslau, 2006; Reichenberg & Anders, 2005). Similarly, children from families with more positive communication during mealtimes reported better asthma-related QOL compared with those from more conflicted families (Fiese, Winter, & Botti, 2011). Family organization and routines are also important to children’s adjustment to asthma, as they can enhance medication adherence and, in turn, child QOL (McQuaid et al., 2005). Literature on the effects of familial control on mental health in children with asthma is less clear; some studies have identified links between over-control and child mental health and others have not (Fiese et al., 2008; Van Der Bruggen, Stams, & Bogels, 2008).
In addition to child psychological adjustment, the family climate also significantly influences asthma severity and medication management (Kaugars et al., 2004). The psychosomatic model of illness proposed by Minuchin and colleagues (1975) aimed to highlight these patterns of influence by suggesting that the structure and organization of families may significantly impact children’s asthma severity. Research traditionally supported these models, and later research went on to identify mechanisms of influence. For instance, research supports pathways from family functioning to child asthma severity via asthma medication (Kaugars et al., 2004) and through bio-psychological mechanisms. In these bio-psychological pathways, the family environment is thought to affect a child’s emotional well-being, causing changes in cholinergic activation or in the hypothalamic pituitary axis and thus influencing asthma severity (Wood et al., 2008).
Together, past research has delineated several characteristics that are considered integral for optimal family functioning and child mental and physical health outcomes, both in general child developmental contexts and in pediatric illness settings. Despite calls for research examining how family functioning, conceptualized more comprehensively, influences children’s health outcomes in pediatric asthma contexts, particularly within longitudinal designs (see Kaugars et al., 2004), research to date remains scarce.
Integration of distinct family characteristics into typologies using pattern-based analyses may portray a more accurate image of how family strengths and deficits work together to influence child outcomes (Mandara & Murray, 2002). These analyses differ from the more typical variable-based approaches in that they focus on similarities and differences in responses among study participants (Berlin, Williams, & Parra, 2014). In the general child and family literature, person-based approaches have characterized families into distinct categories based on multiple characteristics; findings conflict, however, on the number and nature of these classes. For example, research theoretically rooted in family process models—such as the Circumplex model that emphasizes family flexibility, cohesion, and communication within family interaction/relationship climate—has identified three (cohesive, conflictual, and defensive-neglectful; Mandara & Murray, 2002) to six (cohesive, flexible, disengaged, enmeshed, rigid, and chaotic; Oshri et al., 2015) family typologies. In literature based in family systems theories, research has consistently identified family profiles that align with Minuchin’s (1975) emphasis on family organization (i.e., boundaries and role maintenance); whether derived through cluster analysis or latent profile analysis (LPA) approaches, findings tend to support at least three central family profiles (cohesive, enmeshed, and disengaged), which relate meaningfully to children’s psychosocial outcomes (Sturge-Apple, Davies, & Cummings, 2010).
To our knowledge, few studies to date have examined family profiles in the pediatric literature. Fedele and colleagues (2016) identified four profiles of family adaptation to their children’s food allergy (FA) based on management behaviors, parental and child anxiety, and global integration of these skills into daily family life. These profiles were associated with differences in caregiver QOL, maternal and child anxiety, and management of FA. In consideration of broader family characteristics, Missotten, Luyckx, & Seiffge-Krenke (2013) used cluster analysis to identify four family profiles—cohesive, controlling, conflictual, and balanced—of children with type 1 diabetes. Cohesive families were characterized by a strong sense of unity and low levels of conflict and control; conflictual families had high conflict and low unity; controlling families had high levels of control or rigidity in their rules; and balanced families reported high levels of unity and organization, moderate control, and low conflict. The authors found that adolescents from cohesive and balanced families exhibited fewer internalizing and externalizing symptoms, and healthier self-concepts, than children from controlling and conflictual families (Missotten et al., 2013).
The current study expanded upon prior research with family profiles by focusing on children with asthma and drawing from a large, nationally representative sample. The first aim of this study was to employ a LPA approach to identify homogeneous groups/profiles of families based on structural and functional characteristics that are important in families of children with pediatric asthma: conflict, communication, warmth, control, and organization. Given the lack of consensus in general family literature, and the fact that there are illness-specific demands in families of pediatric populations (e.g., medication management, regular physician visits, adaptation to illness stressors), we hypothesized that four profiles would emerge: cohesive, conflictual, controlling, and balanced families (Missotten et al., 2013). The second aim was to examine predictive associations between these profiles and later child psychological outcomes and pulmonary function. Based on broader family-systems-based research, it was hypothesized that children in families characterized by greater conflict and less cohesion (i.e., conflictual and controlling profiles) would exhibit poorer mental and physical health outcomes (Kaugars et al., 2004; Wood et al., 2008). Given known discrepancies in caregiver and child report of child symptomatology (Treutler & Epkins, 2003), we also tested predictive models using both caregiver and youth symptom reports. Finally, we examined whether evidenced patterns of association would hold over time.
Methods
Data were drawn from the Childhood Asthma Management Project (CAMP) national data set. The original aim of the multicenter, masked, randomized CAMP clinical trial was to examine the effectiveness of two anti-inflammatory medications (budesonide and nedocromil) in relation to a third placebo/control condition on children’s asthma progression and pulmonary growth. With support from the National Heart, Lung, and Blood Institute, children and their families were followed for 5–6.5 years. Other outcomes of interest assessed included patient-reported asthma symptoms, psychosocial well-being, and family functioning. Further information detailing the CAMP protocol, rationale, and methods has been previously published (Childhood Asthma Management Program Research Group, 1999).
Participants
In this study, 1,041 children, ages 5–12 years, and their primary caregivers (85.3% mothers) were recruited via clinics, hospitals, schools, and the general population at eight institutional review board-approved sites in North America. Inclusion criteria included a documented asthma diagnosis, daily medication use for at least 6 months in the year before recruitment, methacholine sensitivity evidenced by a 1-s Forced Expiratory Volume (FEV1) ≤12.5 mg/ml, asthma symptom presence on at least 8 days during the 28-day screening period, and no other major medical conditions.
At the time of recruitment, children enrolled in the CAMP study had mild (47.8%) to moderate (52.2%) asthma that was diagnosed an average of 5 years (SD = 2.7) ago. In brief, children demonstrated mild to moderate asthma severity by having an asthma symptom score of ≥1 on a scale of 0–3 and/or a morning or evening peak expiratory flow rate <80% of the personal best post-bronchodilator flow on at least 8 of the 28-day screening period. Children were excluded if they received more than eight albuterol puffs on 3 days, had >1.5 asthma-related night awakenings per week, and needed other medication to control their asthma during this period (Childhood Asthma Management Program Research Group, 1999).
From the original sample, 11 participants had missing data on measures of family functioning, and thus were excluded from this study. The final sample consisted of 1,030 children (40.2% girls and 59.8% boys; M age = 8.95, SD = 2.12); 68.4% of families identified their children’s race/ethnicity as White, 13.3% as African American, 9.4% as Hispanic, and 8.9% as “Other.” Approximately 86.6% of children who participated in this study resided in two-caregiver households, whereas 13.4% lived in a single-caregiver household. Additionally, 6.4% of families reported an annual household income <$15,000; 16.6% had an income between $15,000 and 29,999; 32.2% had an income between 30,000 and 49,999; and 40.9% had an income >$50,000 per year. Socioeconomic status information was missing for 3.9% of the sample.
Procedures
Interested primary caregivers and children were invited for an in-person screening, during which consent and assent were obtained and asthma educational information was provided. Families participated in four screening/baseline visits, including a 28-day period of daily diary recordings of asthma symptoms. During the fourth visit, caregivers and children completed a set of baseline measures (including caregiver-reported family functioning) before random assignment into one of the three treatment groups. Psychosocial outcome measures were re-administered annually for the following 4 years. Physiological measures, including the primary FEV1 methods, were obtained 2 months after baseline and subsequently in 4-month increments. For this study, data from baseline and four annual follow-up time points were used.
Measures
Family Environment Scale
At the initial baseline visit, the primary caregiver completed the Family Environment Scale (FES), a 90-item true-false measure, used to assess the overall environment of the family unit (Moos & Moos, 1994). For this study, we used the following subscales tapping dimensions of family structure and relationships/interactions: cohesion (amount of family support), expressiveness (openness in communication), conflict (degree of anger and disagreement), organization (clear roles and structure in family responsibilities), and control (rigidity of rules and procedures in the family). The FES has been widely used in clinical, research, and program evaluation settings, has evidenced adequate internal consistency estimates (.61–.78), and distinguishes between distressed and normal families (Moos & Moos, 1994). Recent studies have established marginal to good internal consistencies for separate FES subscales (.55–.88; Missotten et al., 2013; Pai et al., 2008).
Child Behavior Checklist
At baseline and each annual visit, caregivers completed 118 items assessing the frequency of child behavioral and emotional symptoms (Achenbach, 1991). For this study, T-scores for internalizing (i.e., depression and anxiety symptoms) and externalizing (i.e., behavioral, attention deficit/hyperactivity disorder, and oppositional concerns) behaviors were used. The Child Behavior Checklist (CBCL) scales have demonstrated good test–retest reliabilities (.89 and .93, respectively) and have successfully distinguished between clinical and nonclinical populations.
Youth Self-Report
Children who were at least 11 years old at the 1-year follow-up period (n = 303) rated their own internalizing and externalizing symptoms on the 102-item Youth Self-Report (YSR; Achenbach, 1991). These children also rated their symptoms at the 2-, 3-, and 4-year follow-up time points. The YSR is the parallel self-report form to the CBCL. For this study, the YSR T-scores of internalizing and externalizing behaviors were used.
PulmonaryFunction
Per guidelines of the American Thoracic Society (Gardner, 1988), children’s pulmonary function was assessed via FEV1. Before administration of albuterol, raw FEV1 scores were collected using a Collins-Stead Wells dry-seal Survey III spirometry device interfaced to a computer. Staff coached children on the appropriate way to perform a pulmonary function test to obtain measurements based on maximal effort. To account for variations in raw FEV1 scores associated with children’s age, height, sex, and ethnicity, the percentage of predicted FEV1 scores based on these characteristics was calculated. Higher predicted FEV1 values signified better pulmonary function in the context of participant demographic characteristics. Testing took place at least 4 hr after the last use of a short-acting bronchodilator and at least 24 hr after the last use of a long-acting bronchodilator.
Statistical Analyses
Two steps were used to test study hypotheses. First, LPA in Mplus Version 7.3 was used to identify latent profiles of family functioning at the baseline time point (Muthen & Muthen, 1998-2014). LPA is a person-centered, latent variable mixture modeling technique that allows researchers to identify patterns of similar data among individuals (or in this case families) rather than among variables. In LPA, a heterogeneous population’s data are analyzed to derive profiles of individuals (or in this case, individual families) with similar means on continuous indicator variables (Berlin et al., 2014). Full Information Maximum Likelihood was used to estimate missing data on variables of interest (Little et al., 2014).
To identify the best fitting model, we used five model indices: Bayesian Information Criteria (BIC), Akaike Information Criteria (AIC), entropy, Lo-Mendell-Ruben Test (LMR; Lo, Mendell, & Rubin, 2001), and the Bootstrap Likelihood Ratio Difference Test (BLRT; Nylund, Asparouhov, & Muthen, 2007). Lower values on the former two fit statistics (i.e., AIC and BIC) indicate better model fit. The AIC and BIC both provide information on how well each model fit the data, with the BIC being favored when there is a discrepancy among these statistics (Nylund et al., 2007). Entropy is used to measure accuracy of classification, with higher values of entropy indicating better classification. The LMR and the BLRT compare each model with the neighboring model with one less class to identify whether there is a significant improvement in model fit (Berlin et al., 2014). When the p value of the tests is not significant for a model with an added class, it can be concluded that there is no incremental value in adding a class. If the number of classes is unclear, the models are compared with regards to parsimony, fit indices, and theory (Berlin et al., 2014).
Second, to examine predictive relationships between family profiles and child outcomes, distal outcome analyses were conducted using the one-step Bolck–Croon–Hagenaars (BCH) approach (Asparouhov & Muthen, 2014). This model estimation method does not affect latent class model membership and also minimizes estimation errors usually associated with multiple-step approaches (Asparouhov & Muthen, 2014). The BCH method was used to evaluate differences in means of the family profiles on continuous auxiliary variables (i.e., child health outcome variables). The BCH approach was chosen over other multi-step approaches because it performs well against inequality of variance across classes (Asparouhov & Muthen, 2014). It is important to note that YSR outcomes were examined via separate analyses with only the subset of youth included.
Results
Table I summarizes the means, standard deviations, and correlations among variables. Mean responses on the FES scales ranged from 48.72 (conflict) to 57.98 (cohesion), indicating that on average, families had responses that were similar to those obtained in the original validation study (Moos & Moos, 1994). In this sample, 99 (9.6%) and 162 (15.7%) parents rated their children’s externalizing and internalizing scores in the clinical range at baseline. Bivariate correlations indicate significant, negative associations between family cohesion and child internalizing/externalizing symptoms and between family expressiveness and child internalizing/externalizing symptoms 1 year later. Associations between family variables and child pulmonary function (FEV1) were not significant.
Table I. Descriptive Statistics and Correlations Between All Variables of Interest
| Variable | 1. | 2. | 3. | 4. | 5. | 6. | 7. | 8. | 9. | 10. |
|---|---|---|---|---|---|---|---|---|---|---|
| Cohesion | – | |||||||||
| Expressiveness | .34*** | – | ||||||||
| Conflict | −.34*** | −.15*** | – | |||||||
| Organization | .33*** | .002 | −.26*** | – | ||||||
| Control | −.05 | −.24*** | .22*** | .25*** | – | |||||
| CBCL internalizing | −.24*** | −.12*** | .22*** | −.15*** | .06 | – | ||||
| CBCL externalizing | −.22*** | −.11*** | .32*** | −.16*** | .11*** | .59*** | – | |||
| FEV1PPa | .07 | .05 | .01 | .01 | .05 | .02 | .02 | – | ||
| YSR internalizing | −.11* | −.03 | .15** | −.11** | .01 | .23** | .13* | −.04 | – | |
| YSR externalizing | −.10 | .02 | .18** | −.05 | .02 | .09 | .29** | −.13 | . 62** | – |
| M | 57.98 | 56.27 | 48.72 | 53.82 | 54.67 | 51.61 | 49.21 | 95.84 | 47.48 | 47.16 |
| SD | 11.54 | 11.21 | 10.78 | 11.65 | 9.84 | 10.01 | 9.81 | 12.75 | 10.39 | 9.86 |
Note. CBCL = Child Behavior Checklist; YSR = Youth Self-Report. *p < .05, **p < .01, *** p < .001. N = 1,030. N = 303 for youth self-reports of internalizing and externalizing symptoms.
Percentage of predicted 1-s Forced Expiratory Volume (FEV1PP): higher scores indicate better pulmonary functioning.
All 1,030 included families in this study completed measures of family, child, and pulmonary function at the initial time point. Of these participants, 981, 953, 932, and 891 completed measures 1, 2, 3, and 4 years later, respectively. When comparing the 788 participants who completed measures at all five time points with those who had missing data from at least one time point, the groups did not differ significantly with regard to any family variable with the exception of family conflict F(1, 1028) = 5.60, p = .02. Specifically, families who had missing data reported greater levels of conflict (M = 50.69, SD = 10.70) in comparison with those who participated consistently throughout the 5-year period (M = 48.30, SD = 10.76).
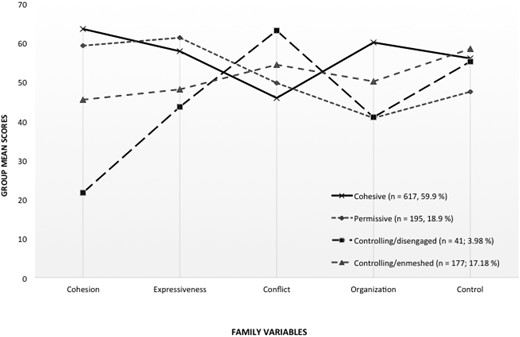
Emergent profiles of family functioning based on Family Environment Scale characteristics.
Latent Profile Analysis to Determine Number of Family Profiles
| Number of latent profiles | Parameters estimated | Akaike Information Criteria | Bayesian Information Criteria | Lo Mendell Rubin p-value | Bootstrap likelihood ratio test p-value | Classification quality (entropy) |
|---|---|---|---|---|---|---|
| 1 | 10 | 39313.81 | 39363.18 | – | – | |
| 2 | 16 | 38783.39 | 38862.38 | .000 (2 vs. 1) | .000 | .89 |
| 3 | 22 | 38593.78 | 38702.41 | .024 (3 vs. 2) | .000 | .87 |
| 4 | 28 | 38439.79 | 38578.03 | .002 (4 vs. 3) | .000 | .74 |
| 5 | 34 | 38415.04 | 38582.91 | .157 (5 vs. 4) | .000 | .70 |
Note. Bold row represents chosen profile solutio.
Profile mean scores on each family variable were categorized using statistical cutoffs consistent with the interpretation of T-scores (see Table III). Compared with families in other profiles, cohesive families (n = 617, 59.9%) were characterized by higher cohesion, expressiveness, organization, and control, as well as lower conflict. In permissive families (n = 195, 18.9%), there was higher expressiveness and cohesion but lower control and organization. In contrast, controlling/disengaged families (n = 41; 3.98%) had relatively low cohesiveness, expressiveness, and organization but higher conflict and control. Finally, controlling/enmeshed families (n = 177; 17.18%) had more moderate levels of cohesion, expression, and organization, as well as higher levels of conflict and control. We chose to label the ‘controlling/enmeshed’ profile differently than the hypothesized ‘balanced’ profile, as families were characterized by high levels of control, but also reported greater cohesion and expressiveness than the disengaged profile.
Categorical Descriptions of Family Profiles
| Variable | Cohesive (n = 617, 59.9%) | Permissive (n = 195, 18.9%), | Controlling/disengaged (n = 41; 3.98%) | Controlling/enmeshed (n = 177; 17.18%) |
|---|---|---|---|---|
| Cohesion | High | Above average | Very Low | Low average |
| Expressiveness | Above average | Above average | Low average | Average |
| Conflict | Low average | Average | High | High average |
| Organization | Above average | Below average | Below average | Average |
| Control | High average | Low average | High average | Very high |
Note. Group means were placed in categories based on previously used classifications of T-scores. The following labels were used to describe each category: Very Low (≤ 32), Low (33–37), Below Average (38–42), Low Average (43–47), Average (48–52), High Average (53–57), Above Average (58–62), High (63–67), and Very High (≥68). Adapted from (Willis & Dumont, 1998).
Demographic predictors were assessed via logistic regression to determine differences in profile membership as a function of child gender, age, and CAMP treatment group; no significant differences existed (p’s > .05). Nonetheless, treatment group was included as a covariate in predictive models to account for any potential effects on outcomes or change.
The one-step BCH approach was used to examine mean differences for the auxiliary variables (child internalizing, externalizing, and pulmonary function) across family profiles (Asparouhov & Muthen, 2014). We used assessments of these outcome variables (e.g., CBCL internalizing scores) at baseline. We then tested the predictive relationship between profile membership and these outcomes at subsequent time points while controlling for baseline levels of these outcome variables. Significant differences were found across our four-family groups with regards to caregiver-reported child externalizing and internalizing symptoms 1 year later even after controlling for baseline levels of these symptoms (see Table IV). Specifically, children from controlling/disengaged and controlling/enmeshed families had significantly greater externalizing scores than those in cohesive (χ2 = 29.53, p < .001 and χ2 = 38.39, p < .001) or permissive families (χ2 =12.38, p < .001 and χ2 = 9.96, p = .002, respectively). These differences remained significant at the 2-year, 3-year, and 4-year follow-up period. Whereas caregivers from controlling/disengaged and controlling/enmeshed families reported greater internalizing symptoms for their children in comparison with those from cohesive profiles (χ2 = 17.55, p < .001 and χ2 = 41.23, p < .001, respectively), there were no significant mean differences when compared with the permissive group’s internalizing symptoms. In fact, the permissive profile also had parents who rated their children as significantly more anxious than those in the cohesive profile (χ2 = 13.20, p < .001). There were no differences across profiles on children’s pulmonary functioning (percent of predicted FEV1) at baseline or any subsequent time point with initial levels included as a control (see Table IV).
Table IV. Estimated Means of Child Adjustment Across Family Profiles
| Cohesive families | Permissive families | Controlling/ disengaged | Controlling/ enmeshed | Comparison | Group differences | |||||
|---|---|---|---|---|---|---|---|---|---|---|
| Variable | M | SE | M | SE | M | SE | M | SE | χ2, p-value | |
| CBCL IntBa | 50.84 | 0.44 | 54.04 | 0.87 | 58.02 | 2.02 | 57.84 | 0.85 | χ2(3,1030) = 63.85*** | CD & CE & P > COH |
| CBCLInt1 | 49.40 | 0.45 | 53.30 | 0.90 | 56.93 | 1.74 | 55.89 | 0.88 | χ2(3,1030) = 60.22*** | CD & CE & P > COH |
| CBCLInt2 | 48.74 | 0.49 | 53.74 | 0.98 | 51.03 | 2.31 | 56.36 | 0.96 | χ2(3,1030) = 57.36*** | CE & P > COH |
| CBCLInt3 | 49.20 | 0.51 | 51.67 | 1.03 | 55.54 | 1.83 | 55.21 | 0.91 | χ2(3,1030) = 40.73*** | CD & CE & P > COH |
| CBCLInt4 | 48.59 | 0.53 | 51.24 | 1.04 | 52.88 | 1.75 | 54.01 | 0.97 | χ2(3,1030) = 27.84*** | CD & CE & P > COH |
| CBCLExtBb | 48.26 | 0.41 | 50.67 | 0.79 | 57.61 | 1.61 | 55.02 | 0.85 | χ2(3,1030) = 77.68*** | CD & CE & P > COH; CD & CE > P |
| CBCLExt1c | 47.16 | 0.43 | 49.63 | 0.86 | 55,76 | 1.53 | 54.05 | 0.99 | χ2(3,1030) = 65.27*** | CD & CE & P > COH; CD & CE > P |
| CBCLExt2 | 46.93 | 0.45 | 49.07 | 0.89 | 54.59 | 1.80 | 54.90 | 0.99 | χ2(3,1030) = 65.35*** | CD & CE & P > COH; CD & CE > P |
| CBCLExt3 | 47.26 | 0.46 | 48.66 | 0.86 | 55.49 | 1.80 | 52.74 | 1.01 | χ2(3,1030) = 40.79*** | CD & CE > COH & P |
| CBCLExt4 | 46.82 | 0.47 | 47.82 | 0.92 | 55.98 | 2.18 | 51.92 | 0.93 | χ2(3,1030) = 38.45*** | CD & CE & P > COH; CD & CE > P |
| YSR Int1 | 45.10 | 0.84 | 50.37 | 1.30 | 47.71 | 3.86 | 49.47 | 1.64 | χ2(3,303) = 12.25** | P & CE > COH |
| YSR Int 2 | 44.49 | 0.84 | 48.07 | 1.34 | 44.00 | 2.36 | 48.61 | 1.40 | χ2(3,303) = 9.70* | P & CE > COH |
| YSR Int 3 | 43.25 | 0.86 | 46.55 | 1.36 | 43/94 | 1.87 | 46.69 | 1.57 | χ2(3,303) = 5.73 | P & CE > COH |
| YSR Ext1d | 45.60 | 0.84 | 48.47 | 1.09 | 46.42 | 3.92 | 49.81 | 1.71 | χ2(3,303) = 6.39, p =.09 | P & CE > COH |
| YSR Ext2 | 45.38 | 0.86 | 50.01 | 1.14 | 44.35 | 4.54 | 50.83 | 1.64 | χ2(3,303) = 13.72** | P & CE > COH |
| YSR Ext3 | 46.73 | 0.81 | 48.71 | 1.31 | 48.31 | 3.85 | 48.50 | 1.69 | χ2(3,303) = 1.90 | |
| FEV1PPBe | 95.21 | 0.55 | 94.33 | 1.14 | 90.87 | 2.83 | 95.18 | 1.15 | χ2(3,1030) = 2.51 | |
| FEV1PPT1 | 95.29 | 0.59 | 95.25 | 1.28 | 89.34 | 3.46 | 95.99 | 1.29 | χ2(3,1030) = 3.13 | |
| FEV1PPT2 | 95.15 | 0.58 | 93.59 | 1.27 | 91.10 | 2.78 | 96.18 | 1.27 | χ2(3,1030) = 3.58 | |
| FEV1PPT3 | 94.77 | 0.59 | 94.87 | 1.24 | 91.08 | 3.43 | 95.24 | 1.24 | χ2(3,1030) = 1.26 | |
| FEV1PPT4 | 95.79 | 0.61 | 95.96 | 1.22 | 94.17 | 3.10 | 95.17 | 1.31 | χ2(3,1030) = 0.49 | |
Note. *p < .05, **p < .01, ***p < .001. N = 1,030 for all measures except YSR. N = 303 for youth self-reports of internalizing and externalizing.
Parent-reported child internalizing symptoms; bParent-reported child externalizing symptoms; cYouth self-reported internalizing symptoms; dYouth self-reported externalizing symptoms; ePercentage of predicted 1-s Forced Expiratory Volume (FEV1PP): higher scores indicate better pulmonary functioning.
Family profiles from the subset of 303 families, whose children provided self-reported symptom ratings, differed significantly from one another with regards to internalizing symptoms 1 and 2 years later (χ2 (3,303) = 12.25, p = .007 and χ2 (3,303) = 9.70, p = .02, respectively). Specifically, children in this subset from permissive and controlling/enmeshed families reported greater mean internalizing scores than those in cohesive profiles (χ2 = 9.714, p = .002 and χ2 = 5.433, p = .020, respectively). Whereas overall family profiles did not differ significantly at the third-year follow-up period, permissive and controlling/enmeshed families continued to have children who reported greater mean internalizing scores than those in cohesive profiles (χ2 = 3.59, p = .05 and χ2 = 3.57, p = .05, respectively). There were no overall significant group differences across youth self-reported externalizing symptoms during the first year (χ2 (3,303) = 6.39, p = .09). However, adolescents from cohesive family profiles reported significantly fewer externalizing symptoms than those from permissive (χ2 = 3.61, p =.05) and controlling/enmeshed profiles (χ2 = 4.51, p = .03). These family differences in self-reported externalizing symptoms emerged the following year (χ2 (3,303) = 13.72, p = .003). Specifically, children from cohesive families continued to report significantly fewer symptoms than those from permissive (χ2 = 8.75, p = .003) and controlling/enmeshed families (χ2 = 8.41, p = .004).
Discussion
This study identified theoretically meaningful profiles of family functioning in children with asthma and examined the effects of profile membership on child psychological and pulmonary function outcomes at multiple future time points. Findings contribute to the body of research on family functioning, examining the predictive association between distinct family variables and child adaptation in pediatric asthma (e.g., Fiese et al., 2011; Lucia & Breslau, 2006). Results also highlight the utility of using pattern-based approaches to conceptualize the comprehensive nature of family functioning.
In this study, four profiles of family functioning emerged: cohesive, permissive, controlling/disengaged, and controlling/enmeshed typologies. Similar to previous studies, the majority of families reported being cohesive, with high levels of warmth and structure and low levels of conflict. A substantial percentage (19%) of caregivers rated their families consistent with permissive patterns of functioning, similar to those in previous research (Oshri et al., 2015; Missotten et al., 2013). However, profiles generated in this study differed from previously identified clusters of family functioning in that two profiles with high control also emerged. The controlling/enmeshed and controlling/disengaged family profiles evidenced similar control and organization, but had lower and more moderate levels of cohesion and expressiveness, respectively. Results may reflect the nuances of family functioning behaviors within diverse contexts (e.g., different illness contexts) and highlight the specificity of pattern-based approaches. Further research is needed to derive and confirm family profiles in asthma and other pediatric chronic illness groups and to examine underlying mechanisms for differences in family profiles across contexts.
As expected, mean levels of children’s psychosocial symptomatology, as reported by caregivers, differed across family functioning profiles. Children from cohesive families experienced the fewest subsequent emotional and behavioral difficulties. Conversely, children from controlling/disengaged and controlling/enmeshed families evidenced elevated internalizing and externalizing symptoms. Together, results suggest that the combination of positive relationships (i.e., high group cohesion, support for expressiveness, and low conflict) and moderate structure (i.e., moderate control and organization that convey parental role maintenance without rigidity) may help promote optimal child psychosocial functioning. This may be because this pattern is most able to convey to children that the family is a source of support and security to children (e.g., Fiese et al., 2011; Lucia & Breslau, 2006; Winter et al., 2011). High levels of control that are not balanced with high security-provoking organization, warmth, and communication do not confer the same advantages for children (Rosland, Heisler, & Piette, 2012). These patterns of results held over subsequent points of assessment.
Youth responses from the subset of families who had children 11–13 years old at the 1-year follow-up varied from caregiver responses with regard to psychosocial outcomes based on family profile membership. Although caregiver and adolescent reports agreed that children in cohesive families had the lowest levels of symptomatology, other findings were more nuanced. For example, youth from permissive and controlled/enmeshed families reported the greatest levels of internalizing symptoms. Discrepancies existed between caregiver and adolescent self-reports on internalizing symptoms, and these differences may be affected by parent–child variables (e.g., conflict and acceptance) that have been identified in past studies (Treutler & Epkins, 2003). We add to these findings by providing different family typologies in which these different perspectives may exist. With regard to externalizing symptoms, while mean differences across all groups were only marginally significant, adolescents from controlling/enmeshed and permissive families reported more symptoms than those from cohesive families. Findings support the notion that children may feel less secure when organization and control are low in the family (Kaugars et al., 2004), which may be particularly salient to children with asthma and other illnesses whose health outcomes are reliant on family organization (Winter et al., 2011).
Contrary to expectations, no significant differences in pulmonary function existed across family profiles at baseline or subsequent time points. These results are inconsistent with past studies that have shown relationships between family functioning and child asthma outcomes (Fiese & Wamboldt, 2000; Wood et al., 2008). This could reflect the influence of methods used in this study (e.g., a single reporter of both family functioning and child well-being). Past studies have tended to focus on associations between specific family dimensions (e.g., family routines, conflict, and organization) and asthma management behaviors (Fiese & Wamboldt, 2000), whereas this study used a more holistic operationalization. For example, while increased family conflict has been associated with poorer pulmonary function (Wood et al., 2008), the simultaneous impact of other facets of family functioning was not tested. Our findings imply that family profiles may be distinct in how they predict distal psychosocial outcomes versus disease-specific outcomes in children with asthma, at least for children with mild to moderate asthma.
Findings from this study extend the current pediatric and family literature in several ways. First, typologies of family functioning could explain the variability of families’ effects on child outcomes in past studies. It is important to look beyond specific domains of family climate (e.g., control, conflict, communication) and examine the effects of functional and structural characteristics jointly. It is also prudent to extend this work to families who have the unique added challenges associated with managing and coping with pediatric illness; thus, we complement Missotten et al.’s (2013) study of pediatric diabetes by focusing on children with asthma. In addition, this study supports the importance of examining the effects of the whole family on child adaptation in addition to studying specific caregiver–child relationships. Finally, in this study we built upon past findings by using LPA, a model-based technique used to describe the distribution of data, assess probabilities of class membership, evaluate model fit, and predict differential outcomes from class assignment (Lanza & Cooper, 2016). We were able to do so by capitalizing on the CAMP sample, which is not only large but also nationally representative and thus may be more generalizable.
Limitations
Our findings must be considered in light of a number of limitations. This study assessed family functioning via primary caregiver report only on the FES. There is general consensus that, although there may be slight discrepancies in informant ratings, multi-rater multi-method (MRMM) approaches are desirable to minimize biases in measuring psychological constructs (Smith, 2007). Similarly, although there were significant associations between parent-reported family profiles and child-reported symptoms, the stronger findings with parent-reported outcome variables (e.g., CBCL) may be partially attributable to common method variance. Future studies using MRMM designs may also address this limitation by minimizing shared variance among predictor and outcome variables. Additionally, internal consistencies for measures used with this sample could not be obtained due to the sole availability of summarized scores from this data set. Future studies that incorporate more objective observational measures of family functioning, such as mealtime behaviors, may be helpful in obtaining a more accurate view of the family group structure and dynamics (Fiese et al., 2011).
Another limitation worth noting is the wide age range of children in this study (5–12-year-olds) and the age of the data (1990–1995). Though we attempted to address the former point by replicating our four-profile solution with the subset that completed the YSR, research would benefit from deriving profiles with specific age-groups. As for the latter point, because asthma prevalence rates continue to rise, replication with children and families currently experiencing asthma is necessary. Furthermore, although this sample is diverse, 68.4% of participants were Caucasian and all were willing to participate in a longitudinal asthma medication trial, possibly contributing to a selection bias. It is important to consider the fact that pediatric asthma disparities persist and examining profiles among and within racial/ethnic groups is warranted (CDC, 2013). Additionally, without the inclusion of a control group it cannot be determined whether the family profiles derived differ from those from families of children without asthma.
Similarly, this study was specific to a pediatric population with mild to moderate asthma, and attempts to analyze profiles in other pediatric settings are needed. Further attempts to derive profiles in a sample with severe asthma, where illness management may place additional demands on family members, are needed. Additionally, this study examined associations between initial profile membership and child outcomes at multiple, subsequent time points. Given that family functioning is not static, future research may wish to examine changes in profile membership and family structure across time. Finally, families with higher conflict were less likely to participate in follow-up sessions in this study, suggesting the potential utility in outreach for high-risk, hard-to-retain families.
Clinical Implications and Future Directions
Although replication is needed, our findings may have implications for pediatric providers. As integrated primary care becomes more prevalent, psychologists and other behavioral health specialists are increasingly able to provide screening and brief intervention in conjunction with children’s medical treatment (Earls & Hay, 2006). Families in pediatric settings that endorse low levels of organization or warmth and communication, particularly if in the context of high control or conflict, may benefit from targeted interventions. More targeted family-based interventions may, in turn, improve children’s psychosocial functioning.
There are several ways in which future research may build upon these findings. First, family profiles did not differ by child age or child gender in our study. This is comparable with previous literature that indicates family composition is fairly stable in early and middle childhood years, particularly with regards to family communication and cohesion (Loeber et al., 2000). However, these characteristics tend to shift slightly during adolescence, with decreases in parental monitoring and parent–child communication (Loeber et al., 2000). Therefore, future studies would benefit from the examination of these profiles and differences in membership across various developmental periods. Additionally, it would be important to incorporate family asthma management behaviors in future pattern-based analyses. As for further disentangling the association between family profiles and asthma severity, incorporating more frequent measures of asthma control or lung function may be necessary. For example, ecological momentary assessment designs can provide a more accurate depiction of daily fluctuations in lung function (through handheld spirometers) and daily asthma symptoms. Finally, future studies may benefit from examining the effects of family profile membership on individuals’ asthma management behaviors, such as medication adherence, self-efficacy, physical activity, and exposure to allergens, particularly with attention to time since diagnosis.
Funding
This manuscript was prepared using CAMP research materials obtained from the National Heart, Lung, and Blood Institute (NHLBI) Biologic Specimen and Data Repository Coordinating Center and does not necessarily reflect the opinions or views of the CAMP or the NHLBI.
Conflicts of interest: None declared.
References
