


Abstract
Active lifestyles are related to higher levels of cognitive functioning. Fewer studies have examined the importance of engaging in different activities (activity variety) for cognitive functioning. Moreover, it is unclear whether activity variety in specific domains (i.e., cognitive, physical, or social) is important for cognitive health. The current study examined whether overall activity variety as well as variety in specific domains relate to cognitive functioning.
In Waves 2 and 3 of the Survey of Midlife Development in the United States, 3,337 adults reported their activity engagement and completed a cognitive battery. For longitudinal analyses, 2,049 participants were classified into 4 groups based on their rank ordering of activity variety across 9 years (remained high, increased, decreased, or remained low).
Cross-sectional analyses revealed that overall activity variety was related to higher cognitive functioning over and above activity frequency; physical and social activity variety each contributed significantly and uniquely to this association. Longitudinal analyses revealed that those with consistently low overall activity variety at both waves had lower cognitive functioning at Wave 3 than those with high activity variety at either wave, after adjusting for cognitive functioning at Wave 2. Those with consistently high or increasing social activity variety had higher cognitive functioning at Wave 3 than participants with low activity variety at both waves.
Findings suggest that activity variety, particularly in the social domain, is related to concurrent and future cognitive function across adulthood.
A vast literature discusses the benefits of active lifestyles in midlife and old age. Individuals who participate in more activities regardless of type of activity (cognitive, physical, and social) have better cognitive functioning compared to their less active peers (e.g., Kuiper et al., 2015; Sofi et al., 2011). Yet, most research focuses on the frequency of activities, and does not consider the number of different types of activities (i.e., activity variety), with a few notable exceptions (e.g., Bielak et al., 2019; Lee et al., 2021; Stephan et al., 2014). Further, less is known about whether the potential benefit of activity variety for cognitive functioning is replicated across different activity domains. The current study examined cross-sectional and longitudinal associations of activity variety within cognitive, physical, and social domains with cognitive functioning.
Beyond Activity Frequency: Does Activity Variety Play a Role in Cognitive Functioning?
A large number of studies consistently find that those who frequently participate in activities perform better on cognitive tasks (e.g., Sharifian et al., 2020). In addition to frequency of activities, however, Carlson et al. (2012) found that variety of activities was a stronger predictor of overall cognitive functioning than frequency or levels of activity 9 years later. Since then, a growing number of studies have found that activity variety, defined as a broad range of activities involving physical, cognitive, and social components, is an important protective factor for cognitive health (e.g., Lee et al., 2021; Stephan et al., 2014).
The cognitive reserve hypothesis provides a possible explanation as to why activity is related to better cognitive functioning (e.g., Gelfo, 2019; Vance et al., 2010). This hypothesis predicts that exposure to various stimuli in enriched environments may recruit multiple brain regions, which could be associated with greater structural and functional brain plasticity, including more complex neurological pathways (Eriksson et al., 1998; Mora et al., 2007; Stern, 2012). In a literature review of animal studies, mice exposed to a greater range of different activities involving cognitive, physical, and social components exhibited an increase in neurogenesis and synaptogenesis, contributing to better cognitive functioning (Gelfo, 2019). In human studies, higher levels of cognitive activities are also related to higher levels of cognitive functioning and slower age-related cognitive declines (Agrigoroaei & Lachman, 2011; Eriksson et al., 1998; Stern, 2012; Vance et al., 2010), and to greater cortical and subcortical brain volume (Engvig et al., 2014; Seider et al., 2016).
The benefits of activity variety in maintaining cognitive functioning, as predicted by the cognitive reserve hypothesis, have been observed in other studies. Bielak et al. (2019) found that both activity variety and activity frequency over the past 2 years contributed to cognitive functioning in a community sample of older adults. Another study found that increases in activity diversity (similar to activity variety, operationalized as the breadth and evenness of time spent in seven common daily activities) over 10 years were related to higher overall cognitive functioning and executive functioning at the 10-year follow-up, independent of time spent in each activity (Lee et al., 2021). Nevertheless, there remain several gaps in knowledge on activity variety. Existing studies have often examined activity in general and not within specific domains (e.g., physical vs social activities). By examining the association of activity variety in specific domains with cognitive functioning, we may gain a better understanding of what types of activities are related to cognitive performance and apply this information to intervention studies. The current study extends the previous findings based largely on studies that calculated activity variety across all types of activities reported. In addition to the overall levels, the present study examines how variety within different domains (cognitive, physical, and social) is each related to cognitive functioning in both cross-sectional and longitudinal models.
Activity Engagement in Different Domains and Cognitive Benefits
Although activities often fall in more than one domain (e.g., a debate with friends is both a cognitive and social activity), researchers often place them into one primary category: cognitive, physical, or social (e.g., Chan et al., 2018; Clare et al., 2017). The cognitive reserve hypothesis posits that all of these activities are related to better brain functioning, because all require active cognitive processing, such as sustained attention, memory, and problem-solving. For activities in the physical and social domains, however, researchers have offered additional mechanisms to explain their links to better cognitive functioning, including cardiovascular fitness (for physical activities) and stress-buffering properties (for social activities).
Physical Activity
Researchers have hypothesized that in addition to the cognitive stimulation elicited by different types of physical activities, increased oxygenation to brain regions boosts brain-related functions including neurogenesis, synaptogenesis, and angiogenesis (Dupuy et al., 2015). A review of 11 studies found that physical activity, and particularly aerobic activity, increases cardiovascular functioning, which was related to improved cognitive functioning among older adults (Angevaren et al., 2008). Another study of older adults revealed that increases in physical activity frequency or intensity were related to increased brain functional connectivity, especially intra-subcortical network and frontal-subcortical internetworks that are related to cognitive processes such as memory (Dorsman et al., 2020).
Social Activity
Social activity frequency has also been tied to cognitive functioning, including working memory and executive functioning across adulthood (Lee & Kim, 2016; Ybarra et al., 2008). Social activity involves participating in meaningful social activities and maintaining intimate relationships with others (Adams et al., 2011; Rowe & Kahn, 1997), including activities such as attending social events or providing informal help to others (Lee et al., 2021). Researchers explain links between social activity and cognitive functioning through the cognitive reserve hypothesis. Social interaction requires sustained attention, perspective taking, memory, learning, and problem-solving skills. In addition, social participation in senior centers increases the likelihood of engaging in intellectually stimulating activities such as playing musical instruments (Lee & Byun, 2014; Lee & Kim, 2016). Another hypothesized mechanism whereby social activity is related to better cognition is through its buffering effect on emotional distress. Social support buffers feeling of stress, and higher levels of psychological stress are related to cortisol dysregulation, which in turn is related to worse cognitive performance (e.g., Charles et al., 2021).
Current Study
The current study examined how activity variety is related to cognitive functioning beyond activity frequency. We predicted that activity variety overall and in three specific domains (cognitive, physical, and social) would be associated with better cognitive functioning cross-sectionally. Longitudinally, we hypothesized that those with relatively high or increased activity variety over time would show higher cognitive functioning at the follow-up (adjusting for baseline levels), compared to those with relatively low or decreased activity variety across time. In all cross-sectional and longitudinal models, we included personality, health, and demographic covariates to rule out these possible confounding influences.
Method
Participants and Procedure
Data for the current study were drawn from the Midlife Development in the United States Study (MIDUS), a national sample of community-dwelling adults aged 25–74 assessing behavioral, psychological, and social factors related to overall health and well-being. We used MIDUS at Wave 2 (2004–2006; W2), and Wave 3 (2013–2016; W3), when cognitive functioning was assessed. At W2, 4,206 of the 4,963 survey participants (85%) also completed a telephone-administered cognitive battery, with 3,863 participants (78%) completing all the items in the cognitive battery. From these participants, 3,337 (86% of the 3,863) also provided activity engagement in at least one activity domain and had complete data for the covariates from the surveys. We used the data from 3,337 for the cross-sectional analyses. Of these participants, 2,049 (61%) completed all questions about activity participation and the cognitive battery at W3 9 years later, comprising our longitudinal sample.
Table 1 includes descriptive statistics for the cross- sectional and longitudinal samples and results from attrition analyses. Compared to the participants who only participated at W2 (n = 1,288), longitudinal participants (n = 2,049) were more likely to be younger, female, White, married, working, with fewer chronic conditions, fewer functional limitations, and a higher education level. Longitudinal participants also scored higher on openness and lower on neuroticism, and higher on activity frequency, activity variety, and cognitive functioning at W2 compared to those who dropped from the study.
Descriptive Statistics in Demographic Factors, Activity Variety and Activity Frequency, and Cognitive Functioning Between Nondropouts and Dropouts in the Longitudinal Analysis
| Cross-sectional sample (n = 3,337) | Longitudinal sample (n = 2,049) | Dropouts those who participated in W2 only (n = 1,288) | Attrition analysis | ||||
|---|---|---|---|---|---|---|---|
| M or % (SD) | Range | M or % (SD) | Range | M or % (SD) | Range | t Value | |
| Age | 56.08 (12.18) | 32–84 | 54.59 (10.81) | 33–83 | 58.46 (13.76) | 32–84 | −8.58*** |
| Gender (% of female) | 55 (—) | — | 56 (—) | — | 53 (—) | — | −2.06* |
| Race (% of White) | 93 (—) | — | 94 (—) | — | 90 (—) | — | 3.59** |
| Education | 7.33 (2.52) | 1–12 | 7.67 (2.48) | 1–12 | 6.80 (2.50) | 1–12 | 9.76*** |
| Working status (% of currently working) | 52 (—) | — | 58 (—) | — | 44 (—) | — | 7.97*** |
| Marital status (% of married) | 73 (—) | — | 74 (—) | — | 71 (—) | — | 2.00* |
| Number of chronic conditions | 2.44 (2.50) | 0–30 | 2.25 (2.32) | 0–30 | 2.74 (2.75) | 0–29 | −5.30*** |
| Instrumental activities of daily living | 1.77 (0.87) | 1–4 | 1.66 (0.79) | 1–4 | 1.94 (0.95) | 1–4 | −8.73*** |
| History of depression/anxiety (% of yes) | 18 (—) | — | 18 (—) | — | 19 (—) | — | −0.75 |
| Personality—extraversion | 3.10 (0.56) | 1–4 | 3.11 (0.56) | 1–4 | 3.09 (0.57) | 1–4 | 1.03 |
| Personality—openness | 2.91 (0.53) | 1–4 | 2.93 (0.52) | 1–4 | 2.88 (0.55) | 1–4 | 2.92** |
| Personality—neuroticism | 2.05 (0.62) | 1–4 | 2.03 (0.61) | 1–4 | 2.08 (0.64) | 1–4 | −2.52* |
| Personality—agreeableness | 3.45 (0.50) | 1–4 | 3.45 (0.49) | 1–4 | 3.46 (0.50) | 1–4 | −0.61 |
| Personality—conscientiousness | 3.40 (0.45) | 1–4 | 3.42 (0.44) | 1–4 | 3.37 (0.47) | 1–4 | 3.32** |
| Activity frequency across domains at W2 | −0.05 (0.64) | −1.77–8.96 | 0.00 (0.63) | −1.77–8.96 | −0.12 (0.66) | −1.72–4.92 | 5.39*** |
| Cognitive activity frequency at W2 | −0.08 (1.01) | −2.68–3.49 | −0.00 (1.00) | −2.68–3.49 | −0.21 (1.02) | −2.45–3.30 | 5.70*** |
| Physical activity frequency at W2 | −0.06 (1.02) | −2.35–1.34 | 0.00 (1.00) | −2.35–1.29 | −0.15 (1.03) | −2.18–1.34 | 4.40*** |
| Social activity frequency at W2 | −0.00 (1.00) | −0.54–27.23 | −0.00 (1.00) | −0.54–27.23 | −0.01 (0.99) | −0.54–12.42 | 0.14 |
| Activity variety across domains at W2 | −0.07 (0.72) | −2.59–1.05 | 0.00 (0.70) | −2.5–0.99 | −0.19 (0.74) | −2.59–1.05 | 7.48*** |
| Cognitive activity variety at W2 | −0.09 (1.01) | −2.87–1.54 | −0.00 (1.00) | −2.87–1.46 | −0.23 (1.02) | −2.61–1.54 | 6.26*** |
| Physical activity variety at W2 | −0.06 (1.05) | −3.43−0.56 | 0.01 (1.00) | −3.43−0.51 | −0.16 (1.11) | −3.04−0.56 | 4.40*** |
| Social activity variety at W2 | −0.07 (1.02) | −2.33–1.06 | 0.00 (1.00) | −2.33−0.99 | −0.19 (1.04) | −2.12–1.06 | 5.24*** |
| Overall cognitive functioning at W2 | −0.06 (0.64) | −2.67–2.07 | 0.00 (0.63) | −2.14–2.07 | −0.17 (0.65) | −2.67–1.92 | 7.83*** |
| Activity frequency across domains at W3 | — | — | 0.00 (0.62) | −1.78–4.86 | — | — | — |
| Cognitive activity frequency at W3 | — | — | −0.00 (1.00) | −2.67–3.30 | — | — | — |
| Physical activity frequency at W3 | — | — | 0.00 (1.00) | −2.21–1.26 | — | — | — |
| Social activity frequency at W3 | — | — | −0.00 (0.92) | −0.50–15.39 | — | — | — |
| Activity variety across domains at W3 | — | — | 0.00 (0.71) | −2.35–1.07 | — | — | — |
| Cognitive activity variety at W3 | — | — | 0.00 (1.00) | −2.74–1.53 | — | — | — |
| Physical activity variety at W3 | — | — | 0.01 (1.00) | −3.02−0.56 | — | — | — |
| Social activity variety at W3 | — | — | 0.01 (1.00) | −2.00–1.11 | — | — | — |
| Overall cognitive functioning at W3 | — | — | 0.01 (0.63) | −3.58–2.09 | — | — | — |
Notes: SD = standard deviation; Scores of activity frequency, activity variety, and overall cognitive functioning were standardized.
*p < .05. **p < .01. ***p < .0001.
Measures
Activity frequency and variety
Participants reported their activities within cognitive, physical, and social domains at both waves. Because questions for each domain used a different response scale, we constructed standardized activity frequency and activity variety scores to create comparable metrics across domains. For overall activity frequency, we averaged the z-scores of the frequency of each domain to create a single score. For activity variety for each domain, we converted responses to each item asking about frequency of activity to a binary variable (1 = ever engaged, 0 = never engaged). We then summed the number of engaged activities within each domain and standardized this score. For overall activity variety, z-scores across three domains were averaged together. Below, we describe how activity in each domain was assessed.
Cognitive activity.
Participants indicated how often they engaged in six different cognitive activities (i.e., reading books, doing word games, playing cards, writing, using a computer to send e-mail or search Internet, attending educational lectures/courses) on a scale from 1 (daily) to 6 (never). Responses were reverse-coded such that higher values indicate more frequent engagement. Cognitive activity frequency score was calculated as the standardized score of the sum of the reverse-coded responses to the six items. Cognitive activity variety score was calculated as the standardized score of the number of ever engaged cognitive activities.
Physical activity.
Participants rated the frequency with which they engaged in vigorous (e.g., running of lifting heavy objects), moderate (e.g., brisk walking or mowing the lawn), and light (e.g., easy walking or doing the laundry) intensity physical activities during the summer and during the winter on a scale from 1 (several times a week) to 6 (never). Responses were reverse-coded such that higher values indicate more frequent engagement. Responses for participation across the different intensity/types of physical activity in summer and winter were averaged to represent each score of involvement in vigorous, moderate, and light physical activities. Physical activity frequency and variety scores were calculated using the same procedure used for the cognitive domain.
Social activity.
Participants reported the frequency with which they attended meetings, did volunteer work, and gave emotional support to others. For attending meetings, they were asked three questions to indicate how many times per month they spent in meetings with three different types of groups (i.e., unions or other professional groups, sports groups, and any other social groups). The frequency of attending meetings was then calculated as the sum of the frequency of engaging in the three types of meetings. For volunteer work, four questions asked how many hours per month they spent doing volunteer work at four different places (i.e., health care related, school related, political organizations, and any other volunteer work). The frequency of doing volunteer work was calculated as the sum of the amount of time spent doing volunteer work at the four places. For giving emotional support, six questions asked about how many hours they spent giving emotional support such as giving advice to different groups of people (i.e., spouse or partner, parents, in-laws, children or grandchildren, other family members or close friends, and anyone else). The frequency of giving emotional support was also calculated as the sum of the amount of time spent in providing emotional support to those groups of people. Social activity frequency score was calculated as the standardized score of the sum of the frequency of attending meetings, volunteer work, and giving emotional support. Social activity variety score was constructed in the same way as the cognitive and physical activity variety scores.
Cognitive functioning
Cognitive functioning was measured using the Brief Test of Adult Cognition by Telephone (BTACT) at both waves (see Lachman et al., 2010 for a description of this cognitive test). BTACT consists of seven cognitive tests to assess executive functioning and episodic memory. Table 2 provides a brief description of each task and how they were scored. Scores for each task were standardized, and overall cognitive functioning was calculated by averaging across all seven executive functioning and episodic memory subtests.
Description of Cognitive Task in the Brief Test of Adult Cognition by Telephone (BTACT)
| Cognitive outcome | Task name | Description | Score |
|---|---|---|---|
| Executive functioning | Backward digit span | Participants are given two sets of a series of numbers that increase in length, starting with series of two digits and continuing to sequences of eight digits. They are asked to repeat the digit series in reverse order to how they are presented. | The highest number of digits repeated correctly |
| Category verbal fluency | Participants are asked to produce as many words in a given category as possible in 60 s. | The number of unique items generated | |
| Number series | Participants hear a series of numbers that follow a particular pattern and are asked to name the next number in the sequence. | The number of correct items | |
| 30 s and counting task | Participants are asked to count backwards from 100 in 30 s. | Last number reached | |
| Stop and Go Switch Task | Participants are instructed to respond STOP when they hear the word RED, and Go when they hear the word GREEN in the normal condition. In switch condition, they are asked to answer STOP to GREEN and GO to RED. | Average of the mixed-task nonswitch trials median reaction time (RT) and mixed-task switch trials median RT, then multiplied by −1 | |
| Episodic memory | Immediate word list recall | After listening to a list of words, participants are asked to recall the words in 90 s. | The number of correctly recalled words for each condition |
| Delayed word list recall | Participants are asked to recall the words at the end of BTACT. | The number of correctly recalled words for each condition |
Covariates
Demographics, health status, and personality traits with established relationships with activity engagement and cognitive functioning were included as covariates. The covariates were as follows: age (in years), sex (0 = female, 1 = male), race (0 = non-Whites, 1 = Whites), education level (1 = no grade school, 12 = doctoral level degree), working status (0 = not working, 1 = working for pay), marital status (0 = not married/partnered, 1 = married), number of chronic health conditions in the past 12 months, and instrumental activity of daily living measured with the mean of the reverse-coded responses in seven items (1 = a lot, 4 = not at all), history of emotional disorder in the past 12 months (0 = no, 1 = yes), and five personality traits (extraversion, openness, neuroticism, agreeableness, conscientiousness). To assess these five personality traits given associations of personality with activity engagement (Ihle et al., 2016; Stephan et al., 2014), participants rated how much each of 26 adjectives described themselves on a 4-Likert scale (1 = a lot, 4 = not at all). A score of each personality trait was calculated as the mean across the items after reverse-coding process (see Turiano et al., 2013 for more details).
Data Analysis
To test the cross-sectional hypotheses, we used linear regression models and data from W2 in two different models to examine how activity variety relates to cognitive functioning (outcome variable). In the first model, we entered overall activity variety score, activity frequency, and the covariates to examine associations with cognitive functioning; in the second model, we entered three separate activity variety scores—one for each domain (cognitive, physical, and social)—to examine their unique associations with overall cognitive functioning, after adjusting for the covariates and activity frequency in each domain. We also ran models to examine these relationships separately for executive functioning and episodic memory, and these results can be found in Supplementary Table 3.
To test the longitudinal hypotheses, we used residualized gain models, which is an analysis of covariance (Fitzmaurice et al., 2004) that predicts W3 cognition after adjusting for W2 cognition. We first classified participants into four groups based on their pattern of change in activity variety, whether they were above (high) or below (low) the mean z-score of activity variety at each Wave. Group 1 (labeled as “both high”) maintained high activity variety across W2 and W3 (above the mean at both waves); Group 2 (“increase”) had low activity variety at W2 (below the mean) but high activity variety at W3 (above the mean); Group 3 (“decrease”) moved from high to low activity variety across waves; and Group 4 (“both low”) scored low in activity variety at both waves. We then examined group differences in overall cognitive functioning at W3 after adjusting for cognitive outcomes at W2, activity frequency at W2, changes in activity frequency from W2 to W3, and covariates. We ran a model for overall activity and then for each activity domain: cognitive, physical, and social. We also examined longitudinal associations separately for executive functioning and episodic memory at W3. Results can be found in Supplementary Figures 1–3.
Results
Examining associations between our main variables at W2, greater activity variety was related to greater activity frequency across domains and in specific domains (see Supplementary Table 1). In addition, older age was related to lower activity variety at p < .001 across all domains (r = −0.26) and within each domain, with rs = −0.15, −0.30, and −0.09 for cognitive, physical, and social activity variety, respectively. Older age was also related to lower overall activity frequency (r = −0.22, p < .001), and within the cognitive (r = −0.06, p < .01), physical (r = −0.27, p < .001), and social (r = −0.10, p < .001) domains. Longitudinal correlations showed stability in overall activity variety and frequency over time (r = 0.61, 0.50, respectively), with varying degrees by specific activity domains (for all correlations, see Supplementary Table 2).
Results Testing Cross-Sectional Hypotheses
Table 3 presents the results of the regression analyses testing whether overall activity variety across domains (Model 1) and within cognitive, physical, and social domains at W2 (Model 2) was associated with overall cognitive functioning score at W2 after adjusting for activity frequency and covariates. As hypothesized, overall activity variety was positively related to cognitive functioning beyond overall activity frequency and covariates at p < .001. In the second model, higher levels of physical activity variety and social activity variety were positively related to overall cognitive functioning at p < .01, independent of frequency in each activity domain. Cognitive activity variety, however, was not significant.
Cross-Sectional Associations of Activity Variety at Wave 2 With Overall Cognitive Functioning at Wave 2
| Model 1 | Model 2 | |||
|---|---|---|---|---|
| B (SE) | 95% CI | B (SE) | 95% CI | |
| Intercept | 0.03 (0.03) | [−0.02, 0.09] | 0.05 (0.03) | [−0.01, 0.11] |
| Age | −0.02 (0.00)*** | [−0.02, −0.01] | −0.02 (0.00)*** | [−0.02, −0.02] |
| Men (vs women) | 0.07 (0.02)** | [0.03, 0.10] | 0.05 (0.02)** | [0.01, 0.09] |
| White (vs non-White) | −0.25 (0.03)*** | [−0.31, −0.18] | −0.24 (0.03)*** | [−0.31, −0.18] |
| Education | 0.06 (0.00)*** | [0.05, 0.07] | 0.05 (0.00)*** | [0.05, 0.06] |
| Currently working (vs not working) | −0.03 (0.02) | [−0.07, 0.01] | −0.03 (0.02) | [−0.07, 0.01] |
| Married (vs not married/partnered) | −0.02 (0.02) | [−0.05, 0.03] | −0.02 (0.02) | [−0.06, 0.02] |
| Number of chronic conditions | −0.01 (0.00)* | [−0.02, −0.00] | −0.01 (0.00)* | [−0.02, −0.00] |
| Instrumental activities of daily living | −0.03 (0.01)** | [−0.06, −0.01] | 0.03 (0.01)** | [−0.06, −0.01] |
| History of depression/anxiety (vs no) | −0.00 (0.03) | [−0.05, 0.05] | −0.01 (0.03) | [−0.06, 0.04] |
| Personality—extraversion | −0.04 (0.02)* | [−0.08, −0.00] | −0.04 (0.02) | [−0.07, 0.00] |
| Personality—openness | 0.03 (0.02) | [−0.01, 0.07] | 0.01 (0.02) | [−0.03, 0.05] |
| Personality—neuroticism | −0.02 (0.02) | [−0.06, 0.01] | −0.02 (0.02) | [−0.05, 0.01] |
| Personality—agreeableness | −0.00 (0.02) | [−0.04, 0.04] | 0.01 (0.02) | [−0.03, 0.05] |
| Personality—conscientiousness | 0.04 (0.02) | [−0.00, 0.08] | 0.04 (0.02) | [−0.00, 0.08] |
| Activity frequency across domains at W2 | 0.09 (0.02)*** | [0.06, 0.13] | — | — |
| Activity variety across domains at W2 | 0.14 (0.02)*** | [0.11, 0.17] | — | — |
| Cognitive activity frequency at W2 | — | — | 0.11 (0.02)*** | [0.08, 0.14] |
| Physical activity frequency at W2 | — | — | 0.03 (0.01)* | [0.00, 0.06] |
| Social activity frequency at W2 | — | — | −0.01 (0.01) | [−0.03, 0.01] |
| Cognitive activity variety at W2 | — | — | 0.02 (0.02) | [−0.01, 0.05] |
| Physical activity variety at W2 | — | — | 0.03 (0.01)** | [0.01, 0.06] |
| Social activity variety at W2 | — | — | 0.03 (0.01)** | [0.01, 0.05] |
Notes: N = 3,337. Scores of activity frequency, activity variety, and overall cognitive functioning were standardized. The main variables of interest in each model are highlighted. CI = confidence interval; SE = standard error.
aWhen examining the fully adjusted model with just activity variety (without activity frequency), higher activity variety in cognitive (B = 0.11, SE = 0.01, p < .001), physical (B = 0.06, SE = 0.01, p < .001), and social (B = 0.03, SE = 0.01, p < .01) domains were all related to better cognitive functioning. When examining the model with just activity frequency (without activity variety), higher activity frequency in cognitive (B = 0.13, SE = 0.01, p < .001) and physical (B = 0.06, SE = 0.01, p < .001) but not in social (B = −0.01, SE = 0.01, p = .34) domains were associated with better cognitive functioning.
*p < .05. **p < .01. ***p < .0001.
When we ran a model with just activity variety (not adjusting for activity frequency), all three activity variety scores were significantly associated with better cognitive functioning (see Table 3, note a). We also examined these associations separately for executive functioning and for episodic memory (see Supplementary Table 3) and found that overall activity variety was related to both executive functioning and memory subscales (Model 1). When each domain of activity variety was entered simultaneously, only social activity variety had a unique association with executive functioning, and only cognitive and physical variety had unique associations with episodic memory (Model 2).
Although not hypothesized, we explored whether age interacted with overall activity variety in its relationship with cognitive functioning. The interaction was significant for executive functioning only (see Supplementary Table 4). Follow-up analyses indicated that for people who were the sample’s mean age or older, higher levels of activity variety were related to higher levels of executive functioning. For relatively younger adults at 1 SD below the mean (on average 44 years old), the association was not significant.
Results Testing Longitudinal Hypotheses
Residualized gain models compared overall cognitive functioning at W3 between the four groups representing relative placement at W2 and W3 in overall activity variety (e.g., “both high” or “both low”). This model included all covariates and cognitive functioning at W2, so any significant results indicate group differences in change of overall cognitive functioning from W2 and W3. The overall model was significant, F(3, 2028) = 4.63, p < .01, and follow-up analyses revealed that the “both low” group exhibited lower overall cognitive functioning at W3 than the other three groups (Figure 1, Panel 1).
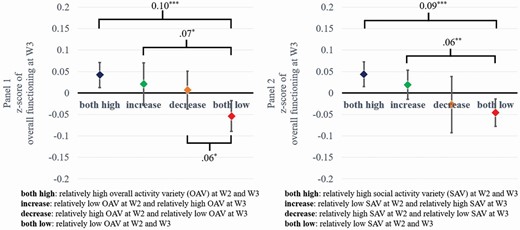
Difference in overall cognitive functioning at Wave 3 between groups split by activity variety across and social domains at Wave 2 and Wave 3. Notes: N = 2,049. Only significant differences between the groups were indicated. *p < .05, **p < .01, ***p < .001.
Models that examined each domain of activity variety revealed that only changes in social activity variety were related to changes in overall cognitive functioning at W3, F(3, 2028) = 5.68, p < .001; “both high” and “increase” groups had higher overall cognitive functioning at W3 than the “both low” group. (Figure 1, Panel 2). Models were not significant for the cognitive, F(3, 2028) = 0.53, p = .66, or physical domain, F(3, 2028) = 0.16, p = .92. See Supplementary Figures 1–3 for results separately for executive functioning and episodic memory. They reveal that those who maintained higher overall, physical, or social activity variety had better executive functioning and episodic memory at W3 than those who maintained lower activity variety across waves.
We further explored the reverse directionality, whereby the pattern of change in cognition across waves would predict the residual change score in activity variety from W2 to W3. We used the same method as above but swapped the placement of the cognitive functioning and activity variety scores. We calculated four groups based on their cognition z-scores using mean splits at each wave to determine their relative placement at W2 and W3 in overall cognitive functioning (e.g., “both high” or “both low”), as we had done for activity variety above. We used residualized gain models to compare these four groups on overall activity variety at W3 along with all covariates and overall activity variety at W2. A significant result would indicate group differences in change of overall activity variety, but the model was not significant, F(3,2028) = 2.02, p = .11.
Discussion
Healthy cognitive aging is often synonymous with an active lifestyle (Bosnes et al., 2019; Rowe & Kahn, 1997). The current study examined whether activity variety plays a unique role in this association beyond activity frequency, and whether activity variety in specific domains (cognitive, physical, and social) contributed independently to this association. Results indicate that greater activity variety overall, and particularly within the social domain, is both concurrently and prospectively related to higher cognitive functioning irrespective of activity frequency.
Activity Variety Across and Within Domains
When the three different types of activities were examined together, variety in physical and social activity was each significantly associated with concurrent cognitive functioning. In longitudinal analyses, those who reported low levels of overall activity variety across both waves had the lowest overall cognitive functioning 9 years later than did other groups, even after adjusting for cognitive functioning and activity frequency at baseline, and the change of activity frequency across time. Moreover, cognitive functioning was not significantly different between the group that increased versus the one that decreased in activity variety over time. This result suggests that decreasing activity variety may not be as deleterious as having remained low at both points, and also that increasing activity variety may provide benefits in cognitive functioning. Our results are consistent with the cognitive reserve hypothesis, which describes how enriched environments lead to enhancement or maintenance of cognitive functioning (Mora et al., 2007; Stern, 2012).
Across three major types of activities (cognitive, physical, and social), only social variety was significant in both the cross-sectional and longitudinal analyses. Though we did not examine mechanisms to explain these associations, we offer several reasons to explain the robust findings for social activity variety. First, social activity involves both physical movement and cognitive stimulation, all of which may contribute to higher cognitive functioning (Adams et al., 2011; Holtzman et al., 2004). In addition to the benefits that social relationships provide, people may benefit from the cognitive demands of the task, and the physical activity that accompanies social activity (Fingerman et al., 2020).
We also speculate that greater variety of social activities indicates stronger social integration. Social integration—a term used to describe diversity in different types of people and closeness in different relationships—is related to higher levels of well-being and greater perceived social support (Cohen, 2004; Fingerman et al., 2020). Further, strong social ties are hypothesized to buffer the physiological effects of stress (Evans et al., 2019). This buffering effect, in turn, is hypothesized to reduce levels of cortisol, the stress-related hormone related to lower levels of cognitive functioning (Charles et al., 2021).
Unlike social activity variety, cognitive variety was unrelated to concurrent cognitive functioning, and both cognitive and physical activity variety were not significantly related to later overall cognitive functioning. Perhaps one reason is due to the type of cognitive activities assessed (e.g., reading books, doing word games, playing cards). These cognitive activities may entail less novelty or less cognitive demand than is necessary to enhance long-term cognitive health. Studies on cognitive activity engagement have demonstrated that novelty and the complexity of activities are important to generate long-lasting benefits (Clemenson et al., 2020; Ghisletta et al., 2006; Park et al., 2014), and both novelty and complexity were not assessed in our current study. Another possible reason may be that most cognitive activities assessed in the current study likely entail sedentary behavior, and sedentary activity may undermine any benefits cognitive stimulation may provide (Falck et al., 2017; Kesse-Guyot et al., 2012). Regarding the null results on activity variety in physical domain, perhaps activity that enhances cardiovascular functioning is most beneficial for later cognitive functioning (Nakagawa et al., 2020). If so, the variety of physical activity may be less important than frequency—a factor that was associated with higher cognitive functioning in the current study. Future studies could explore how variety in novel cognitive activities (e.g., learning musical instruments or foreign language) and novel physical activities (e.g., different types of cardiovascular exercises) is related to cognitive functioning.
We also examined the alternative pathway, where those who experienced cognitive decline might be less likely to participate in various activities. We tested a model that was consistent with this causal hypothesis, however, and results were not significant. In addition, a third factor may be related to both declines in activities and cognitive functioning that explain these associations. For example, a study of over 2,000 older adults found that higher openness to experience played a role in the relationship between leisure activity engagement and cognitive functioning (Ihle et al., 2016). We included personality measures in addition to other sociodemographic factors in our models to address this possibility, but there may be other as yet untested confounding factors.
Limitation and Future Directions
Several limitations of the current study place the current findings in context and may provide directions for future research. First, the current findings do not test causal relationships, nor do they test underlying mechanisms for the relationship between activity variety and cognitive functioning. Although the associations we found are consistent with theories that motivated this study, we do not have data to inform causality. In addition, attrition analyses indicated that people lower in both activity variety and in cognitive functioning were less likely to participate at follow-up. The longitudinal effects were based on a more selective sample, although results were similar to the cross-sectional results. Moreover, the MIDUS sample consists of relatively healthy adults. Although our findings held even when we included subjective health status in our analyses, further studies could examine whether higher activity variety is associated with better cognitive functioning among more physically or mentally vulnerable populations. Finally, MIDUS is a predominantly White sample, and further studies will have to examine whether these findings generalize to non-White populations.
Furthermore, the study did not calculate the activity variety score using Shannon’s (1948) entropy method as was used in prior studies (Lee et al., 2018, 2021). This method includes “evenness” of activity engagement over time, something not possible for our overall measure of activity variety because different activities were assessed using different time intervals. Bielak (2010) discusses how activity variety measures differ across studies, making interpretation often difficult. Despite using a different activity variety measure and information with possible memory biases, results replicate prior findings, an important goal in psychological research. Results also add new information by examining three specific domains of activity. Future studies could compare activity variety scores that are generated using different methods to examine whether there is a different pattern in the relationship between activity variety and cognitive functioning depending on the measurements.
Conclusion
The total amount of time engaged in activities (i.e., activity frequency) has long been a hallmark characteristic of an active lifestyle, with strong links to cognitive functioning. The current study found that the variety of people’s day-to-day activities is another aspect of an active lifestyle that is also related to cognitive functioning. In addition, a rich and varied social life (social activity variety) is uniquely associated with both concurrent and future cognitive functioning. These activities included common events such as attending meetings or helping a friend, and results were robust even after adjusting for potentially confounds, such as personality and health status. Overall, findings from this study suggest that interventions targeted toward brain health should consider including a broad array of social activities.
Acknowledgments
Data are publicly accessible through the website: https://www.icpsr.umich.edu/web/ICPSR/series/203. Analytic methods specific to the current study are available upon request to the corresponding author. The current study was not preregistered with an analysis plan in an independent, institutional registry.
Funding
The Midlife in the United States Study (MIDUS; established in 1995) has been funded by the following: John D. and Catherine T. MacArthur Foundation Research Network, National Institute on Aging (P01-AG020166), National Institute on Aging (U19-AG051426).
Conflict of Interest
None declared.

