


Abstract
In the last two decades, developing countries have increasingly engaged in improving the governance of their health systems and promoting policy design to strengthen their health governance capacity. Although many well-designed national policy strategies have been promulgated, obstacles to policy implementation and compliance among localities may undermine these efforts, particularly in decentralized health systems. Studies on health governance have rarely adopted a central–local analysis to investigate in detail local governments’ distinct experiences, orientations and dynamics in implementing the same national policy initiative. This study examines the policy orientations of prefectural governments in strengthening governance in health financing in China, which has transitioned from emphasizing the approach of fiscal resource input to that of marketization promotion and cost-containment regulation enforcement at the national level since 2009. Employing text-mining methodologies, we analysed health policy documents issued by multi-level governments after 2009. The analysis revealed three salient findings. Firstly, compared to higher-level authorities, prefectural governments generally opted to use fiscal resource input over marketization promotion and cost-containment regulation enforcement between 2009 and 2020. Secondly, policy choices of prefectural governments varied considerably in terms of enforcing cost-containment regulations during the same period. Thirdly, the extent of the prefectural government’s orientation toward marketization promotion or cost-containment regulation enforcement was not only determined by the top-down orders of higher-level authorities but was also incentivized by the government’s fiscal dependency and the policy orientations of peer governments. These findings contribute to the health governance literature by providing an overview of local discretion in policy choices and the political and fiscal dynamics of local policy orientations in promoting health governance in a decentralized health system.
China has shifted its national policy agenda in the domain of health financing from emphasizing fiscal resource input to highlighting marketization promotion and regulation enforcement since 2009.
The empirical evidence derived from Chinese health policy text-mining analyses suggests that prefectural governments generally opt to use fiscal resource input over marketization promotion and regulation enforcement between 2009 and 2020.
A prefectural government’ policy orientations are determined by the top-down orders, its fiscal dependency, and the policy orientations of peer governments.
Introduction
Strengthening health system governance has increasingly attracted worldwide attention in recent decades (Adam et al., 2012). Since 2000, it has been enthusiastically encouraged by the World Health Organization (WHO) to affirm the new stewardship roles of governments in health sectors and to facilitate universal health coverage (UHC) (WHO, 2000; 2007; 2010). A dominant strand of health policy literature has proposed various frameworks and principles that collectively contribute to scientific design and planning of health systems, whose several domains, including ‘regulation’, ‘accountability’, ‘partnership’, ‘participation’ and ‘policy/strategic direction formulation’, are considered key pillars of ‘good governance’ in health systems (Travis et al., 2002; Barbazza and Tello, 2014; Brinkerhoff and Bossert, 2008; WHO, 2008; Siddiqi et al., 2009; Pyone et al., 2017). In practice, many developing counties (e.g. China, India, Thailand and some Sub-Saharan African countries) have actively carried out a series of national policy actions, such as increasing fiscal resource inputs, promulgating cost-containment regulations and improving public–private partnership to strengthen the governance capacity of their health systems (Ramesh et al., 2014; Agyepong et al., 2018; Bali and Ramesh, 2021).
However, the promulgation of these national policy strategies does not automatically guarantee their effective implementation at the sub-national level. Specifically, in developing countries (e.g. Bosnia, Brazil, Chile, China, Estonia, Philippines and Zambia) that have adopted a decentralized health system, critical obstacles to policy compliance have emerged among localities (Bossert and Beauvais, 2002; Ma et al., 2008; Falleti, 2010; Brixi et al., 2013; Huang, 2015; Kyratsis, 2016). In such decentralized contexts, local governments have to coordinate with different powerful interest groups (e.g. healthcare providers and insurance agencies), overcome some institutional constraints (e.g. financial federalism and path dependency) and strive to obtain political and financial support from higher-level authorities when implementing national policy measures (Blanchet et al., 2017; Bali et al., 2019; Bali and Ramesh, 2021; Effa et al., 2021). Local governments must possess sufficient financial and human resources and the capacity of planning, organizing and monitoring to ensure the effective implementation of national policies. Therefore, a more recent strand of health governance literature has shifted to investigating whether or not local governments have effectively executed the national policies (Brixi et al., 2013; Bali and Ramesh, 2021; Effa et al., 2021). It also ascertains the status quo of the capacity of and the incentive for single local institutions, such as health providers, community leaders and local government actors in implementing higher-level policies (Jacobs and Baez Camargo, 2020). However, the detailed evidence of local discretion in policy choices, distinctions between central and local governments regarding the functioning and orientations of health governance and the political and fiscal determinants of local policy orientations remains insufficient, thereby constituting a critical knowledge gap.
Whether or not sub-national governments define their reform implementations specifically to align with national strategies fundamentally determines the overall performance of strengthening national health governance. Although some countries have adopted relatively similar national-level policies to reform their health governance structures, the policy outcomes are highly diverse. One of the main reasons for these policy input–outcome differences is the heterogeneous policy implementation in localities (Hakansson et al., 2008; Kyratsis, 2016). Therefore, there is a need to monitor health governance at the sub-national level and to analyse policy isomorphism between central and local governments.
This study examines the policy orientations of local governments in strengthening governance in health financing in China, a middle-income country that has witnessed a remarkable transition in its health governance structure in the past decade. To reinforce its health governance capacity, the Chinese central government announced an ambitious healthcare reform in 2009 not only to invest titanic fiscal resources but also to build effective coalitions between public and private sectors, and enforce cost-containment regulations, to provide the population with equal access to basic healthcare with financial risk protection (Yip et al., 2012). A body of evidence has demonstrated the progress of China’s national healthcare reform in transforming its governance structure (Yip et al., 2012; Ramesh et al., 2014; Li and Fu, 2017; Liu et al., 2017; Yip et al., 2019); however, these studies have not examined the practices of implementing the central government’s policy measures in localities. Although China’s top-down bureaucracy may provide a relatively strong guarantee of local adoption of many national policy interventions, its healthcare sector features a decentralized administration system, which yields diverse bottom-up motivations among local practices of the same national policies (Ma et al., 2008; Brixi et al., 2013; Huang, 2015; Huang and Kim, 2020). This decentralized administration incentivizes local governments to selectively adopt national health policies to some extent, by considering local conditions. In the health policy literature, few studies have adopted a central–local analysis to investigate the diverse experiences, orientations and dynamics of local governments in implementing the same national policy initiative in China. Understanding local experiences in terms of strengthening governance is critical for policymakers, who synthesize the main problems in policy implementation, track reform efforts in different localities and develop solutions for the greatest potential public health outcomes. In addition, investigation of the Chinese context would inform international comparative analyses and shed light on other developing nations that feature decentralized health systems.
Specifically, this study investigates the policy orientations of prefectural governments by identifying their uptake of the national policy initiatives that shifted key agenda from emphasizing fiscal resource input to highlighting marketization promotion (marketization orientation) and cost-containment regulation enforcement (regulation orientation) after the 2009 healthcare reform in China. We proposed the following three related but sequential research questions accordingly: (1) To what extent did prefectural governments align with higher-level authorities in terms of orienting their policy agenda toward marketization promotion and regulation enforcement? (2) What progress did prefectural governments make in embracing the policy approaches toward marketization orientation and regulation orientation? (3) What are the factors that affected policy orientations among prefectural governments? This study considered the prefecture as the unit of analysis because, among all four levels (provincial, prefectural, county and township) of local governments, prefectural governments are the most critical level with the authority to specify and implement health policies formulated by the central government (Huang and Kim, 2020). For this purpose, we constructed a Chinese health policy database, which, to the best of our knowledge, is the first to capture policies issued by multi-level governments (central, provincial and prefectural). By employing the newly emerging ‘text-as-data’ approach (Grimmer and Stewart, 2013; Altaweel et al., 2019), we extracted keywords from each policy document to detect non-trivial but latent patterns from a large unorganized corpus of policy texts. We further used these keywords to gauge policy orientations related to strengthening governance in health financing.
Conceptual framework and research hypotheses
Conceptualizing governance strengthening in health financing
Health financing is regarded as a crucial function of health systems to improve access to health care and financial risk protection (Kutzin, 2013). According to the WHO framework for achieving UHC, ‘good governance’ in health financing can be assessed by examining the performance of three functions of health financing systems: collecting adequate financial resources for health, pooling funds to provide sufficient financial risk protection and conducting strategic purchasing to secure efficient use of inputted resources (WHO, 2007; 2010). Owing to the underdeveloped healthcare market and weak contribution capability of households in many developing countries, considerable attention is typically paid to utilizing government fiscal budgets to improve the performance of these functions in the initial stage of healthcare reform (WHO, 2010; Osei Afriyie et al., 2021). The government’s predominant accountability to increase its fiscal input in the health sector is considered to generate healthcare funding, establish insurance schemes for pooling financial risks and purchase health services from providers (Dieleman et al., 2017; Barroy et al., 2018).
With tremendous fiscal resources input on the part of the government, however, a critical issue has emerged regarding securing the sustainability of resource mobilization and avoiding unnecessary waste, which has become a crucial challenge for developing economies (Ekman et al., 2008; Yip et al., 2012; Barroy et al., 2018). To address this challenge, the WHO has further proposed two choices of policy shifts (WHO, 2020). Firstly, in terms of the subjects of revenue-raising, mixed financing system can be established through marketization promotion to include private and other non-governmental partners instead of relying on the single role of the government health budget (Krachler et al., 2021). Secondly, in terms of the strategies of purchasing, result-based financing strategies can be enforced in place of input-based strategies by promulgating effective regulations to monitor the performance of health financing policies (McIsaac et al., 2018; Fichera et al., 2021). Amongst a set of pre-specified results (e.g. improved access to health services, quality of healthcare and cost-effectiveness of service delivery), cost containment is often emphasized to solve the dilemma between the weak fund-raising capability and skyrocketing medical cost growth in many middle- and low-income countries (Dieleman et al., 2017).
Concerning both the changing subjects of revenue-raising and the altering strategies of purchasing, we constructed a conceptual framework to summarize the key governance instruments used in the process of policy shifts in health financing, as shown in Figure 1. We further decomposed the key governance instruments into three dimensions of policy strategies—fiscal resource input, marketization promotion and regulation enforcement. Firstly, fiscal resource input highlights both the predominant role of the government in mobilizing resources and the input-based strategy that it had adopted to improve access to healthcare and financial risk protection (WHO, 2007; 2010; Dieleman et al., 2017). Specifically, this dimension illustrates the government’s policy efforts to establish public insurance programs and expand the programs’ benefit packages and scope of service coverage, which entail key features of UHC (population covered, proportion of costs covered and services covered) (WHO, 2010).
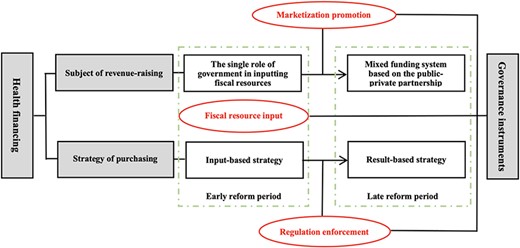
Conceptual framework for analyzing governance in health financing
Secondly, marketization promotion entails the expansion of the subjects of revenue-raising by taking advantage of the utility of private actors, especially private insurers and private insurance. By introducing private insurers and insurance to the market, the government aims to enhance its ability to organize and manage the public–private partnership in the health sector (Krachler et al., 2021). Specifically, we considered marketization promotion to encompass two elements: one is to introduce private insurance programs to supplement public insurance programs and expand health service coverage; the other is to design market-based mechanisms, such as outsourcing and contracting, to enhance the efficiency of strategic purchasing through the transfer of public insurance funds to competing private insurers (Zhou et al., 2013; Krachler et al., 2021).
Thirdly, regulation enforcement involves the exercising of result-based strategies to facilitate the efficient use of public insurance funds and to control medical cost inflation. This dimension highlights the use of different policy tools to establish a set of rules and incentives to oversee, monitor, review and audit both the demand side (insurance enrollees) and the supply side (providers) (WHO, 2000; 2007; 2010). We used this dimension to capture the policy strategies adopted to introduce prospective payment methods, contain the expenditure of public insurance funds and enhance the capacity of public insurance agencies to manage designated health facilities.
Health financing reforms in China
These three dimensions are not merely fundamental instruments for strengthening governance in global health financing systems; they also help capture the policy orientations of the Chinese government in different stages of its health care reform. Since 2009, China’s national policy agenda has shifted from emphasizing fiscal resource input in the early stages of its healthcare reform to diminishing its role by promoting marketization and enforcing cost-containment regulations in the later stages. Therefore, we set the dimension of fiscal resource input as the reference dimension and compared the dimensions of marketization promotion and regulation enforcement to the reference dimension, thus producing two policy orientations in China’s health financing reforms—marketization orientation and regulation orientation (Table 1).
Dimensions of policy strategies of strengthening governance in health financing in China
| Dimensions | Policy strategies | Variables |
|---|---|---|
| 1. Fiscal resource input |
| Reference |
| 2. Marketization promotion |
| Marketization orientation |
| 3. Regulation enforcement |
| Regulation orientation |
| Dimensions | Policy strategies | Variables |
|---|---|---|
| 1. Fiscal resource input |
| Reference |
| 2. Marketization promotion |
| Marketization orientation |
| 3. Regulation enforcement |
| Regulation orientation |
Notes: We categorized policy strategies related to strengthening health financing governance into three dimensions: fiscal resource input, marketization promotion and regulation enforcement. To depict the transition of the national policy agenda from emphasizing the input of fiscal resources to highlighting the promotion of marketization and the enforcement of regulations, we took the dimension of fiscal resource input as the reference dimension and compared it to the other dimensions (marketization promotion and regulation enforcement), thus constructing two variables related to policy orientations: a marketization orientation and a regulation orientation.
Specifically, prior to the 2009 reform, with a principal approach of infusing fiscal resources to expand insurance coverage, China launched a national campaign of establishing three public insurance programs: the Urban Employee Basic Medical Insurance (UEBMI) for formally employed workers in 1998, the New Cooperative Medical Scheme (NCMS) for rural residents in 2003 and the Urban Resident Basic Medical Insurance (URBMI) for unemployed urban residents in 2007. Both the central government and local governments invested tremendous fiscal resources to subsidize insurance enrollment. The 2009 reform continued and further strengthened this fiscal commitment with an earmarked budget of approximately 1.5 trillion RMB (roughly $214 billion USD 2020) over the first three years (2009–11), out of which nearly half (0.75 trillion RMB) was utilized to expand insurance coverage (State Council Deepening the Health Care Reform Leading Group Office, 2012).
Despite this titanic and rapid increase in fiscal resource input, improvements in financial risk protection did not meet expectations (Yip et al., 2012). Supply induced medication and artificially inflating drug prices remained barriers to people’s access to affordable care and the reduction of catastrophic expenditures (Liu et al., 2017). Many studies have linked these issues to poorly functioning health system governance and misaligned provider incentives (Yip et al., 2010; Ramesh et al., 2014; Yip et al., 2019). Recognizing these deficiencies, following 2014, the central government prioritized the transformation of its fiscal resources into effective health services and implemented numerous initiatives to boost its health governance capacity (Liu et al., 2017; Yip et al., 2019). In the area of health financing, it initiated the reform in two parts. Firstly, it designed a set of regulatory guidelines to align incentives for healthcare providers and introduced a bundle of prospective payment methods, such as diagnosis-related groups (DRG) and a global budget, in place of fee-for-service payments (Gao et al., 2014; Jian et al., 2015). Secondly, considering the limited service coverage of public insurance programs (UEBMI, URBMI and NCMS), which are subject to bureaucratic rules, the central government introduced private insurers and forms of private insurance to supplement public insurances and provide the population with additional service coverage (Zhou et al., 2013; Liu et al., 2017; Yip et al., 2019).
Research hypotheses
Under the decentralized health system, while the Chinese central government possesses supreme authority in terms of guiding national health policy orientations, it also leaves certain discretionary power to local authorities in regard to innovative policy implementation, thereby taking to consideration substantial regional disparities in economic and social conditions (Huang, 2015; Huang and Kim, 2020). Therefore, despite the central government’s aggressive pace in promoting marketization and cost-containment regulations, prefectural governments may be relatively conservative in implementing these policy measures. Compared with the innovative and complex strategies of promoting private insurance and enforcing cost-containment regulations, local governments may prefer to rely on the traditional approach of fiscal resource input, whose indicators are easier to quantify, implement and evaluate. Therefore, we proposed our first hypothesis as follows.
Hypothesis 1: Compared to higher-level authorities, prefectural governments are more likely to opt for fiscal resource input than marketization promotion and regulation enforcement in health financing reform.
Moreover, compared to infusing fiscal resources and enforcing cost-containment regulations, local governments may be the least likely to aggressively expand private insurance, not only because of the technical complexity of supervising the private insurance market but also due to the potential risks of nature embedded in private insurance. Private insurance is considered to have a series of ill-effects, such as for-profit instead of for-equity concern, adverse selection for insurers, moral hazard for the insured and high administrative costs (Blomqvist, 2009; Zhou et al., 2013). As public insurance has been set as the major financing strategy at the top-level policy design, the risk-averse local governors are highly unsure of the relationship between public and private insurance and the effects of private insurance on medical spending, service utilization and health outcomes of the local population. They are thus unlikely to consign the initiative of policy reform to the market. Therefore, we hypothesized that:
Hypothesis 2: Relative to promoting marketization, prefectural governments are more likely to enforce cost-containment regulations.
Both marketization promotion and regulation enforcement require local governments to promulgate innovative policy measures. Within the context of both hierarchical bureaucracy and decentralized administration, local governments may make practical decisions regarding the implementation of these measures, considering the pressure of the top-down directives from higher-level authorities and bottom-up conditions, such as local fiscal dependency and competitive pressure from peer governments (Zhu and Zhang, 2019; Huang and Kim, 2020; Zhu and Zhao, 2021). When local governments have substantial fiscal resources and thus rely little on transfer payments from the central government, they may choose to rely on these resources rather than on private insurance and cost-containment regulations to enhance the sustainability of their health financing system. For example, Qian colleagues (2019) found that Chinese provincial governments with a high degree of fiscal autonomy aim to increase fiscal subsidies to rural health insurance. In contrast, localities that have a low degree of fiscal autonomy would comply with the central guidelines, because they have to perform that way to obtain adequate fiscal transfers from the central government (Xiao and Zhu, 2021). Moreover, the policy orientations of peer governments also matter. Huang and Kim (2020) suggested a ‘bandwagoning’ behaviour pattern regarding policy compliance among Chinese local governors who compete with their counterparts in other localities in the same province in order to obtain opportunities for promotion. They found that the adoption of an integrated urban–rural health insurance policy in a prefecture could be well predicted by the adoption of the policy among the prefecture’s peer governments. We proposed the following three hypotheses.
Hypothesis 3a: The top-down orders from higher-level authorities may increase the likelihood of the policy orientations of a prefectural government toward marketization promotion or regulation enforcement.
Hypothesis 3b: The policy orientations of a prefectural government toward marketization promotion or regulation enforcement may be mitigated by its fiscal autonomy.
Hypothesis 3c: The policy orientations of a prefectural government toward marketization promotion or regulation enforcement may be incentivized by similar policy orientations of peer governments in the same province.
Methods
Data
By extracting policy documents from 7041 government websites, we built a health policy database that comprised the policies promulgated by the central government and the localities of 31 provinces and 338 prefectures in China. The collected policy documents covered laws, rules, regulations and other publications by the central, provincial and prefectural governments, as well as governmental departments, such as the Department of Health, Department of Human Resources and Social Security and Department of Health Security Administration. We further employed the named-entity recognition algorithm to identify the title, date of issuance and names of departments of issuance for each policy document. Details about the criterion of identifying health policies are shown in Supplementary Panel A.
To collect policies not available on government websites, we supplemented the policy database by manually searching for policy documents on two professional policy websites pkulaw.cn and lawnew.cnki.net. We first investigated and collected the titles of health-related policy documents that were present in the two websites and also recorded the places, dates and names of departments of issuance for each of these policy documents. Subsequently, we compared this manually collected information of policy documents to that obtained by the automatic web crawler and identified 6926 policy documents that were not automatically downloaded. We manually downloaded these documents from the two websites. We also employed the information on the places, dates and names of departments of issuance for these manually downloaded documents and reconciled the documents with the ones collected by the web crawler.
We finally obtained a total of 211 250 health policy documents, which included 5711, 51 802 and 153 737 documents issued by the central, provincial and prefectural governments, respectively, between 2009 and 2020.
Variables
We took three steps to measure the policy orientations related to strengthening governance in health financing. Firstly, we employed the method of term frequency-inverse document frequency (TF-IDF) in search of keywords in the policy texts and extracted five keywords from each document. TF-IDF is a statistical method that estimates the relative importance of a word within a document and in other documents in a corpus (the health policy database in this study). The importance of a word for a document proportionally increases with the frequency of appearance in the document, but inversely decreases with the number of times it appears in other documents in the corpus (Grimmer and Stewart, 2013; Altaweel et al., 2019). We further counted the frequency of the extracted keywords to gauge the essence of the policy efforts illustrated in each policy document. Python 3.7 was used to collect the policy documents, extract the keywords and count the keywords. For example, the State Council of China issued a flagship policy titled Guidance from the General Office of the State Council on Further Deepening the Reform of Basic Medical Insurance Payment Methods in 2017 to promote prospective payment methods reform, especially DRG for inpatient services and capitation for outpatient services (General Office of the State Council, 2017). Five keywords were automatically extracted: ‘basic medical insurance’ (frequency: 63), ‘health facility’ (30), ‘DRG’ (27), ‘payment method’ (15) and ‘capitation’ (8). We used the frequency of these keywords to reflect the focus of this policy. Please see Supplementary Panel B for detailed descriptions of the keyword extraction techniques used in this research.
Secondly, we identified health financing-related keywords among the automatically extracted keywords and manually assigned these identified keywords to one of the three dimensions shown in Table 1. Given that the unit of analysis was at the prefecture level, we aggregated the frequencies of all of the identified keywords in each of the three dimensions at the prefectural level across years. For example, the frequency of fiscal resource input-dimensioned keywords for prefecture X in 2020 equals the frequency of keywords classified into the dimension of fiscal resource input that appeared in the policy documents published by the government of X in 2020. Please see Supplementary Table SA and Figure SA for the list, categorization and aggregated frequency, respectively, of these health financing-related keywords.
Finally, considering the dimension of fiscal resource input (shown in Table 1) as the reference dimension, we constructed two sets of variables—marketization orientation and regulation orientation—to measure the policy orientations related to strengthening health financing governance. Using the aggregated frequency of keywords at the prefectural level, we measured the two sets of variables in both relative and absolute manners. Specifically, we defined the relative measure of marketization orientation as the proportion of marketization promotion-dimensioned keywords in the total frequencies of marketization promotion- and fiscal resource input-dimensioned keywords (= |${{{\rm{marketization\ promotion}}} \over {{\rm{marketization\ promotion }} + {\rm{ fiscal\ resource\ input}}}}$|). We defined the absolute measure of marketization orientation as the difference between keyword frequency denoting marketization promotion and keyword frequency implying fiscal resource input (= marketization promotion – fiscal resource input). The same strategy was employed to construct the relative measure (= |${{{\rm{regulation\ enforcement}}} \over {{\rm{regulation\ enforcement }} + {\rm{ fiscal\ resource\ input}}}}$|) and absolute measure (= regulation enforcement –fiscal resource input) of regulation orientation. We mainly used relative measures and then employed absolute measures in our robustness check.
We included three main predictors to estimate prefecture-level policy orientations. The first was the policy orientation of the subject prefecture’s affiliated provincial government. The second was the policy orientation of its peer prefectures in the same province. We quantified these two data elements using the same method of measuring prefectural-level policy orientations described above. The third was the degree of the subject prefecture’s fiscal autonomy. This aspect was measured by the proportion of differences between the prefecture’s fiscal revenue and its expenses in its fiscal revenue (= |${{{\rm{fiscal\ revenue }} - {\rm{ fiscal\ expense}}} \over {{\rm{fiscal\ revenue}}}}$|), with data drawn from the China City Statistical Yearbook (2010–19).
We controlled for prefectural-level socio-economic characteristics, including per capita GDP, output in the service industry as a share of GDP, population density, urbanization, the number of hospital beds per 1000 population and the number of doctors per 1000 population. Specific definitions and descriptive statistics of all variables are shown in Tables 2 and 3, respectively.
Variables and measurements
| Variable | Measurement |
|---|---|
| Outcome variables | |
| Marketization orientation of a prefectural government | The proportion of marketization promotion-dimensioned keywords in the total frequencies of marketization promotion- and fiscal resource input-dimensioned keywords in policy documents published by a prefecture |
| Regulation orientation of a prefectural government | The proportion of regulation enforcement-dimensioned keywords in the total frequencies of regulation enforcement- and fiscal resource input-dimensioned keywords in policy documents published by a prefecture |
| Main predictors | |
| Marketization orientation of a provincial government | The proportion of marketization promotion-dimensioned keywords in the total frequencies of marketization promotion- and fiscal resource input-dimensioned keywords in policy documents published by a provincial government |
| Regulation orientation of a provincial government | The proportion of regulation enforcement-dimensioned keywords in the total frequencies of regulation enforcement- and fiscal resource input-dimensioned keywords in policy documents published by a provincial government |
| Marketization orientation of peer prefectures | The proportion of marketization promotion-dimensioned keywords in the total frequencies of marketization promotion- and fiscal resource input-dimensioned keywords in policy documents published by other prefectures in the same province |
| Regulation orientation of peer prefectures | The proportion of regulation enforcement-dimensioned keywords in the total frequencies of regulation enforcement- and fiscal resource input-dimensioned keywords in policy documents published by other prefectures in the same province |
| Fiscal autonomy of a prefectural government | The proportion of differences between a prefecture’s fiscal revenue and its expenses in its fiscal revenue |
| Other covariates | |
| Per capita GDP | We obtained GDP per capita by dividing inflation-adjusted GDP by population size in a prefecture. Its unit is 1000 RMB. |
| Share of output in the service industry | A continuous variable indicating the share of output in the service industry in GDP for a prefecture |
| Population density | A continuous variable indicating the amount of population per square kilometer in a prefecture’s jurisdiction |
| Urbanization | A continuous variable indicating the share of urban residents in all residents for a prefecture |
| Number of hospital beds | A continuous variable indicating the number of hospitals beds per 1000 population for a prefecture |
| Number of doctors | A continuous variable indicating the number of doctors per 1000 population for a prefecture |
Notes: Marketization orientation and regulation orientation for a prefectural government, a provincial government and peer governments refer to the variables constructed using relative measures. The definitions of those constructed using absolute measures are presented in the supplemental material. Fiscal autonomy is commonly defined as the extent to which a sub-national government covers its expenses with its own revenue rather than relying on transfers from higher-level governments. Using fiscal revenue and expenditure data from the China City Statistical Yearbook, we defined fiscal autonomy as the share of a prefecture’s fiscal surplus (revenue minus expenses) in total fiscal revenue. Note that the fiscal revenue data we used did not include fiscal transfers from the central and provincial governments; under Chinese fiscal regulations, local fiscal deficits (revenue –expenses < 0) are usually compensated by transfer payments from superior governments, suggesting that a local government with more fiscal surpluses and fewer deficits has more fiscal autonomy. Furthermore, the fiscal autonomy measure we designed is a relative measure. It differs from the concept of fiscal affluence, which is typically operationalized as an absolute measure (e.g. per capita fiscal revenue) of a government’s capacity to generate revenue, whether through its own taxation or through central transfers.
Summary statistics of variables
| Variable | N | Mean | SD |
|---|---|---|---|
| Outcome variable | |||
| Marketization orientation of a prefectural government | 5006 | 0.027 | 0.085 |
| Regulation orientation of a prefectural government | 5006 | 0.230 | 0.271 |
| Main predictors | |||
| Marketization orientation of a provincial government | 4997 | 0.055 | 0.113 |
| Regulation orientation of a provincial government | 4997 | 0.409 | 0.245 |
| Marketization orientation of peer prefectures | 5006 | 0.025 | 0.031 |
| Regulation orientation of peer prefectures | 5006 | 0.212 | 0.129 |
| Fiscal autonomy of a prefectural government | 3702 | −1.614 | 1.986 |
| Other covariates | |||
| Per capita GDP (1000 RMB) | 3658 | 60.174 | 57.212 |
| Share of output in the service industry (%) | 3657 | 42.679 | 12.618 |
| Population density | 3702 | 0.553 | 0.700 |
| Urbanization (%) | 3657 | 44.880 | 28.841 |
| Number of hospital beds | 3696 | 4.628 | 2.271 |
| Number of doctors | 3697 | 2.436 | 1.439 |
Notes: N denotes the number of observations and SD denotes standard deviation. Marketization orientation and regulation orientation for a prefectural government, a provincial government and peer governments refer to the variables constructed using relative measures. The summary statistics of those constructed using absolute measures are presented in the supplemental material. To obtain appropriate coefficients in regression analyses, we used a percentage instead of ratio for the variables of share of output in the service industry and urbanization, respectively.
Statistical analyses
To test the first hypothesis (Hypothesis 1), we employed relative measures of policy orientations and compared the proportions of policy keywords denoting marketization- and regulation-oriented reforms at multiple government levels across years.
To test the second hypothesis (Hypothesis 2), we described and compared the time and geographical variations of prefecture-level marketization orientation and regulation orientation, respectively among various prefectures.
Results
Policy orientations at multiple government levels
Figure 2 presents the trends in marketization- (Figure 2a) and regulation-oriented (Figure 2b) reforms in health financing across multiple levels of government (central, provincial and prefectural) between 2009 and 2020. As shown in Figure 2a, the degrees of relative measures of marketization orientation for governments at all levels remained below 30%. Compared with the central government and provincial governments, prefectural governments experienced the lowest degrees (below 5%) and much flatter fluctuations across years. In Figure 2b, the degrees of relative measures of regulation orientation for the central government and provincial governments had similar patterns: both increased from lower than 50% in 2009 to higher than 50% in 2011, then decreased to less than 30% in 2014 and experienced a sharp increase to approximately 50% in the following years. Compared with the central government and provincial governments, prefectural governments had much lower degrees (below 35%) of regulation orientation that experienced fewer fluctuations across years. Hypothesis 1 was, thus, well supported.
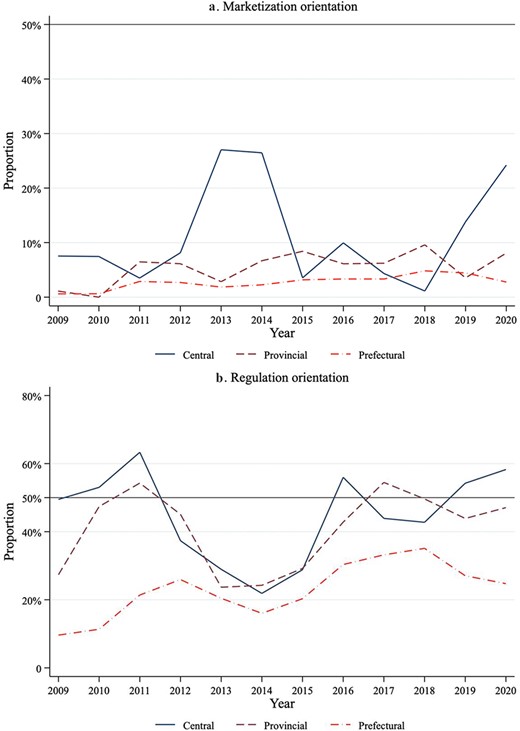
Marketization orientation and regulation orientation in health financing policies at multiple governmental levels (2009–20) Notes: We used relative measures to gauge the marketization orientation and regulation orientation of policy efforts in regard to strengthening health financing governance. Marketization orientation was defined as the proportions of marketization-dimensioned keywords in the total frequency of marketization promotion- and resource input-dimensioned keywords; regulation orientation was defined as the proportions of keywords denoting regulation enforcement reform in the total frequency of regulation enforcement- and resource input-dimensioned keywords. ‘Central’, ‘Provincial’ and ‘Prefectural’ denote the central government, provincial governments and prefectural governments, respectively
Marketization orientation vs regulation orientation at the prefectural level
We presented the time and geographical variations of the marketization (red maps) and regulation (blue maps) orientations at the prefectural level, as shown in Figure 3. The results revealed three distinct patterns in prefectural governments’ progression toward the two policy orientations. Firstly, there were temporally extended adoptions of both marketization- and regulation-oriented reforms among prefectures across the four selected years (2009, 2011, 2015 and 2018). Secondly, this temporal pattern was more evident for regulation orientation than for marketization orientation, indicating that Hypothesis 2 was supported. For most prefectures, the uptake of marketization-oriented reforms increased marginally. It had occurred only within a relatively contoured geographic region but had not spread out nationally. In 2018, most prefectures had a degree of relative measures of marketization orientation below 10%. Compared to the minor change in marketization-oriented reforms, the uptake of regulation-oriented reforms from 2009 to 2018 was more salient. Thirdly, there were substantial geographical variations in regulation orientation among prefectures during the same period. For example, in 2018, there were 69 prefectures where the degrees of relative measures of regulation orientation were under 10%, whereas 131 prefectures had degrees reaching 50% or higher.
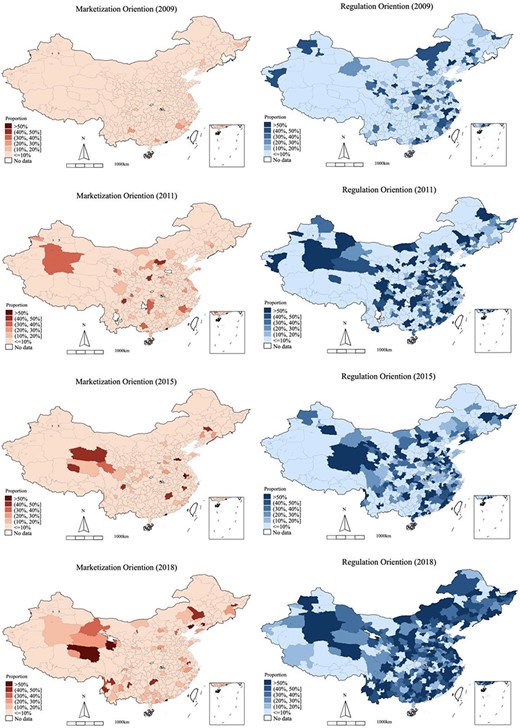
Geographic variations in marketization orientation and regulation orientation at the prefectural level in selected years (2009, 2011, 2015 and 2018) Notes: We used relative measures to gauge the prefecture-level marketization orientation and regulation orientation of policy efforts related to the strengthening of health financing governance. Marketization orientation was defined as the proportions of marketization-dimensioned keywords in the total frequency of marketization promotion- and resource input-dimensioned keywords; regulation orientation was defined as the proportions of keywords denoting regulation enforcement reform in the total frequency of regulation enforcement- and resource input-dimensioned keywords
Determinants of prefecture-level policy orientations
Table 4 presents the results derived from the two-way fixed effect models for prefecture-level marketization orientation (Models 1 and 2) and regulation orientation (Models 3 and 4), respectively. We regressed both relative and absolute measures of the two policy orientations on a set of main predictors and other covariates. Model 1 shows that, if using a relative measure, a prefecture government’s marketization orientation was significantly associated with higher degrees of marketization orientation among its peer prefectures in the same province (β = 0.1991, P < 0.01). It was positively associated with such an orientation in its affiliated provincial government (β = 0.0070), but negatively associated with its fiscal autonomy (β = −0.0005). Neither of these elements, however, was statistically significant at the 0.10 level. If using an absolute measure, the direction of the three associations remained unchanged, but all of them were statistically significant, as shown in Model 2.
Two-way fixed effects regression results for prefecture-level marketization orientation and regulation orientation in health financing (2009–2018)
| Marketization orientation | Regulation orientation | |||
|---|---|---|---|---|
| Model 1 (relative measure) | Model 2 (absolute measure) | Model 3 (relative measure) | Model 4 (absolute measure) | |
| Main predictors | ||||
| Marketization orientation of the provincial government | 0.0070(0.0120) | 0.0668***(0.0177) | ||
| Marketization orientation of peer prefectures | 0.1991*(0.1070) | 0.2433***(0.0749) | ||
| Regulation orientation of the provincial government | 0.0720***(0.0219) | 0.0680***(0.0173) | ||
| Regulation orientation of peer prefectures | 0.1659**(0.0693) | 0.2234***(0.0789) | ||
| Fiscal autonomy | −0.0005(0.0014) | −3.6710***(1.2904) | −0.0117**(0.0059) | −2.8624**(1.2465) |
| Other covariates | ||||
| Per capita GDP (1000 RMB) | −0.0001(0.0001) | 0.2465***(0.0723) | −0.0001(0.0004) | 0.1573***(0.0607) |
| Share of output in the service industry | 0.0011(0.0007) | 0.9648**(0.4319) | 0.0044**(0.0017) | 0.7837**(0.3815) |
| Population density | −0.0011(0.0013) | 4.0707***(1.0108) | −0.0145***(0.0049) | 2.6605***(0.7523) |
| Urbanization | 0.0002(0.0002) | 0.4726***(0.1335) | −0.0007(0.0007) | 0.3197**(0.1240) |
| Number of hospital beds | 0.0014(0.0025) | −0.7752(1.4655) | 0.0182**(0.0071) | 1.2412(1.3572) |
| Number of doctors | −0.0038*(0.0022) | −2.2768(3.0258) | −0.0240**(0.0095) | −4.3787(2.8114) |
| Constant | −0.0412(0.0304) | −74.2792***(17.8864) | −0.0986(0.0782) | −57.0356***(15.5328) |
| Prefecture fixed effect | Y | Y | Y | Y |
| Year fixed effect | Y | Y | Y | Y |
| Observations | 3192 | 3192 | 3192 | 3192 |
| R2 | 0.031 | 0.139 | 0.122 | 0.070 |
Notes: *P < 0.10, **P < 0.05, ***P < 0.01. Robust standard errors are in parentheses. When estimating the two-way fixed effects models, we controlled for both prefecture and year fixed effects. The edition of the China City Statistical Yearbook published in a specific year recorded the socio-economic information of Chinese prefectures in the previous year. Given that the China City Statistical Yearbook (2019) was the most recent update for prefecture-level indicators, we used data drawn from the editions of the Yearbook published between 2010 and 2019 and integrated them with the health policy data, yielding a panel of 3192 prefecture-level observations between 2009 and 2018. Of note, in the regression analyses, we did not include the policy orientation of the central government, which had no variation at the prefectural level in the same year. Moreover, when estimating relative measures of prefecture-level policy orientations, we used relative measures of province-level and peer prefecture-level policy orientations as our main predictors; similarly, we used absolute measures of the two main predictors when regressing absolute measures of prefecture-level policy orientations.
Regarding the determinants of prefecture-level regulation orientation, we found that the regression coefficients of models using relative and absolute measures exhibited similar patterns. Model 3 shows that a prefecture government’s regulation orientation, if measured in a relative manner, was significantly associated with a stronger regulation orientation in its affiliated provincial government (β = 0.0720, P < 0.01) and of its peer prefectures (β = 0.1659, P < 0.05), but negatively associated with its fiscal autonomy (β = −0.0117, P < 0.05). If using an absolute measure, the direction and statistical significance of these associations remained unchanged, as shown in Model 4. In summary, we found strong support for Hypotheses 3a–3c.
Discussion
This study outlined the progress made in strengthening prefecture-level governance in health financing using an innovative policy database. Firstly, compared to the central government and provincial governments, prefectural governments tended to rely more on infusing fiscal resources over developing private insurance and reinforcing their regulative capacity of cost containment between 2009 and 2020. Secondly, prefectural governments started to shift toward a regulation orientation to some extent. However, prefectural governments varied widely in their policy choices, and some were reluctant to carry out cost-containment regulations. Finally, the extent to which a prefectural government was oriented toward marketization promotion or regulation enforcement was not only determined by the top-down orders of higher-level authorities but was also incentivized by bottom-up factors, especially the prefectural government’s fiscal dependency and the policy orientations of its peer governments.
The first finding suggests a central–local policy disparity regarding the aggressive reform pace of the central government and the conservative compliance among local governments. Plausible explanations for this disparity include two elements. Firstly, from a top-down viewpoint embedded in a bureaucratic system, the promotion of prefectural governors is decided by the central government, and the major indicator of it is the prefectural governors’ achievements in terms of a series of ‘hard targets’ set by the central government. Since the 2000s, one of such ‘hard targets’ has been the level of fiscal resource input in local health systems, which the central government considers one of the principal criteria for cadre promotion (Zhang, 2020). Moreover, the indicator of fiscal resource input is easier to quantify and evaluate than the complex strategies of promoting marketization and enforcing cost-containment regulations. Secondly, when strengthening cost-containment regulations, local governments may encounter serious resistance from stakeholder groups, mainly public hospitals, whose interests are affected (Yip and Hsiao, 2008; Yip et al., 2010; Ramesh et al., 2014). Any serious discontent from social groups, in turn, may threaten the promotion of local governors. When competing for promotion, the risk-averse local governors would like to choose ‘safe’ policy measures, such as inputting fiscal resources and avoid the relatively ‘risky’ measures of promoting marketization and promulgating cost-containment regulations.
The second finding reveals the revival of a regulation-enforcement orientation among many prefectures in the later stages of the national healthcare reform, compared to the dismal development of market power in the domain of health financing. We speculate that this issue occurred because compared to market power, government power is consistently dominant in healthcare reform and wields enormous rules and bureaucratic mechanisms to steward the reform of the health financing system (Ma et al., 2008). Although the private insurance market has also been realized as an option, local governments are aware of the potential inferior outcome it produces and thus maintain a prudent attitude in vigorously developing private insurance. Moreover, although prefectural governments have superior power in carrying out cost-containment rules, a nationally decentralized administration system still enables them to be self-determining in terms of conducting such practices to a certain extent. Some prefectures choose to promulgate fewer cost-containment regulations but directly input more fiscal resources into their health sector than others.
The last finding provides a further explanation of the dynamics and geographic variations of prefecture-level policy orientations in health financing. Although a top-down model still holds, we found that the policy orientation of peer governments motivates a prefectural government to conduct similar reforms Located in the same province, a prefectural governor is likely to learn from, imitate or compete with its peers in relation to any new health policy endeavor (Qian et al., 2019; Zhu and Zhang, 2019; Huang and Kim, 2020; Zhu and Zhao, 2021). It may be further related to a somewhat tricky ‘bandwagoning’ pattern regarding the politics of cadre promotion (Huang and Kim, 2020). Even though the central government encourages the local adoption of a set of policy measures, the decentralized circumstance allows a prefectural governor to be inactive in implementing some hard-to-operate measures, unless his/her counterparts in the same province actively implement them. If the governor remains inactive with increasing peer implementations, however, he/she would be at a disadvantage in the competition for promotion. In addition, we found that a higher degree of fiscal autonomy predicts relatively less policy efforts exerted toward either marketization promotion or regulation enforcement than that devoted to fiscal resource input. It would be a pragmatic strategy for a prefecture with a high degree of fiscal autonomy to utilize their abundant fiscal resources to subsidize insurance enrollment and raise insurance benefits, which is a ‘safe’ policy action, instead of designing complex and ‘risky’ rules to regulate public hospitals and private insurers.
When taken together, these findings reveal the political economy dynamics of local policy choices in a dual setting of hierarchical bureaucracy and decentralization. When implementing multiple policy measures from the central government, local governments may make practical decisions about which policy measures to prioritize depending on both top-down pressure and bottom-up conditions. On the one hand, decentralization allows for a certain degree of local discretion, resulting in policy discrepancies between the central and local levels (as shown in Figure 2) as well as across regions (as the geographic variation depicted in Figure 3). The hierarchy of authority, on the other hand, keeps the central–local policy disparity within acceptable bounds, leading to incremental adoptions of central orders among localities (as the temporal variation depicted in Figure 3). Moreover, when implementing central guidelines, local governments may consider their own fiscal conditions as well as competitive pressure from peer governments and, thereby, strategically prioritize policies that are easy to operate (e.g. fiscal resource input) or have already been widely adopted by peers (e.g. regulation enforcement), resulting in a relative lag in private insurance development.
To further reinforce its governance of health financing, China established the National Medical Security Administration (NMSA) in 2018 (Yip et al., 2019). The establishment of NMSA involved a re-centralized structure of governance by carrying out a nationally unified standard of DRG and drug price setting, in place of the decentralized model. This re-centralized model is expected to strengthen the local governance orientation toward a regulative regime by providing less discretion to localities than before. However, we are skeptical about the rapid development of private insurance under this re-centralized model, at least in the near future, because NMSA has reasserted the public insurance-centered financing model, thereby implying that private insurance is supplemental.
This study has two limitations. Firstly, some localities may be subject to limited capacity to publish policy documents timely on their websites. Although we manually supplemented our policy database using alternative sources, it may not cover all promulgated policies. Secondly, policy keywords and their frequencies may not completely reflect the strategies and orientations of health governance reform. Our qualitative assignment of identified keywords into the three dimensions of strengthening governance may further increase the degree of measurement error of the policy orientation variables.
Conclusion
In the process of fulfilling the goals of UHC, the policy orientations in terms of strengthening local governance in health financing reveal a central–local disparity, an incremental transition toward a regulation-oriented governance structure and the political economy dynamics of diverse policy choices. For future interventions, we suggest that a mixed financing model based on the public–private partnership should be improved, rather than solely relying on the government and public insurers. For this purpose, central-level policy measures should be further promulgated to steer and develop the private insurance market, which may somewhat reduce local governments’ concerns about the negative effects of private insurance. Moreover, the central government should consider improving mutual policy learning among localities, particularly by setting more policy pilots in localities and guiding other localities to learn from these pilots. Finally, when evaluating local governments’ performance, the conditions of cost-containment regulation enforcement can be included in the sets of ‘hard targets’ used for evaluation. These initiatives are expected to incentivize local governments, especially those with a high degree of fiscal autonomy, to keep in line with the central government and move toward a central–local aligned framework of marketization- and regulation-oriented governance in health financing.
Supplementary data
Supplementary data are available at Health Policy and Planning online
Data availability
The data underlying this article are available in the article and in its online supplementary material.
Funding
This study was funded by the Fundamental Research Funds for the Central Universities and the Research Funds of Renmin University of China (19XNL006), the National Natural Science Foundation of China (No. 72104240), Research Foundation of Renmin University of China (No. 21XNA013), MOE Project of Humanities and Social Sciences (No. 17YJC790155), and Social Science Foundation of Beijing (No. 18YJC024).
Ethical approval.
This study used policy data released by the Chinese government. These data were accessible in the open domain and were secondary in nature, without any sensitive personal data. Therefore, we believe that an ethical approval is not applicable to this study.
Conflict of interest statement.
None declared.
Author contributions
K.L. research design, data analysis and writing. T.W. data analysis and interpretation. C.B. research design and literature review. L.L. critical revision of the article.
