


Abstract
A long line of research maintains that physical proximity increases interpersonal contact and boosts the likelihood of voluntary relationships. Proximity effects, however, may be modified by additional, valued characteristics that distinguish people from one another, such as physical health. I examine this interaction between proximity and assortative mechanisms with a complete network of retirement community (RC) residents.
Descriptive statistics and an exponential random graph model (ERGM) are used to analyze ties between 123 RC residents. In addition to hypothesized variables, the ERGM approach accounts for structural network processes that generate ties.
As expected, reports of close relationships were strongly influenced by physical proximity. Also consistent with hypotheses, close tie nominations tended to be asymmetric along a health gradient: People were less likely to identify those in worse health than themselves as a close tie. Physical proximity, moreover, intensified the health-based asymmetries.
Findings suggest that relational inequalities associated with health are most pronounced when they are most local. I conclude by noting broader implications for the study of social networks, health, and physical space among older adults.
In the late 1940s, Leon Festinger, Stanley Schachter, and Kurt Back were commissioned by MIT to study residential life among soldiers returning from the warfront to attend university. From the pragmatic—and seemingly dry—charge to study “problems of student housing” came a classic monograph in social psychology, Social Pressures in Informal Groups (1963). Of the intriguing results presented in their book, perhaps most well known are those related to “social ecology” and friendship. Capitalizing on the housing center’s layout, Festinger and his colleagues captured physical proximity between students’ living quarters and examined friendships across separate buildings and floors within the community. Physical closeness, they argued, increased the likelihood of friendship because it increased the amount of passive contact between people.
Congregate housing sites for older adults provide another natural context for understanding the connection between spatial proximity and social connectedness. As with student housing, these residential settings impose a natural constraint on their inhabitants’ patterns of movement and interpersonal exposure, ultimately affecting the probability of different dyads (pairs of people) in the population becoming friends or confidants. Several early studies conducted in institutional nursing homes support the Festinger and colleagues results, indicating that people are most likely to report friendships with those who dwell nearby, even as their tenure in the community increases and they have the chance to meet more people (Friedman, 1966; Lawton & Simon, 1968). As the publication dates of these studies imply, however, existing literature on proximity and social connection among senior housing residents has not kept pace with many advances in the broader field of social network analysis. A very recent wave of research has explicitly incorporated spatial dynamics along with personal characteristics and endogenous network processes in order to predict patterns of social ties, examining phenomena such as workplace interaction (Sailer & McCulloh, 2012), urban violence (Papachristos, Hureau, & Braga, 2013), and suburban unemployment (Daraganova et al., 2012). More details about this exponential random graph model (ERGM) approach—and its applicability for the context of senior housing—will be provided in the Design and Methods section.
Peer relationships and spatial proximity are topics worth revisiting because social connections are critical for older adults in congregate living settings. For the many thousands of American adults living in retirement communities or assisted living facilities, adult children are often not be regularly available for conversation and companionship, while formal staff likewise have many competing demands on their time (Kemp, Ball, Hollingsworth, & Perkins, 2012). Many adults, moreover, enter congregate housing after losing a spouse (Naditz, 2003), typically the most central tie in their social network. Meaningful relationships with coresidents play a crucial role in helping maintain good health and general well-being during this phase of life (Park, 2009; Street & Burge, 2012; Street, Burge, Quadagno, & Barrett, 2007), and tenants often cite social connections as a central motivation for entering congregate housing (Shippee, 2008). Attention and validation from coresidents can keep seniors from feeling invisible and forgotten (Myerhoff, 1978). Kemp and colleagues (2012, p. 491) nicely summarize the central point: “To the extent that relationships with age-peers are reciprocal and satisfying, they can make up for the absence or loss of a partner and help prevent loneliness” (emphasis added).
Yet relationships are not always reciprocal. When social ties are conceptualized as a directed phenomenon—that is, a relational link extended from person X to person Y is distinct from that of Y to X—we can relax the reciprocity assumption that implicitly pervades most network research in social gerontology. Although there are many reasons that imbalance or inequality could characterize a given dyad in a senior housing context, prior research suggests that health differences between residents create a robust pattern of systematic asymmetry. Specifically, older persons in both independent living retirement homes and in assisting living facilities are more inclined to avoid, ignore, or otherwise marginalize those who are worse health then themselves (Shippee, 2008, 2009). Individuals in declining health unsettle the fragile illusion of an “active community” (Shippee, 2012), can be a reminder of people’s own impending mortality (Hirschberger, Florian, & Mikulincer, 2005), often present difficulties in communication (Park, Zimmerman, Kinslow, Shin, & Roff, 2012), and embody widespread stigma attached to disability and dependency (Dobbs et al., 2008; but see Ross, 1977, for an account of retirement community (RC) residents more accommodating of peers’ health limitations). Health disparities also leave the healthier party more responsible for downward adjustment. That is, it is more realistic for an able person to accommodate the routine or endeavors of a sick associate than vice versa, and this special effort may be made only in uncommon circumstances. For all of these reasons, it should not be surprising that relatively healthy people would be less inclined to claim as friends their less healthy peers then the other way around.
At the same time, however, it is likely that the prevailing effects of proximity moderate health asymmetry—either muting or exacerbating the expected general patterns related to health. For instance, the recurring exposure associated with nearby living quarters could reduce dyadic patterns of asymmetry if healthier people become acquainted with their less health peers, find commonalities, and become friends despite their health differences. In this scenario, physical closeness would temper the trait-based sorting processes that more generally characterize social interaction in a congregate housing population. The reverse possibility, however, is that by inducing more interpersonal contact, physical proximity actually heightens the opportunity for non-reciprocal relationships. If the least healthy residents are the most bound by their physical environments, find it the most taxing to pursue or maintain out-of-the-way relationships, and at the same time most need close, supportive relationships as a basic survival mechanism, these people may end up seeking out disproportionately proximal peers for social support (see Lawton & Simon, 1968). This reliance on immediate neighbors could have the overall effect of making local relationships more health asymmetric than those relationships that exist across greater spatial distances. With both possible moderating effects in mind, I aim to examine which account best explains the empirical pattern of close network ties among a defined population of older adults.
This article uses data from a population of older adults to investigate the joint roles of physical proximity and health differentials in the patterning of close ties. It will investigate the predictive ability of both factors—representing key proximity and selective assortative mechanisms, respectively (Rivera, Soderstrom, & Uzzi, 2010). The particular setting in this article is a full population of independent living residents of a continuing care retirement community (CCRC). CCRCs are tiered facilities offering multiple levels of care, with independent living apartments or condominiums representing the initial point of entry. Senior housing has many forms and encompasses various levels of service—for example, active living communities, assisted living, long-term care homes (Howe, Jones, & Tilse, 2013)—and so this study is not directly analogous to earlier studies conducted in more institutionalized settings (Dobbs et al., 2008; Kemp et al., 2012; Park, 2009; Park et al., 2012; Street & Burge, 2012; Street et al., 2007). Nevertheless, the present context is advantageous as a defined, bounded environment with considerable health heterogeneity among its residents. I use descriptive statistics to showcase basic features of the network and an ERGM approach to predict the patterns of close relationships among older adults within the CCRC. Basic hypotheses are that (a) sharing a hallway will increase the probability of a close friendship tie between two CCRC residents and (b) greater health differentials between one person and another will lower the probability of a close friendship tie from the healthier to the less healthy individual. The final and opposing hypotheses build from the first two expectations, positing different processes about how proximity and health assortative mechanisms interact: (c1) the effects of dyadic health differentials are weakened when CCRC residents share a common residential area (i.e., an apartment hallway) versus (c2) the effects of dyadic health differentials are more pronounced when individuals live on the same hallway.
Design and Methods
Setting and Data Overview
Data used for this study come from a single CCRC located in the Midwestern United States, referred to as “RC” (for Retirement Community). The housing is organized in three distinct residential divisions, with the majority of tenants housed in the independent living section and having their own one or two bedroom apartments. This study only includes independent living residents.
The RC setting offered distinct benefits as well as drawbacks for data collection. Regarding its downsides, this setting is by no means a representative picture of aging in America. Most notably, the facility is comprised largely of community elites—former college professors, business leaders, and other high status professionals. Tenancy requires a large down payment and a monthly fee considerably more expensive than average priced apartments in the broader community. Predominantly White, educated, and well-off RC is very characteristic of the growing number of CCRCs in the United States. In terms of marital status, the facility is fairly comparable to the general American population of comparably aged adults (29% of women at RC partnered vs. 32% of American women aged 75 and older; 63% of RC men partnered vs. 69% of all American men aged 75 and older; U.S. Census Bureau, 2012). In all, women outnumber men nearly three to one at RC. Basic demographic data and personal characteristics for the independent living RC can be found in Table 1.
Basic Characteristics of Study Population (N = 123)
| Range | Percentage/mean (standard deviation) | |
|---|---|---|
| Physical health (Short-Form 36 score) | 1–100 | 48.25 (15.96) |
| Female | 0–1 | 0.72 |
| Partnered | 0–1 | 0.37 |
| Age | 74–96 | 85.95 (4.36) |
| Tenure (years lived in facility) | 0–21 | 5.29 (5.39) |
| Local (lived in same county before moving to retirement community) | 0–1 | 0.72 |
| See outsiders (non-residents) frequently | 0–1 | 0.68 |
Despite some of its demographic particularities, the setting is ideal for the purposes of a complete network analysis. RC is a fairly self-contained living context; residents live under the same roof, eat their meals in a common dining room, and conduct most of their day-to-day activities within the confines of the facility. This wide range of activities creates a natural context for frequent social exchanges and the development of close ties (Ross, 1977, p. 168). Moreover, focusing on a discrete, self-contained population removes much of the ambiguity in defining a relevant “group” for study and charting its boundaries (Laumann, Marsden, & Prensky, 1992). In this case, the entire RC is treated as the relevant study population and treated as a single social network.
The initial population of RC residents included 158 persons. During the course of the six-month data collection period, seven persons died, one moved away to be closer to her adult children, nine transitioned from an independent living apartment to another setting within the facility, and six who lived independently with a spouse but were cognitively unfit for their own interview. These persons were eliminated from the population list, leaving 135 residents eligible for the study. Interviews were conducted with 123 of these residents over the study period (91% response rate). Table 2 shows how the number of residents and respondents are distributed throughout the RC’s unique geography. Primary data for this article come from structured interviews, but archival records and participant observation were also used to develop the study. All components of the study met approval by the author’s university institutional review board.
Size of Buildings and Floors
| Number of residents included in analysis | Number of residents eligible for study | |
|---|---|---|
| Building A | ||
| Floor 1 | 10 | 11 |
| Floor 2 | 10 | 13 |
| Floor 3 | 12 | 13 |
| Floor 4 | 13 | 13 |
| Building B | ||
| Floor 1 | 14 | 14 |
| Floor 2 | 16 | 16 |
| Floor 3 | 12 | 15 |
| Floor 4 | 12 | 14 |
| Building C | ||
| Floor 1 | 7 | 7 |
| Floor 2 | 6 | 6 |
| Floor 3 | 7 | 7 |
| Floor 4 | 4 | 5 |
| Total | 123 | 134 |
As Figure 1 illustrates, the facility is arranged in three separate residential buildings (A, B, and C), which are each connected to a centralized public space (hereafter, central building). The central building consists of a main, open hall, the dining area, a mailroom, a beauty shop, a convenience market, an exercise center, meeting spaces, administrative and marketing offices, and various common seating areas with couches, chairs, and coffee tables. The central building features a ground level and basement level space. There is an enclosed, windowed walkway from each building to the central building, as well as a corresponding tunnel directly underground connecting to the public basement area. There are no tunnels directly connecting the three residential buildings; all foot traffic flows through the central building.
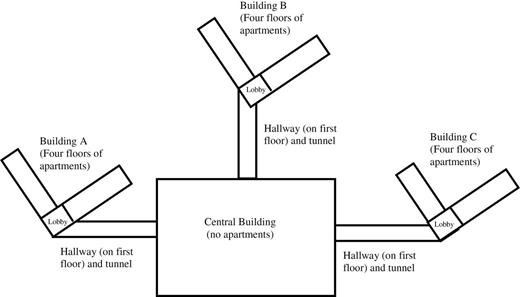
Physical layout of retirement community.
Each residential building is comprised of four floors and is shaped roughly like a v (see Figure 1). That is, each floor has a central lobby with two long wings extending outwards at an approximately 130º angle. The overall design of each building and its four floors is exactly alike (e.g., each lobby has couches, tables, chairs, a bulletin board, and two elevators), but building C differs slightly in one regard. At the time of the data collection, one half (i.e., one wing) of each floor on building C was not open to independent living residents. This is reflected by smaller floor sizes for the building C in Table 2 (importantly, however, independent living building C residents did not statistically differ on health or demographic traits from independent living residents in other buildings). As indicated previously, the Table 2 provides information about the population of each building and floor used in the analysis.
Archival records provide the basis of measuring spatial proximity. I obtained a directory of RC that included the apartment number of each resident and recorded their building and floor. Using this information, I created a matrix to represent shared hallway (i.e., same building floor), the indicator of spatial proximity in this study. A dyad of actors X and Y was given a 1 if they resided on the same hallway (e.g., building A, floor 1) and 0 if their apartments were on different hallways. This yields a matrix totaling 15,006 cells (diagonal cells are ignored), the number representing the total number of possible pairs in the population.
Spatial proximity could have been operationalized with a more fine-grained measure (e.g., Euclidian distance between doorsteps in feet or meters). One complication, however, was posed by the v shape of each floor (see Figure 1); a distance of 30 feet between residents on one wing may did appear perceptually equivalent to a 30-foot path spanning one wing of the hallway to another, as the former involves a direct line of sight, whereas the latter entails going round a bend. A second complication arises from RC’s three-spoke layout (three residential buildings connected to a hub). This, unfortunately, challenges the assumption of unit invariance when calculating within-building apartment distances and then proceeding to between- building apartment distances. A 50-foot span between two apartments on the same hallway, for instance, is not equivalent to the 50 feet separating apartments in building A and building C (on their indirect path via the main building). In the end, the categorical distinction of sharing a hallway—and especially a lobby, where much incidental contact at RC occurred—was the ideal way to operationalize proximity. Treating all tenants of the hallway as equally “proximal” is an analytical simplification, but one that accords with resident understandings of neighborly life (see Ross, 1977, p. 24 for an interesting account of collective hallway identity in a similar old-age residential setting). Supplementary analyses also examined the effect of sharing a building, but model fit statistics and diagnostic tests consistently showed that shared hallway was the better predictor (e.g., information criteria statistics worsened when both indicators of proximity were considered). As the results indicate, within-hallway linkages were far more common than between-hallway social ties—even in the case of hallways within the same buildings.
Interview Data
Interviewees were recruited by face-to-face contact at social activities (e.g., meals, copresence at activities), by visiting residents at their apartments, and by telephone calls. As an incentive, participants were entered in a drawing to win a $25.00 gift certificate to a popular local restaurant. Interviews were conducted in a small office in the facility or privately in interviewee’s own apartments. All interviews were conducted privately.
Social network ties were assessed at the outset of each interview. Employing widely used name-generator methods, I asked people to identify their close discussion partners: “From time to time, people will often talk with others about things that are important to them. This could include sharing good news, or bad news, sharing about concerns they might have, or otherwise just talking about things they find very important or significant. Who are the people here at [RC] that you can talk to about things that are important to you?” Prompts were used to ensure that their list was exhaustive. The names identified are referred to as close ties and are thought to represent trustworthy, supportive individuals in whom respondents can confide (McPherson, Smith-Lovin, & Brashears, 2006).
Health is the other core construct assessed during the course of the interview. After completing the section on social networks, respondents were given the RAND Medical Outcomes Short-Form 36 (SF-36) health index. This study focuses on the physical health component of the SF-36, which includes items related to physical functioning, disturbance of normal roles due to health reasons, energy/fatigue levels, social functioning and disruption of social activities, bodily pain, and overall health evaluations. Details on the items and their scoring can be found elsewhere (Hays, Sherbourne, & Mazel, 1993; Ware & Sherbourne, 1992). To avoid conflating an independent and dependent variable (health and social interaction, respectively), the two items related to social activity were removed from the index. The physical health component of the SF-36 has high reliability (α = .92). The SF-36 has also demonstrated considerable prognostic validity in a variety of study samples, including those of older adults (Hayes, Morris, Wolfe, & Morgan, 1995). Raw scores of the SF-36 can range from 1 to 100, but I standardize the measure to aid interpretation in the ERGM analysis. Because the hypotheses concern health differences between RC residents, I created a N × N matrix denoting a difference score between all 15,006 respondent pairs Y, X (123 * 122 = 15,006), where Xhealth − Yhealth ≠ Yhealth − Xhealth. For instance, if respondent X had a standardized health score of 1 and respondent Y a standardized score of −1, the XY cell would have a value of 2 and the YX cell a score of −2. To test the study’s third hypothesis concerning interaction effects, I create an addition N × N matrix with the product of health difference * shared floor in each cell.
Several additional variables were created from the interview data and are used as covariates in the analyses. Respondents were asked about their social engagement outside of RC, and a dummy variable designated those residents who reported regularly socializing with non-kin friends in the broader community. Outside social engagement represents an individual-specific predictor of social ties given and received. Females and married/coresidential partners were denoted as such with separate dummy variables. Both covariates are treated not only as individual level variables but also as dyadic bases of interaction due to shared traits or social roles (i.e., homophily, or the preference for similarity between people). Similarly, I use information about age (measured as interview year − birth year) and length of tenure in the facility (measured as interview year − self-reported year of entry) to create indicators of dyadic (dis)similarity; as the difference scores for each variable departs from 0, person X and Y grow more distinct in age and in their length of CR residence, respectively. Finally, I include a dyadic term denoting whether a pair of residents are locals (i.e., moved to RC from within the local county) to account for the possibility that long-term friendships preceding RC entrance are actually driving the patterns of social connection within the facility.
Analysis
The analysis proceeds in two stages. First, I describe properties of the close tie network using summary statistics and a plot of the residents and their social linkages. In addition to exploring basic network characteristics such as size, density, and reciprocity, descriptive analyses focus on the role of spatial proximity in producing close ties.
The second stage of the analysis uses a statistical method for testing the three hypotheses. I use an ERGM approach to model the probability of directed network ties in the population of older men and women (i.e., a tie from each actor to any other of the 122 actors). In brief, ERGMs are a tool for conceptualizing an observed network as the manifestation of underlying random processes that could have theoretically generated other observed tie configurations (Robins, Pattison, Kalish, & Lusher, 2007). The model allows a variety of parameters for network phenomena, such that a positive/negative coefficient for a specified term predicts the higher/lower odds of a tie conditional on all other observed ties in the network. In this sense, ERGM results are interpreted analogously to logistic regression. Unlike conventional logistic regression, however, ERGM facilitates a simultaneous inclusion of individual-, dyadic-, and higher order, endogenous explanatory factors, enabling us to interpret how one set of mechanisms occurs net of other processes that could predict ties in the network. That is, we can analyze how dyadic similarities or differences in health or spatial proximity can predict a tie between each set of actors while simultaneously adjusting for the personal traits (e.g., gender, partnership status) and the network level processes that could influence whether people send or receive a tie. The higher order, structural factors are especially important considerations in this context, as endogenous properties of the network itself—for example, the tendency for people to befriend the friends of their friends or to be drawn to those who many others are already drawn to—can explain patterns of association that appear attributable to individual or dyadic preference (Wimmer & Lewis, 2010). In the current context, the hypothesized dyadic effects of health (dis)similarity or sharing a hallway could instead be the product of other social forces generating the overall network.
Five structural terms are included in the model to account for this possibility. Reciprocity is particularly critical; the term models how a tie from person X to person Y increases the probability of a tie from Y to X. Including reciprocity in the model means that all parameters are interpreted as increasing or decreasing the probability of a relationship net of people’s tendency to seek and maintain mutual ties. Second, I include two terms that model transitivity in the network. Transitivity represents the tendency for people to become tied to their friends’ friends, or, put differently to “close the triangle” where a tie from person X to person Y and a tie from person Y to person Z leads to a link between X and Z. Intuitively, transitivity could be induced by someone making mutual introductions to two previously unconnected friends, or a pair of residents becoming close associates after regularly dining with a shared companion. This phenomenon ultimately results in clustering patterns within the network. The first transitivity term is geometrically weighted edgewise shared partners (gwesp), the classic case of the closed triangle mentioned earlier. I also include geometrically weighted dyadwise shared partners (gwdsp), which captures an “unclosed triangle” pattern (X → Y and Y → Z, but no tie X to Z). A positive coefficient for gwesp and a negative coefficient for gwdsp is evidence for transitivity within the network (see Papachristos et al., 2013; see also Hunter, 2007 for a more technical, but clear, exposition about the geometrically weighted aspect of these statistics). Finally, I include two terms for unequal degree distributions in the network—(a) the tendency for some people to receive many close tie nominations from their peers, geometrically weighted in-degree (gwidegree), and (b) the tendency for some respondents to nominate many of their peers, geometrically weighted out-degree (gwodegree). Including both terms adjust for outliers in the network and for the possibility of cumulative advantage processes.
Individual and dyadic level covariates were discussed in the Interview data. Individual level variables are used to assess the conditional probability of a person both sending and receiving ties. In addition to the covariates discussed previously, I flag residency in building C because the hallways are unique in their overall size. Among dyadic variables, I model health differences with a term that preserves the valence of the difference score, whereas differences in age and residential tenure are modeled with a term for absolute differences. The term edges is also included in the model as a baseline probability for tie formation (analogous to the intercept in conventional regression); a negative sign coefficient for the term indicates that net of all else in the model, any randomly chosen pair of people from the population is relatively unlikely to be connected.
Parameters for the model were estimated with Markov chain Monte Carlo (MCMC) maximum likelihood (Geyer & Thompson, 1992). This method involves an initial approximation of all model parameters and a basic simulation of the network. The simulated network is then evaluated and parameter estimates are iteratively adjusted until they converge on the observed network. A simulation-based estimation strategy is needed because standard maximum likelihood techniques (as in logistic regression) are not suitable for ERGM analysis; maximum likelihood is unable to incorporate the fact that individual and dyadic level terms are nested within the structural factors such as reciprocity and transitivity (i.e., the problem of dyadic dependence). Inference for the ERGM statistics is to differentiate “systematic properties of the social system” from “random variability”: the goal “is to represent the main features of the data set—in this case, the network—by a small number of parameter estimates and to express the uncertainty of those estimates by standard errors” (Snijders, 2011, p. 136). Consistent with typical practice, tests of statistical significance were based on the distributions of t ratios (log odds coefficient divided by standard error).
MCMC estimation was conducted with R’s Statnet package (Handcock, Hunter, Butts, Goodreau, & Morris, 2003). Model diagnostic routines available in Statnet were used to assess model fit and to ensure adequate convergence. Specifically, I assessed the traceplot summaries of parameter draws across simulation iterations to check for signs of degeneracy (i.e., model misspecification where the estimation routine collapses into unrealistic forms); there were no problematic indications. I also created plots of network statistics comparing actual values from the observed network with corresponding statistics from simulated networks, and all plots demonstrate that the simulated networks reasonably capture the basic properties of the empirical network.
Results
The RC network consists of 123 men and women and 310 total ties. This corresponds to an overall density score of .02; that is, 310 out of 15,006 possible ties (N * [N − 1] = 15,006) are observed in these data. At the individual level, tie nominations (out degree) ranged from 0 to 12, whereas ties received (in degree) ranged from 0 to 9. Figure 2 provides degree distribution for both counts. Most relationships in the network were non-mutual, as only 19% of ties were reciprocated within dyadic pairs in which at least person identified the other as his or her close discussion partner.
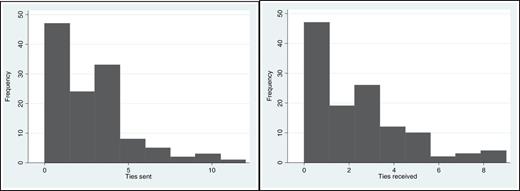
Degree distributions, close ties sent and received.
Figure 3 moves beyond overall network statistics to address the first issue of central interest in this study: the role of proximity in generating ties. The graph is a visual representation of the entire network with the respondents arrayed by their place of residence. Table 3 supplements the graph with density scores for each realm of physical space. The shaded diagonals of the matrix table emphasize within-hallway density. From these displays, it is clear that density is considerably higher within each of the 12 hallways than it is across the RC more generally. Hallways within building C (which have fewer residents than other buildings) have particularly high density relative to RC’s overall density (.02) and in comparison to the other hallways. Hallways 2 and 3, for example, reach as high as .27 and .31, respectively. Density values for two floors in building 1 also reach .16. By way of contrast, the density within building but across different hallways tends to be considerably lower, suggesting that sharing the same floor more powerfully demonstrates proximity effects than does the next, higher order level of spatial classification. Within the A and B buildings, for instance, no inter-hallway density exceeds .03, and in building C, only the C1–C2 combination reaches .04. The highest hallway-spanning density score, in fact, is not even within the same building, but between B1 and C3 (.07).
Density Scores Across Space
| Building | Floor | A1 | A2 | A3 | A4 | B1 | B2 | B3 | B4 | C1 | C2 | C3 | C4 |
|---|---|---|---|---|---|---|---|---|---|---|---|---|---|
| A | 1 | 0.16 | 0.02 | 0.02 | 0.01 | 0.01 | 0.02 | 0.01 | 0.01 | 0.00 | 0.00 | 0.01 | 0.04 |
| A | 2 | 0.08 | 0.03 | 0.01 | 0.01 | 0.02 | 0.00 | 0.03 | 0.00 | 0.02 | 0.03 | 0.01 | |
| A | 3 | 0.07 | 0.01 | 0.01 | 0.01 | 0.01 | 0.01 | 0.02 | 0.01 | 0.00 | 0.00 | ||
| A | 4 | 0.16 | 0.00 | 0.01 | 0.01 | 0.02 | 0.01 | 0.00 | 0.03 | 0.01 | |||
| B | 1 | 0.07 | 0.01 | 0.02 | 0.02 | 0.01 | 0.07 | 0.01 | 0.02 | ||||
| B | 2 | 0.05 | 0.02 | 0.01 | 0.01 | 0.01 | 0.01 | 0.00 | |||||
| B | 3 | 0.06 | 0.01 | 0.00 | 0.01 | 0.04 | 0.01 | ||||||
| B | 4 | 0.07 | 0.03 | 0.03 | 0.01 | 0.01 | |||||||
| C | 1 | 0.07 | 0.04 | 0.02 | 0.00 | ||||||||
| C | 2 | 0.27 | 0.01 | 0.02 | |||||||||
| C | 3 | 0.31 | 0.00 | ||||||||||
| C | 4 | 0.17 |
Note. Density is calculated as the proportion of ties expressed to total ties possible. Shaded diagonal cells represent within-hallway (same building and floor) density.
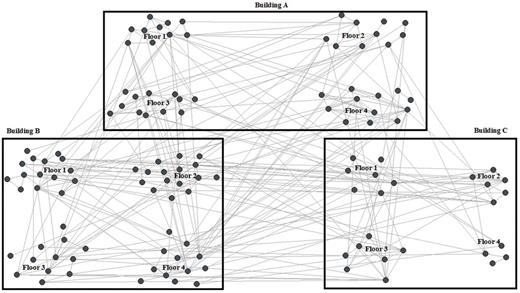
Directed social ties across physical space in retirement community.
Although suggestive, the descriptive results are not sufficient for testing the spatial hypothesis or for assessing the role of dyadic health differences. I therefore turn to the ERGM analysis to evaluate the study’s three hypotheses while adjusting for individual, dyadic, and structural covariates. Coefficients presented in Table 4 can be interpreted as conditional log odds of tie formation. Beginning with the top row, we see that hypothesis 1 is clearly supported. Net of each additional factor in the model, sharing the same hallway increases the log odds of a tie by 1.285 (p < .001)—effectively raising the odds by 3½ times. This association is net of structural features such as reciprocity.
Exponential Random Graph Model Results
| Estimate | Standard error | |
|---|---|---|
| Focal variables | ||
| Shared hallway | 1.285*** | 0.034 |
| Health difference (standardized) | −0.129** | 0.045 |
| Shared hallway × health difference | −0.169*** | 0.027 |
| Individual level covariates | ||
| See outsiders | ||
| Outgoing tie | −0.040 | 0.021 |
| Incoming tie | 0.104*** | 0.019 |
| Female | ||
| Outgoing tie | −0.096*** | 0.020 |
| Incoming tie | −0.050* | 0.020 |
| Partnered | ||
| Outgoing tie | 0.444*** | 0.024 |
| Incoming tie | 0.036 | 0.024 |
| Dyadic level covariates | ||
| Same gender | 0.578*** | 0.022 |
| Same partnership status | 0.428*** | 0.021 |
| Age difference | −0.028*** | 0.003 |
| Tenure difference | −0.048*** | 0.003 |
| Both local | 0.113*** | 0.020 |
| Structural covariates | ||
| Reciprocity | 2.116*** | 0.065 |
| gwesp | 1.272*** | 0.020 |
| gwdsp | −0.143*** | 0.005 |
| gwidegree | 0.063 | 0.073 |
| gwodegree | −0.238 | 0.052 |
| Edges | −5.136*** | 0.044 |
| AIC | 2470.3 | |
| BIC | 2637.8 | |
| Null deviance | 20802.7 | |
| Residual deviance | 2426.3 | |
Notes. gwdsp = geometrically weighted dyadwise shared partner; gwesp = geometrically weighted edgewise shared partner; gwidegree = geometrically weighted in-degree; gwodegree = geometrically weighted out-degree; AIC = Akaike information criterion; BIC = Bayesian information criterion.
Total n = 15,006; model predicts the conditional log odds of a tie between each resident (n = 123) and every other resident (n = 122). The model also adjusts for outgoing and incoming ties for building C.
*p < .05. **p < .01. ***p < .001.
Hypotheses 2 and 3 both involve dyadic health differences and can be assessed by coefficients in the second and third rows of Table 4. With the shared hallway * health differences interaction term included in the model, the main effect for health differences is interpreted as the effect of health differences on the log odds of a tie when respondents do not share the same hallway. To examine the condition of people sharing the same hallway, one adds the interaction term coefficient to the main effect health differences. This main effect coefficient is consistent with hypothesis 2. Specifically, for each standard deviation discrepancy between focal person X and person Y, the log odds of X identifying Y as a close decreases by .129 (p < .01). In the SF-36’s original raw scoring, one standard deviation corresponds to 20.5 points in the 1–100 scale (on which RC residents ranged from 14–98). As mentioned previously, ties in this network are directed and health differences are actual difference scores, not absolute difference. This means that although healthier people are less likely to identify relatively less healthy peers as their close ties, it is not true that the arrangement works correspondingly in the opposite direction. Health differences are associated with a patterned asymmetry in social tie nominations. Again, this association is net of reciprocity and other structural processes, as well as other important bases of homophily (e.g., partnership status, gender) and individual characteristics that may influence health (e.g., partnership status, social activity outside of RC).
The third hypothesis involves the interaction term examining the joint influence of proximity and health differences. Competing accounts for this interaction effect were offered at this article’s outset. The findings in Table 4 clearly support hypothesis 3b: health-based asymmetry is exacerbated, not tempered, in the most local relational contexts. The size of the effect associated with health differences is more than doubled when the dyad share the same hallway (−.129 + −.169), and the interaction term coefficient is statistically significant at a p level < .001.
In addition to these focal variables in the first three rows of Table 4, several individual and dyadic level variables merit brief remark. Residents who were socially active outside of RC were more likely to be mentioned as close discussion partners than were residents who socialized exclusively within the RC. Seeing outsiders, however, did not predict the conditional log odds of sending such a tie to others in RC. Gender was significant both as an individual level covariate and as a dyadic level covariate. Controlling for other variables, women were less likely than men to report or receive a tie with an RC peer, whereas people were more likely to report a tie with someone of the same gender. Being partnered also increased the log odds of being tied to a partnered person. Likewise, those who had previously lived in the same county as RC (i.e., locals) were relatively likely to be connected, net of other factors. Finally, two dyadic covariates decreased the probability that a given pair of RC residents would be connected: gaps in age and in length of tenancy. RC residents ranged in age from 74 to 96, indicating that some residents were born as early as World War I, whereas others not until the midst of the great depression. These generational divides appear to be meaningful when predicting the pattern of close ties. Tenure too had a wide range at RC, with about 15% of the population living in the setting for a decade or more, but slightly over half of the population having tenure of less than four years. The greater the difference between their move-in dates, the less likely the connection between any given pair.
As implied previously, reciprocity is a critical factor in understanding tie formation in this network—were ties uniformly reciprocal, there would be no additional variance for dyadic differences to explain. Reciprocity processes alone increase the odds of an observed tie eightfold (exponentiating 2.116 = 8.30). Results also clearly indicate the importance of transitivity. The gwesp coefficient is positive and strongly significant, whereas gwdsp is significant and negative. Together, these terms show that people are more likely than chance to identify as close relationships those whom their nominees select as close ties; a non-nominated third tie in that context is more unlikely than would be predicted by chance alone. Finally, the weighted in-degree, but not the out-degree, term shows up as negative and significant in Table 4. This implies that net of other factors in the model, RC residents tended to nominate a relatively consistent number of close associates.
Discussion
Building on classic research in social psychology (Festinger, Schachter, & Back, 1963) and several early studies in social gerontology (Friedman, 1966; Lawton & Simon, 1968), this article examined spatial dynamics within a self-contained RC of older adults. I looked to the intersection of proximity and assortative processes—two prevailing mechanisms by which “ties form, persist, and dissolve” (Rivera et al., 2010:91)—as a way of understanding how health-based forms of inequality unfold in physical space.
Descriptive results and findings from ERGMs support the study’s first two hypotheses. First, older adults disproportionately nominate neighbors as their close discussion partners. This pattern of network connectivity was quite predictable as it mirrors the spatial dynamics of college dorm friendships (Marmaros & Sacerdote, 2006), collaboration in the workplace (Sailer & McCulloh, 2012), and urban violence (Papachristos et al., 2013).
Results also indicate that close relationships are marked by health-related asymmetry. Had reciprocity been sufficient to explain why people send and receive ties, inequalities in health would not be relevant: people would reciprocate ties with their peers regardless of their health differences. Keeping in mind that the ERGM analysis did indeed control for these reciprocity tendencies—plus other structural network factors such as clustering and popularity—the health finding suggests that differences in physical well-being have a salient influence on people’s preferences and motivations for connection. In this way, health is a powerful assortative mechanism: it represents a pair-level conglomeration of personal attributes that can increase or decrease the probability of a tie (Rivera et al., 2010). Homophily—people’s preference for attributional similarity in their relationships—is the most commonly investigated form of assortativity, but this mechanism may be less important when it comes to dyadic health dis/similarities. Indeed, the gerontological literature provides various rationale for exploring health-asymmetric patterns of assortativity rather than dwelling on health homophily alone: given their many difficulties, less healthy people may be in the most need of close, supportive peers (Lubben, 1988; Schwarzer & Leppin, 1991); more healthy people may be less inclined to seek out core confidants in the congregate housing site and prefer weaker ties (Schafer, 2011); less healthy residents may be the least attractive as close friends (Shippee, 2008); and the most healthy people, in contrast, may be the settings’s most appealing peers. Each account of health assortativity is plausible—and in all likelihood they overlap.
The study’s third hypotheses brought together the proximity and assortative mechanisms discussed previously. This interaction between both classes of mechanisms has been raised before, often in the context of how residential proximity can lessen strict racial homophily and increase diversity within friendship networks (see Allport’s [1954] contact hypothesis and its many empirical offshoots, Pettigrew & Tropp, 2006). It is conceivable that, in line with the loftiest hopes of the contact hypothesis, repeated interaction could elicit understanding and fondness between people of differing health statuses and thereby reduce patterns of health asymmetry. This article, however, finds evidence for the opposite moderation effect. Specifically, patterns of health asymmetry were approximately twice as strong among dyads who shared the same hallway in the apartment complex than among dyads that spanned different hallways. This illustrates something of a paradox: physical proximity provides the essential ingredients for social interaction and relationship formation—resources urgently required by older adults in declining health; but in doing so, proximity also intensifies asymmetric patterns of association and produces relational inequality. In this setting, at least, relationships are most unequal when they are most local.
The locality of asymmetric close relationships touches on several themes with broader application. For one, constraints set by physical space expose the least autonomous individuals to the biggest downsides of social engagement. This study addresses this issue by examining asymmetric ties, a relational form that may be relatively unstable and ultimately less capable of delivering needed social support when it is really needed (see Hallinan, 1979; Ikkink & van Tilburg, 1998) and that can have negative mental health implications for the person with less power in a relationship (Fyrand, 2010). Beyond the narrow topic of asymmetric relations, it is important to recognize that, in general, people with relatively low autonomy are not as well-equipped to circumvent undesirable aspects of their immediate environment. Instead, they are most exposed to the vicissitudes of their locality with the least power to transcend it (this is a crucial theme revealed by environmental gerontology; see, e.g., Phillipson, 2004).
The findings from this study also point to a complexity within the well-documented association between social networks and health (see Berkman, Glass, Brissette, & Seeman, 2000). A simplistic reading of the many studies in this genre could suggest that providing opportunities for older adults to forge close relationships can only enhance health and protect against functional decline. If from the outset, however, poor health limits people’s relational options to the most proximal and/or convenient alters, the ties formed are likely to be disproportionately imbalanced. And to the extent that asymmetric ties fail to yield the full advantages of completely mutual relationships (Fyrand, 2010), initial health problems may undercut the potential health benefits of social connection itself. This conjecture, along with other findings from recent studies on networks and health (Cornwell, 2009; Haas, Schaefer, & Kornienko, 2010), imply that there are very complex causal feedback loops in the empirical association and emphasize that health has a fundamental influence on network processes. Exactly how physical space enters the picture, however, will require deeper theorization and more innovative study designs. For example, the proliferation of different congregate housing options for older adults has brought a vast collection of contexts, which vary in potentially meaningful ways (e.g., heterogeneity of population’s health, geographical connection/seclusion of the site from its broader neighborhoods and communities, ethnic and religious composition). Different types of residential settings offer distinct opportunities to integrate spatial concepts into the study of social networks and health.
Although this study has attempted to raise a host of issues related to networks, health, and physical space, it is limited by its use of cross-sectional data. This clearly restricts the types of research questions that could be posed and limits claims about causality. It is unlikely, however, that the core findings are attributable to reverse causation. Because apartment space was allocated on the basis of availability (and not health status), the link between proximity and social ties is most reasonably interpreted as a causal association. As for the study’s measures, it would have been helpful to have information about the duration of the close ties—specifically whether these relationships preceded entrance into the RC. Many of the residents had previously lived in the same broader community, and so it would be informative to assess how health decline predicts the breaking off of former close relations, or the extent to which spatial proximity in the facility can outweigh the duration of dyadic familiarity. Finally, this study consists of a single RC. Although access to full network data enables a unique set of research questions and represents an emerging analytic priority in social gerontology, the superior aspiration is to gather a large sample of multiple whole-community networks, much like the Add Health study offers for research on adolescence (Cornwell & Schafer, 2015).
In summary, this article draws attention to how proximity can foster certain forms of interpersonal inequality, suggesting that opportunities for contact can have unintended consequences and subtle downsides. Future research is needed to more fully understand not only how relational asymmetries play out for older adults in different spatial contexts and identify how those in declining health can best navigate the inherent constraints of space—both in terms of physical mobility—but also in how they form and mobilize social contacts.
Funding
This research was made possible by grants from the Purdue Research Foundation, the National Science Foundation (1003772), and the Purdue University Department of Sociology.
Acknowledgments
Perceptive criticism from the JGSS Editor and reviewers helped improve this paper. I also thank Scott Feld, Ken Ferraro, Karen Fingerman, and Jill Suitor for their comments on an earlier version of this manuscript. Kirk Fatool, Anne Howell, and Sarah Poorman were instrumental in the process of data collection and organization.
References
Author notes
Decision Editor: Merril Silverstein, PhD

