


Abstract
Life satisfaction is increasingly viewed as an asset associated with better general health, but its association with cognitive health and risk of dementia is less examined. We tested the hypothesis that higher life satisfaction would be associated with lower risk of dementia.
Participants were a nationally representative sample of adults (n = 8,021; age range: 45–93 years) from the Korean Longitudinal Study of Aging assessed every 2 years for up to 12 years. Multilevel modeling analysis examined whether life satisfaction is associated with cognitive functioning and decline. The primary analysis used Cox regression to examine the association between baseline life satisfaction and risk of incident dementia.
Between-person differences and within-person changes in life satisfaction were associated with cognitive functioning, but life satisfaction was unrelated to the rate of cognitive decline. Higher life satisfaction was also associated with lower risk of dementia, even after accounting for demographic factors, depressive symptoms, cardiovascular and functional risk factors, health behaviors, and social contact.
Satisfaction with life may function as a positive psychological resource for maintaining cognitive functioning and protecting against the risk of dementia.
The conceptual framework of positive health (Seligman, 2008) suggests that the presence of positive states and resources, rather than the mere absence of deficits and risks, are critical for health and longevity. Drawing from this model, psychological well-being measures have been conceived as positive health assets, which may confer benefits through biological (e.g., healthier biomarkers), behavioral (e.g., health behavior engagement), and psychosocial (e.g., stress buffer) pathways (Kubzansky et al., 2018). Well-being in particular is recognized as a resource for cognitive health (Gerstorf et al., 2007): Higher well-being is associated with better cognitive functioning (Allerhand et al., 2014), less cognitive decline over time (Gerstorf et al., 2007), and lower risk of dementia (Sutin et al., 2018).
Life satisfaction (LS) is a frequently assessed indicator of well-being that figure prominently in models of healthier aging (Torregrosa-Ruiz et al., 2021). LS has been defined as individuals’ “explicit and conscious evaluations of their lives, often based on factors that the individual deems relevant” (Diener et al., 2018, p. 3). LS is of particular interest because, as the definition suggests, it provides a fundamental summary of how life is going that accounts for individuals’ idiosyncratic values and priorities in life (VanderWeele et al., 2017). In line with the positive health perspective of well-being (Kubzansky et al., 2018), LS has also been viewed as a health asset (Kim et al., 2021; Nakamura et al., 2022). Theoretical models indicate biological, behavioral, and psychosocial pathways in the relation between LS and healthier outcomes that are also relevant for cognitive health (Kim et al., 2021; Kubzansky et al., 2018). First, experiencing more satisfaction with life is associated with better cardiovascular and functional health (Boehm et al., 2011; Kim et al., 2021), which are critical for preserving cognitive function and protecting against dementia (Aschwanden et al., 2020; Fauth et al., 2013). Second, when feeling positive and satisfied, individuals are more likely to exhibit behaviors that are beneficial for cognitive wellness (e.g., physical activity, less smoking, and healthier sleep and diet; Boehm et al., 2018; Strine et al., 2008), possibly through more deliberate and strategic goal pursuits (Boehm et al., 2018). Third, LS has been related to healthier stress response profiles, including better regulation of perceived stress and cortisol (Smyth et al., 2017; Zilioli & Slatcher, 2015), as well as lower anxiety and depressive symptoms (Strine et al., 2008).
Whereas theoretical models suggest a link between LS and cognitive health, this association is underexamined empirically, and available studies were limited to Western samples. Furthermore, the role of LS in the context of other risk factors, such as depressive symptoms, is unclear. Three studies have analyzed a 5-item measure of LS in the Health and Retirement Study (~80% White). One study found no unique association of LS with dementia risk after accounting for depressive symptoms (Sutin et al., 2018). A second machine learning study found that low LS ranked seventh among 52 risk factors examined for incident dementia, while emotional distress (a composite score encompassing depression) ranked second (Aschwanden et al., 2020). The third study showed that changes in LS did not predict subsequent cognitive impairment (Kim et al., 2021). In addition, a study of Canadians that used a single-item measure of LS found an association with risk of dementia but did not assess depressive symptoms (Peitsch et al., 2016). Furthermore, in a sample from England, higher average well-being (a composite score encompassing LS) across 6 years was associated with higher perceptual speed, memory, and executive function independent of depression (Allerhand et al., 2014).
In response to the growing call for inclusion of diverse research samples (Aknin et al., 2013), we focused our attention on an Asian sample from South Korea. In addition to inclusion, there were two additional reasons for our interest in this population. First, the rapidly aging population in South Korea has a high prevalence of all-cause dementia (~10% among older adults aged ≥65, compared to ~5% worldwide) that is not declining (Lee, 2014; Suh et al., 2021). Second, previous studies in samples from South Korea have focused on risk factors such as chronic conditions or depression (Boo et al., 2021; Shin et al., 2021), and less is known about protective factors such as LS. There could be cultural variations in the meaning of well-being, which may shape its associations with health outcomes (e.g., Kitayama et al., 2020). Personal happiness and staying independent and positive well into older adulthood, for example, tend to be more expected in North American cultural contexts, whereas interdependence, social embeddedness, and adjusting to age-graded norms are emphasized in East Asian contexts (Kitayama et al., 2020; Uchino et al., 2018). As noted, evidence from the U.S. population suggests that the association of LS with risk of dementia is mainly driven by more satisfied individuals having fewer depressive symptoms (Sutin et al., 2018). It is not clear whether this will be the case in the Korean population. There is evidence that suggests an association between satisfaction with one’s economic status and cognitive health independent of depression in a previous Korean Longitudinal Study of Aging (KLoSA) study (Boo et al., 2021), but the role of global evaluation of life assessed through LS is underexamined among Koreans. Such examination might serve as an initial step in testing whether the association of LS is independent of distress in cultures other than the North American context.
The primary objective of the study is to examine whether LS is prospectively associated with risk of incident dementia in the KLoSA. That is, as the positive health framework would suggest, we are interested in whether higher levels of LS are protective against the risk of incident dementia. To provide a more comprehensive account, we first examine whether LS is associated with cognitive functioning and cognitive decline. In light of evidence suggesting that LS can change over time and be associated with health within individuals (Mroczek & Spiro, 2005), we also explore whether there is a within-person association between LS and cognitive functioning. We predict that between-person differences and within-person changes in LS will be associated with cognitive functioning. We also expect that higher LS will be associated with less cognitive decline and lower risk of incident dementia. Furthermore, there is evidence suggesting that satisfaction in specific life domains (e.g., work and relationship) may be differently associated with health outcomes (e.g., Nakamura et al., 2022; U.S. sample). While domain-specific associations provide a more fine-grained understanding, the rationale for including domain satisfaction has been largely empirical rather than theoretical. To add to this empirical evidence base, as an exploratory analysis, we repeat all analytic models with all domain satisfaction indicators available in KLoSA (health, economic status, relationship with spouse, and relationship with children).
Method
Participants and Study Design
Participants are from the KLoSA (https://survey.keis.or.kr/eng/klosa/klosa01.jsp), a panel study with nationally representative data on health and well-being measures relevant for population aging. In 2006, over 10,000 adults (age ≥45 years) residing in private households across South Korea were recruited for the baseline (Wave 1) survey, and they were then assessed every 2 years up until 2018 (Wave 7). The surveys were conducted by trained interviewers through computer-assisted personal interviews at household visits with the participants. The KLoSA protocol was approved by the Institutional Review Board of the Korea Centers for Disease Control and Prevention. All participants provided written informed consent. Data on baseline age, gender, and education were from Wave 1. Cognitive assessments, LS, and other covariates (e.g., depressive symptoms) were available at every wave from Wave 1 to Wave 7. Of the 10,254 individuals participated in KLoSA at baseline, the current sample includes 8,021 participants who had valid data on baseline LS, had cognitive assessments at baseline and at least one follow-up, and had no prevalent dementia at baseline (Figure 1). Compared to the analytic sample (n = 8,021), participants (n = 1,109) with baseline measures (and no prevalent dementia) but no follow-up data had higher education levels (d = 0.16, p < .05), more depressive symptoms (d = 0.09, p < .05), more functional limitations (d = 0.12, p < .05), lower LS (d = −0.13, p < .05), and social contact (d = −0.19, p < .05); they were also more likely to exercise regularly (χ2 = 4.80, p < .05) and be current smokers (χ2 = 6.85, p < .01) at baseline. There were no differences in age, gender, cognitive functioning, or the likelihood of having hypertension, diabetes, or heart-related diseases at baseline.
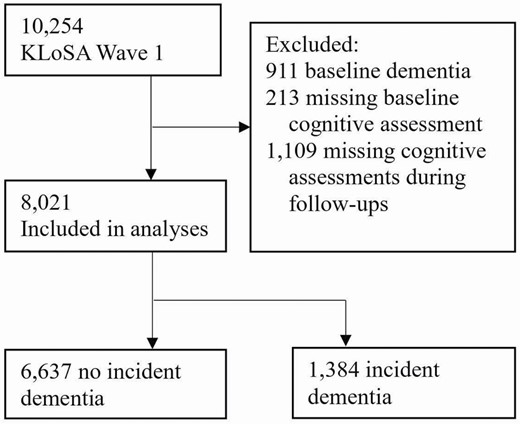
Study sample flow chart. KLoSA = Korean Longitudinal Study of Aging.
Measures
Life satisfaction
Participants rated how much they were satisfied with their life overall on a single-item measure with a scale of 0–100. Higher scores indicated greater satisfaction. Single-item measures of satisfaction are widely used in panel studies and have shown good psychometric properties and predictive validity (Cheung & Lucas, 2014).
Cognitive functioning and dementia
Cognitive functioning was assessed at each wave using the Korean version (K-MMSE; Kang et al., 1997) of the Mini-Mental State Examination (MMSE; Folstein et al., 1975). Participants answered questions administered by the interviewers that gauged basic cognitive abilities such as attention, concentration, orientation, and memory. The total possible points on the MMSE ranged 0–30, with higher score indicating better cognitive functioning. The MMSE score was used to assess possible dementia status in KLoSA (Boo et al., 2021). Following the cutoff of MMSE <18 (Tombaugh & McIntyre, 1992) that was adopted in KLoSA (Boo et al., 2021), we identified possible incident dementia as the first case of MMSE <18 during the follow-up period (Wave 2–Wave 7); cases of MMSE ≥18 were coded as “no impairment.”
Covariates
Age was a continuous variable, and gender was coded as 0 = men and 1 = women. Education levels were 1 = elementary school or lower, 2 = middle school, 3 = high school, and 4 = college/university or higher. Depressive symptoms during the last week were measured with the Korean version (Cho & Kim, 1998) of the revised Center for Epidemiological Studies Depression Scale (Andresen et al., 1994). We also controlled for other established risk factors for cognitive health (Boo et al., 2021; Fauth et al., 2013; Kuiper et al., 2015; Norton et al., 2014). Cardiovascular conditions were assessed by asking participants, “Has a doctor ever told you that you have high blood pressure/diabetes/heart-related diseases?” (1 = Yes and 0 = No for each condition). Functional limitations were measured with the Korean Activities of Daily Living (K-ADL) scale (Hong et al., 2018). The total number of tasks that a participant needed full or partial help with was created (range = 0–7 and higher scores = more limitations). For physical activity, participants reported whether they engaged in regular exercise (whether they exercised more than once a week; 1 = Yes and 0 = No). Self-reported smoking status was coded as 1 = current smokers and 0 = past/nonsmokers. For social contact, participants reported how often they meet with close friends or relatives, with higher scores indicating more frequent contact (range = 1–10; see Supplementary Material for details).
Statistical Analyses
To examine the association between baseline LS with cognitive functioning (MMSE) and decline, 2-level multilevel models (MLMs; Raudenbush & Bryk, 2002) were conducted because assessments were nested within individuals. Level 1 was the assessment level, and Level 2 was the person level. The intercept-and-slope-as-outcomes model was used to model the intercept and slope of MMSE as outcomes of LS. Linear time (coded as 0–6 for Wave 1–Wave7) was included as the Level 1 predictor to examine temporal change in MMSE. Baseline LS was included as a Level 2 predictor to examine its association with levels (intercept) of MMSE. A cross-level LS × time interaction term was included to examine whether baseline LS is associated with the rate of temporal change in MMSE. All covariates were also included at Level 2. To examine the within-person association between LS and cognitive functioning, we conducted an additional 2-level MLM: LS was the Level 1 (assessment level) time-varying predictor, and MMSE was the Level 1 outcome. Age, gender, and education were Level 2 (person level) time-invariant covariates. Depressive symptoms, cardiovascular conditions, ADL, health behaviors, and social contact were Level 1 time-varying covariates. Detailed information including equations is presented in Supplementary Analytic Approach. Multilevel modeling was conducted using PROC MIXED (SAS Institute, 2013), which uses the residual maximum likelihood estimation procedure to handle missing data. Missing values are not imputed, but all available data from each participant contribute to parameter estimates.
The primary analysis used Cox regression to examine baseline LS as predictor of incident dementia. Continuous variables were z-scored to facilitate comparison of associations. Survival time was computed in years from the year of the first assessment (baseline; 2006) up to the year of the first dementia incidence, last assessment before loss of follow-up (due to dropout or death), or censoring (2018). We tested the proportional hazard assumption and found the effect of LS not dependent on time. Model 1 included age and gender as covariates. As a sensitivity analysis based on Model 1, we conducted a model that excluded dementia cases occurred at the first and second follow-ups. The sensitivity analysis was done to account for the possibility that these participants were in the prodromal stage of dementia at baseline. Model 2 was Model 1 plus depressive symptoms. Model 3 was Model 2 plus cardiovascular conditions and ADL. Model 4 was Model 3 plus health behaviors (exercise and smoking), social contact, and education.
To explore the association of domain satisfaction, the earlier MLM and Cox regression analyses were repeated by replacing LS with domain satisfaction indicators (Supplementary Tables S1–S3).
Results
Descriptive statistics for the study variables are displayed in Table 1. Baseline age ranged from 45 to 93 years (Mean = 60.26, standard deviation [SD] = 10.10). During up to 12 years of follow-up (Mean = 9.50 years, SD = 3.61) and 76,186 person-years, there were 1,384 cases of incident dementia.
Baseline Characteristics and Survival Time for the Full Sample and by Dementia Outcome
| Total | No dementia | Dementia | |
|---|---|---|---|
| N | 8,021 | 6,637 (82.7%) | 1,384 (17.3%) |
| Age, years | 60.26 (10.10) | 58.38 (9.34) | 69.29 (8.66) |
| Age range | 45–93 | 45–90 | 45–93 |
| Women | 4,369 (54.5%) | 3,453 (52%) | 916 (66.2%) |
| Men | 3,652 (45.5%) | 3,184 (48%) | 468 (33.8%) |
| College or higher | 843 (10.5%) | 803 (12.1%) | 40 (2.9%) |
| Hypertension | 2,137 (26.6%) | 1,616 (24.4%) | 521 (37.6%) |
| Diabetes | 917 (11.4%) | 695 (10.5%) | 222 (16%) |
| Heart-related disease | 381 (4.8%) | 270 (4.1%) | 111 (8%) |
| ADL, 0–7 | 0.05 (0.46) | 0.03 (0.36) | 0.14 (0.75) |
| Exercise | 3,274 (40.8%) | 2,880 (43.4%) | 394 (28.5%) |
| Current smokers | 1,597 (19.9%) | 1,392 (21%) | 205 (14.8%) |
| Social contact, 1–10 | 7.71 (2.73) | 7.72 (2.69) | 7.66 (2.91) |
| Depressive symptoms, 0–10 | 1.33 (1.58) | 1.28 (1.49) | 1.59 (1.94) |
| Life satisfaction, 0–100 | 63.31 (20.33) | 64.33 (20.02) | 58.42 (21.05) |
| Cognitive functioning, 18–30 | 26.74 (3.20) | 27.32 (2.77) | 23.95 (3.63) |
| Survival time, years | 9.50 (3.61) | 10.19 (3.25) | 6.17 (3.43) |
| Survival time, range | 2–12 | 2–12 | 2–12 |
Note: ADL = activities of daily living (functional limitations).
Fully unconditional MLMs (with no predictor included; Raudenbush & Bryk, 2002) suggested significant within-person and between-person variability in MMSE: 46% (σ 2 = 9.68, z = 138.71, p < .0001) of the variance was within people and 54% (τ 00 = 11.26, z = 53.87, p < .0001) was between people. There was also significant variability in LS at within-person and between-person levels: 57% (σ 2 = 181.96, z = 141.37, p < .0001) of the variability was within people and 43% (τ 00 = 136.74, z = 50.10, p < .0001) of the variability was between people.
Results of conditional MLMs (with predictors) are presented in Tables 2 and 3. Controlling for all covariates, baseline LS was associated with higher cognitive functioning (MMSE intercept; Table 2). There was no interaction between baseline LS and time, suggesting that the rate of cognitive decline was not moderated by LS. There was, however, an interaction between age and time, which indicated that decline in MMSE occurred among older participants. We therefore repeated the analyses by adding an age × LS × time interaction, which was not significant (Table 2). There was a positive within-person association between LS (time-varying) and cognitive functioning (Table 3), suggesting that on occasions when individuals have higher levels of LS than their own average, they could also be expected to have better cognitive functioning.
Multilevel Models of Baseline Life Satisfaction Predicting Cognitive Functioning
| Fixed effects | Coefficient (SE) | p |
|---|---|---|
| Cognitive functioning | ||
| Intercept | 26.92 (0.07) | <.0001 |
| Age | -0.11 (0.004) | <.0001 |
| Gender | −0.75 (0.07) | <.0001 |
| Depressive symptoms, 0–10 | −0.13 (0.02) | <.0001 |
| Hypertension | −0.09 (0.07) | .23 |
| Diabetes | −0.32 (0.10) | .001 |
| Heart-related diseases | 0.22 (0.14) | .13 |
| ADL | −0.48 (0.07) | <.0001 |
| Exercise | 0.52 (0.06) | <.0001 |
| Smoking | 0.05 (0.09) | .55 |
| Social contact | −0.05 (0.01) | <.0001 |
| Education | 0.66 (0.03) | <.0001 |
| Baseline LS | 0.01 (0.002) | <.0001 |
| Age × baseline LS | 0.001 (0.0002) | <.0001 |
| Slope | ||
| Time | −0.33 (0.02) | <.0001 |
| Age × time | −0.03 (0.001) | <.0001 |
| Gender × time | −0.04 (0.02) | .14 |
| Depressive symptoms × time | −0.004 (0.01) | .54 |
| Hypertension × time | 0.05 (0.02) | .05 |
| Diabetes × time | −0.04 (0.03) | .20 |
| Heart-related diseases × time | −0.10 (0.05) | .04 |
| ADL × time | −0.03 (0.03) | .28 |
| Exercise × time | −0.01 (0.02) | .77 |
| Smoking × time | −0.06 (0.03) | .06 |
| Social contact × time | 0.02 (0.004) | <.0001 |
| Education × time | −0.002 (0.01) | .83 |
| Baseline LS × time | −0.001 (0.001) | .29 |
| Age × baseline LS × time | 0.0001 (0.0001) | .07 |
Notes: ADL = activities of daily living (functional limitations); LS = life satisfaction; SE = standard error. N = 8,016 (N = 5 missing education). Gender: 0 = men and 1 = women. Cognitive functioning were time-varying, all other variables (except time) were from the baseline (time-invariant).
Multilevel Models of Time-varying Life Satisfaction Predicting Cognitive Functioning
| Fixed effects | Coefficient (SE) | p |
|---|---|---|
| Cognitive functioning | ||
| Intercept | 26.45 (0.08) | <.0001 |
| Age | −0.15 (0.003) | <.0001 |
| Gender | −0.80 (0.06) | <.0001 |
| Education | 0.74 (0.03) | <.0001 |
| Slope | ||
| Linear time | −0.21 (0.01) | <.0001 |
| Depressive symptoms, 0–10 | −0.18 (0.01) | <.0001 |
| Hypertension | −0.17 (0.05) | .001 |
| Diabetes | −0.24 (0.06) | .0002 |
| Heart-related disease | −0.18 (0.09) | .04 |
| ADL, 0–7 | −1.41 (0.03) | <.0001 |
| Exercise | 0.47 (0.04) | <.0001 |
| Smoking | 0.11 (0.06) | .07 |
| Social contact, 1–10 | 0.10 (0.01) | <.0001 |
| Time-varying LS, 0–100 | 0.01 (0.001) | <.0001 |
Notes: ADL = activities of daily living (functional limitations); LS = life satisfaction; SE = standard error. N = 8,016 (N = 5 missing education). Gender: 0 = men and 1 = women. Age, gender, and education were from baseline, and all other covariates were time-varying.
Results of Cox regression analyses are presented in Table 4. Model 1 indicated a significant association between baseline LS and risk of incident dementia. Specifically, one SD higher score on LS was associated with 19% lower risk of incident dementia. The sensitivity analysis indicated that when dementia cases at the first and second follow-ups were excluded, the association of LS was similar (Ndementia/Ntotal = 770/7,407; hazard raio [HR] = 0.86, 95% confidence interval [CI]: 0.81, 0.92). The association of LS attenuated by ~15% but remained significant when depressive symptoms were included in Model 2. One SD higher depressive symptoms were associated with 5% higher risk of dementia. As a follow-up analysis, we tested a LS × depressive symptoms interaction, which was not significant. Model 3 indicated that further controlling for cardiovascular conditions and ADL, the association of LS was similar and still significant. Finally, Model 4 indicated that further controlling for health behaviors (exercise and smoking), social contact, and education, the association of LS further attenuated by ~38% compared to Model 2 (or Model 3) but remained significant.
Cox Regression Models of Baseline Life Satisfaction Predicting Risk of Incident Dementia
| Predictor | Model 1 | Model 2 | Model 3 | Model 4 |
|---|---|---|---|---|
| HR (95% CI) | HR (95% CI) | HR (95% CI) | HR (95% CI) | |
| Age | 3.19 (3.00–3.38) | 3.18 (2.99–3.38) | 3.16 (2.97–3.35) | 2.85 (2.67–3.05) |
| Gender | 1.79 (1.60–2.00) | 1.78 (1.59–1.99) | 1.79 (1.60–2.00) | 1.79 (1.60–2.00) |
| Life satisfaction, 0–100 | 0.84 (0.80–0.89) | 0.86 (0.81–0.90) | 0.86 (0.82–0.91) | 0.91 (0.86–0.96) |
| Depressive symptoms, 0–10 | 1.05 (1.002–1.10) | 1.05 (1.00–1.10) | 1.04 (0.99–1.09) | |
| Hypertension | 0.96 (0.85–1.08) | 0.99 (0.88–1.11) | ||
| Diabetes | 1.18 (1.02–1.37) | 1.18 (1.01–1.36) | ||
| Heart-related diseases | 0.99 (0.82–1.21) | 1.03 (0.85–1.26) | ||
| ADL, 0–7 | 1.06 (1.03–1.09) | 1.05 (1.02–1.09) | ||
| Exercise | 0.77 (0.68–0.87) | |||
| Smoking | 1.07 (0.90–1.26) | |||
| Social contact, 1–0 | 0.97 (0.92–1.02) | |||
| Education | 0.72 (0.66–0.77) |
Notes: ADL = activities of daily living (functional limitations); CI = confidence interval; HR = hazard ratios. Model 1–3: Ndementia/Ntotal = 1,384/8,021; Model 4: Ndementia/Ntotal = 1,382/8,016 (N = 5 missing education). Gender: 0 = men, 1 = women.
Finally, all domain satisfaction measures were associated with lower risk of dementia: Satisfaction with health showed the strongest association (32% lower risk of dementia), followed by satisfaction with economic status (22% lower risk), and relationships with spouse or children (both 10% lower risk; Supplementary Table S3). The results of the MLM analyses of domain satisfaction are reported in Supplementary Material (Tables S1−S2; Figures S1−S4).
Discussion
The present study examined longitudinal data from a nationally representative sample of Koreans to test whether LS is associated with cognitive functioning, cognitive decline, and risk of incident dementia. We found that between-person differences and within-person changes in LS were associated with levels of cognitive functioning, but LS was unrelated to the rate of cognitive decline. Nonetheless, higher baseline LS was prospectively associated with lower risk of incident dementia during up to 12 years of follow-up. The association was robust and remained significant when accounting for demographic variables, depressive symptoms, cardiovascular conditions, functional limitations, health behaviors (exercise and smoking), and social contact. Notably, the effect size for LS (10%–19% lower risk of dementia) was at least twice as large compared to the effect size found for depressive symptoms (5% higher risk) in the same sample.
Although our predictions were partly supported, as baseline LS was related to cognitive functioning but not the rate of decline, this indicates that more satisfied individuals could be expected to have consistently better cognitive functioning over time. Meanwhile, although LS fluctuated within individuals, there was a within-person association between LS and cognitive functioning. On occasions when people are more satisfied relative to their own average levels, they could also be expected to score higher on cognitive functioning. Together, these associations between LS and cognitive functioning suggest that LS may not only be a cognitive health asset that some people tend to possess more than others do; even within an individual, it could be cognitively beneficial when increased satisfaction is experienced. Therefore, the between-person and within-person perspectives provide a more complete picture of the link between LS and cognitive health.
The association between LS and risk of dementia independent of depressive symptoms is in line with the conceptual framework of positive health (Seligman, 2008), which posits that the presence of positive resources is beneficial independent of the absence of risks and distress. Not surprisingly, however, the association of LS with risk of dementia appeared to be partly explained by depressive symptoms, which attenuated the effect size of LS by ~16%. The association between depressive symptoms and risk of dementia has been demonstrated in previous analyses of KLoSA data (Boo et al., 2021) as well as a meta-analysis of evidence from diverse geographic areas and cultures (Diniz et al., 2013). The health assets perspective of well-being (Kubzansky et al., 2018) delineates a psychosocial pathway, where well-being lowers levels of distress and/or buffers the health consequence of distress. Our finding suggests that LS may afford cognitive benefits partly through the absence or low levels of depressive symptoms. However, LS may not moderate or buffer the detrimental consequence of depressive symptoms, as there was no interaction between LS and depressive symptoms. In addition to depressive symptoms, the association of LS was attenuated by health behaviors and social contact but not cardiovascular and functional health. As such, the link between LS and cognitive health may be better explained through the psychosocial and behavioral pathways than cardiovascular and functional pathways (Kim et al., 2021; Kubzansky et al., 2018).
As noted, previous evidence from a U.S. sample suggested that the association of LS with risk of dementia was not independent of depressive symptoms (Sutin et al., 2018). The difference from our findings might be partly reflective of cross-cultural variations in the construal of positive and negative sides of well-being. For example, cross- cultural evidence suggests that negative effect tends to be considered the opposite of positive affect, and the striving for the latter is prioritized in the U.S. context, whereas positive and negative affect are construed as complementary, and the balance of both is stressed in the East Asian context (Uchida et al., 2004). Likewise, the substantial correlation between high depressive symptoms and low satisfaction may in part explain the lack of unique association of LS in the U.S. context (Sutin et al., 2018). Indeed, the correlation between depressive symptoms and LS in the current sample (r = −0.21) was weaker compared to that in the U.S. context (e.g., r = −0.42; Sutin et al., 2018). Furthermore, previous evidence suggests that negative affect is considered more acceptable and is only weakly associated with physical and mental health in the East Asian context compared to the U.S. context (Curhan et al., 2014). Studies have also, however, reported more mental health-related stigma (Krendl & Pescosolido, 2020) and lower reporting of depression (Li et al., 2021) in Eastern countries. The earlier factors may partly explain the relatively weaker effect of depressive symptoms in the present study. Together, the findings from the U.S. context suggested that the LS-dementia association was mainly driven by individuals with low satisfaction experiencing psychological distress (Sutin et al., 2018), whereas the present study suggests that even after accounting for distress, the positive dimension of well-being (LS in this case) may have independent protective effects that prevail over the negative effects of distress. Discrepancies in findings between samples from East and West regions may partly reflect cultural variations in the relationship between positive and negative sides of well-being. More cross-cultural evidence is needed to further test this interpretation.
LS may be a higher-order asset reflective of various resources that individuals perceive in their lives (Diener & Fujita, 1995; Diener et al., 2018). This resource availability may in turn encourage the deployment of the resources and drive behaviors beneficial for health and cognition. Indeed, LS is beneficial for health behavior engagement and the maintenance of these behaviors over time (Boehm et al., 2018; Grant et al., 2009; Kim et al., 2017, 2021). Higher LS has also been associated with more favorable biological profiles linked to better cognitive health, such as less inflammation (Schmidt et al., 2002; Uchino et al., 2018). In addition, other dimensions of well-being may function as possible pathways through which LS benefits cognitive health. For example, purpose in life, which concerns the extent one lives a life with goals and direction, has been shown to be a protective factor against incident dementia (Sutin et al., 2021). We were not able to examine other well-being constructs because they were not assessed in KLoSA. Future research could address whether the benefit of LS is distinct from other dimensions of well-being or whether the association of LS may be mediated by the latter.
In addition to the global evaluation of LS, satisfaction in specific domains was also associated with lower risk of dementia. The association of health satisfaction was consistent with previous research suggesting a robust link between self-rated health and risk of dementia (Stephan et al., 2021). Economic satisfaction has been associated with risk of dementia in a previous study analyzing Waves 2–6 of KLoSA (Boo et al., 2021). Low satisfaction with one’s economic status may reflect subjective social status and the associated chronic stress, which has been linked to disparities in longevity, health, and cognitive aging (Marmot, 2004; Peterson et al., 2021). Positive social relationships are consistently associated with lower risk of dementia (Kuiper et al., 2015; Liu et al., 2021). The relatively weaker association we found for relationship satisfaction may be in part due to range restriction, as most people reported high satisfaction with their relationships with spouse (Mean = 72.05 out of 100, SD = 19.00, skewness = −0.85) and children (Mean = 75.11, SD = 18.86, skewness = −1.11).
Strengths and Limitations
Strengths of the current study include the large and representative sample, the focus on the underexamined East Asian cultural context, and the longitudinal assessments over a 12-year follow-up. The study used multiple analytic methods and accounted for potential confounding factors that were not systematically considered in previous research. For example, we accounted for depressive symptoms, a major confounder found in previous research (Sutin et al., 2018), and found that the association of LS was over and above depressive symptoms. As a noted limitation, dementia status was based on the MMSE and not a clinical diagnosis. While the MMSE is widely used in research and clinical contexts, this screening instrument may misclassify some participants. However, complete clinical evaluations are generally not feasible in large panel studies like the KLoSA. The loss of power and potential biases due to measurement error should be considered against the benefit of the larger, less selective, and more representative sample. Furthermore, it has been suggested that slightly stronger associations between psychosocial functioning (e.g., personality and purpose in life) and risk of Alzheimer’s disease and dementia tend to be found in studies that used a comprehensive clinical diagnosis compared to studies that relied on performance-based diagnosis (Aschwanden et al., 2020; Sutin et al., 2021). We therefore note the potential underestimation of the associations due to the use of MMSE scores to evaluate dementia risk. Another common limitation in studies of risk factors for dementia is the possibility that the associations could be due to reverse causality given the long preclinical phase of Alzheimer’s disease and related dementias. While we cannot rule out such a possibility, the protective effects of LS persisted when dementia incidence that occurred within the first 4 years was excluded. While relatively low in this longitudinal study, attrition can also bias the study estimates. In addition, the current data set did not allow an examination of other facets of well-being, such as positive affect and purpose in life. These processes, along with other potential pathways, remain to be examined in future research.
Conclusion
The present findings suggest that satisfaction with life may serve as a positive psychological resource to maintain cognitive functioning and protect against the risk of dementia. The study expands previous research on well-being and cognitive health by examining an East Asian sample and showing that satisfaction might be an independent psychological resource beyond the absence of diseases and depressive symptoms. Maintaining or even improving subjective well-being as a modifiable factor (Bolier et al., 2013) is promising for promoting cognitive health and reducing risk of dementia.
Acknowledgments
We thank the Korea Employment Information Service (KEIS) for providing the Korean Longitudinal Study of Aging (KLoSA), which was the data source of this work. The data and study documents are publicly available at the KLoSA website: https://survey.keis.or.kr/eng/klosa/klosa01.jsp. This work was not preregistered.
Funding
This work was supported by the National Institute on Aging at the National Institutes of Health (grant numbers R01AG068093, R01AG053297, R01AG074573). The content is solely the responsibility of the authors and does not necessarily represent the official views of the National Institutes of Health.
Conflict of Interest
None declared.

