


Background: Immigrants to Europe account for a significant proportion of births in a context of rising caesarean rates. We examined the risk of planned and emergency caesarean section (CS) by immigrants’ length of residence in Norway, and compared the results with those of non-immigrants. Methods: We linked population-based birth registry data to immigration data for first deliveries among 23 147 immigrants from 10 countries and 385 306 non-immigrants between 1990–2009. Countries were grouped as having low CS levels (<16%; Iraq, Pakistan, Poland, Turkey, Yugoslavia, Vietnam) or high CS levels (>22%; the Philippines, Somalia, Sri Lanka, Thailand). Associations between length of residence and planned/emergency CS were estimated as relative risks (RR) with 95% confidence intervals (CI) in multivariable models. Results: In the immigrant group with low CS levels, planned, but not emergency, CS was independently associated with longer length of residence. Compared with recent immigrants (<1 year), the risk of planned CS was 70% greater among immigrants with residency of 2–5 years (RR 1.70, CI: 1.19–2.42), and twice as high in those with residency of ≥6 years. (RR 2.01, CI: 1.28–3.17). Compared with non-immigrants, immigrants in the low group with residency <2 years had lower risk of planned CS, while those with residency >2 years had greater risk of emergency CS. In the high group, the risk of planned CS was similar to non-immigrants, while emergency CS was 51–75% higher irrespective of length of residency. Conclusion: Efforts to improve immigrants’ labour outcomes should target subgroups with sustained high emergency caesarean risk.
Introduction
Greater migration to industrialized countries has led to an increasing proportion of births among immigrant women. In 1990, immigrant women accounted for 7% of births in Norway; this number rose to 23% in 2010, and similar proportions can be found across Europe.1 Assuring immigrants’ access to obstetric care is therefore a growing concern.2 One indicator of the quality of obstetric care is the incidence of caesarean section (CS) as a percentage of live births. Disparities in CS rates among and within countries indicate inequity and both underuse and overuse.3–5 Although it is a potentially lifesaving intervention, CS is associated with increased maternal risk, especially pronounced for emergency CS procedures.6,7 Subsequent pregnancies also carry an elevated risk of uterine rupture and placenta accreta and abruptio.8–10
Previous studies have shown both higher and lower CS rates among immigrants in comparison with the host population.11 These differences have been linked to maternal country of origin,12–17 maternal morbidity and cephalopelvic disproportion,18 patient preference,19 socio-economic position,20 immigration class21 and public or private provider.22 Low CS rates could be due to self-selection to migration of on average healthier individuals than the general population.23 However, expectations of an increasing acculturation imply that immigrants’ pregnancy outcomes would converge towards those of the majority population,24 although this effect could be outcome-specific.25 Immigrants’ length of time in residence is a predictor of perinatal outcomes post-migration and could be associated with planned or emergency caesarean delivery through changes in patient preferences, provider preferences or biological parameters.26,27 A recent review suggested a positive association between length of residence and CS rates, but studies are few.11,21,28 Previous studies did not use a detailed length-of-residence classification, and few studies have differentiated between planned and emergency CS. Thus, further clarification of the association between immigrants’ length of stay and CS is warranted.
We aimed to examine the risk of CS in primiparous immigrants according to their time in residence, and to compare the CS risk with that of non-immigrants. The Norwegian context provides an appropriate setting because all births occur within the public health system, which offers free maternal care. First, we compared the incidence and relative risks of planned and emergency CS among immigrants with different lengths of residence with the risk among non-immigrants. Second, we made an internal comparison among immigrants only.
Methods
This was a population-based study linking data from the Medical Birth Registry of Norway (MBRN) to immigration and socio-economic data. Information on all pregnancies ending after 12 weeks of gestation is reported to the MBRN. For this study, data from the National Population Register provided information about the woman’s first date of immigration to Norway and Statistics Norway provided information on maternal country of birth and education level. Registry linkages were enabled by unique personal identification numbers. The study was approved by the Regional Ethics Committee of Norway East.
Study population
We included deliveries in Norway among primiparous immigrant women from outside Scandinavia between 1 January 1990 and 31 December 2009. We chose to examine first deliveries only to avoid the influence of the delivery mode in a previous pregnancy. Furthermore, we limited our sample to the 10 largest country groups to be able to perform analyses by country of birth, as a broader classification could conceal real differences. A woman was defined as an immigrant if she was foreign-born of foreign-born parents.29 We included deliveries among non-immigrants as a reference group. We excluded 160 (0.7%) women who delivered at gestation <22 weeks with a birth weight <500 g or unknown birth weight. Women with negative values for length of residence (birth registered before immigration) were excluded (n = 523, 2.2%). A delivery of multiples was counted as one. The final study population consisted of 23 147 deliveries among immigrants and 385 306 among non-immigrants. The 10 country groups were Pakistan (n = 3086), Vietnam (n = 2695), Philippines (n = 2457), Poland (n = 2400), Sri Lanka (n = 2265), the former Yugoslav countries (Bosnia-Herzegovina, Croatia, Macedonia, Montenegro, Serbia and Slovenia, n = 2187), Iraq (n = 2165), Somalia (n = 2014), Thailand (n = 1965) and Turkey (n = 1913). These 10 groups comprised 2.8% of first births in Norway in 1990 and 9.9% of first births in 2009. The sample included 63% of first births to immigrants born outside Scandinavia.
Main exposures
Length of residence was the main exposure, defined as the difference between the year of first immigration to Norway and the year of delivery. The final analyses were performed with length of residence in quartiles, resulting in the intervals <1 year (Q1), 1 year (Q2), 2–5 years (Q3) and ≥6 years (Q4).
The CS rates differed by maternal country of birth (Supplementary Data). We assumed that there could be a differential effect of length of residence, depending on the CS rate. Women from country groups with a CS rate that was similar to or lower than that of non-immigrants (<16%) were pooled into a low CS level group. This group included the former Yugoslav countries, Iraq, Pakistan, Poland, Turkey and Vietnam (CS range: 13.3–15.7%, n = 14 446). Conversely, women from country groups with an elevated CS rate were pooled into a high CS level group, which included the Philippines, Somalia, Sri Lanka and Thailand (CS range: 22.0–26.2%, n = 8701). To assure that this classification was not confounded, we estimated the risk of CS in each country group adjusted for available sociodemographic factors, which did not change the group classification. For simplicity, we refer to the two groups as the ‘low’ and the ‘high’ groups.
Outcome variables and co-factors
The main outcome was delivery by CS, which was further differentiated into planned and emergency procedures. A planned CS included procedures that were decided more than eight hours before birth start, whereas emergency CS was defined as a procedure decided less than eight hours before birth start.30 We reclassified unspecified procedures (5.5% of all CS) as planned (8.0%) if birth start was by CS; otherwise they were recoded as emergencies (92.0%).
Based on available literature, we pre-selected co-factors that could be associated with length of residence and CS.31 We extracted information on year of delivery, maternal age at delivery in years, gestational age in weeks and level of birth facility (number of births/year). Obstetric variables included multiple gestation, pregestational diabetes, preeclampsia (including hypertension in pregnancy and eclampsia), placenta praevia, placental abruption, small-for-gestational age infants (SGA) and large-for-gestational age infants (LGA) (5th and 95th percentiles of Norwegian standard growth curves).32 The presence of dystocia (foetopelvic disproportion or abnormal labour) was determined for CSs only, as the diagnosis might be assigned as a post-hoc justification, rather than representing a maternal condition.33 Among immigrants, we further included age at immigration to Norway and year of arrival. For the variable gestational length, 4.6% of cases had missing values, while for other variables <1% of the data was missing and were excluded from the multivariable analyses.
Statistical analyses
Means were compared with T-test/ANOVA, and categorical variables were compared using the χ2 test and the χ2 test for trend. CS is a common event; therefore, to directly assess the proportional risks, we used Poisson regression within generalized linear models to estimate the association between quartiles of length of residence and CS as relative risks (RR) with 95% CI. Statistical significance was defined at P < 0.05.
First, we compared risks among immigrants by different lengths of residence with non-immigrants. In the multivariable model, we included year of delivery, maternal age, gestational age as well as level of birth unit. In the main model, we further included maternal/foetal morbidity, which did not change the pattern of results. Including birth weight of the infant did not change the results. Second, we made an internal comparison among immigrants using immigrants with length of residence of <1 year as the reference. We stratified this model by country of birth, age at immigration and year of arrival.
To replace analysis of indications for a CS which are not registered in the MBRN, we used the Robson classification.34 Thus, we repeated analyses limited to pregnancies that usually have a low risk of CS, i.e. those with a singleton fetus ≥37 gestational weeks and in cephalic presentation. These comprised 88% of births in both immigrants and non-immigrants and included Robson Groups 1 (‘allowed’ to proceed to spontaneous labour) and 2 (pregnancy interrupted by induced labour or CS before labour). All analyses were conducted using SPSS Version 20 (IBM Corp., Armonk, NY, USA).
Results
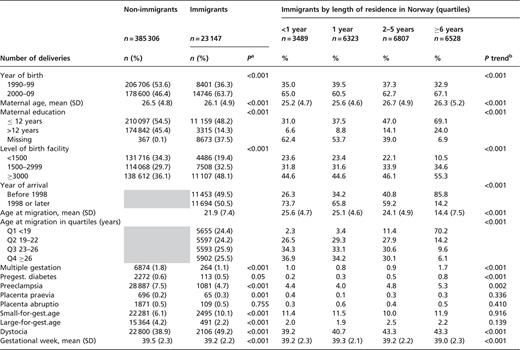
Immigrants and non-immigrants differed in most characteristics (table 1). Dystocia was more frequently registered in caesarean deliveries among immigrants than among non-immigrants. Women from Vietnam, the former Yugoslav countries and Pakistan had the highest proportion of the longest residencies (≥6 years) before the first delivery, while women from Poland, Thailand and Iraq had the highest proportion of the shortest residencies (<1 year). As length of residence in Norway increased, immigrants’ age at immigration decreased.
Characteristics of primiparous non-immigrants and immigrants, by length of residence in Norway, 1990–2009
 |
|
Preeclampsia includes pregnancy-induced hypertension and eclampsia. SGA, small-for-gestational age, 5 percentile. LGA, large-for-gestational age, 95 percentile.
Dystocia is calculated for caesarean births only.
a: χ2 test for differences between non-immigrants and immigrants. Means compared with independent samples t-test.
b: χ2 test for trend by immigrants’ length of residence. Means compared with ANOVA.
Characteristics of primiparous non-immigrants and immigrants, by length of residence in Norway, 1990–2009
|
|
Preeclampsia includes pregnancy-induced hypertension and eclampsia. SGA, small-for-gestational age, 5 percentile. LGA, large-for-gestational age, 95 percentile.
Dystocia is calculated for caesarean births only.
a: χ2 test for differences between non-immigrants and immigrants. Means compared with independent samples t-test.
b: χ2 test for trend by immigrants’ length of residence. Means compared with ANOVA.
In unadjusted analyses, CS rates among immigrant were higher compared with non-immigrants and this was due to a 30% higher incidence of emergency CS (14.8% among immigrants vs. 11.5% in non-immigrants, table 2). Increasing length of residence was associated with increased CS rate in the ‘low’ group (Iraq, Pakistan, Poland, Turkey, former Yugoslav countries and Vietnam). In this group, the CS rate in immigrants with residence <2 years was lower than among non-immigrants, while the CS rate in women with ≥6 years of residency was higher than among non-immigrants. Among women in this group who had a CS, the proportion that was planned increased from 17 to 25% across increasing length of residence. The proportion of planned CS in non-immigrants was 24%. In a subanalysis of Robson Group 1, the CS rate was identical to that of non-immigrants (6.1%). This was also the case for Robson Groups 1 and 2 combined (CS rate 10.1%; Supplementary Data).
Caesarean section in primiparous non-immigrants and immigrants, by length of residence, Norway 1990–2009
| Population group | Population | Caesarean section | Planned caesarean | Emergency caesarean |
|---|---|---|---|---|
| n | % (95% CI) | % (95% CI) | % (95% CI) | |
| Non-immigrants | 385 306 | 15.2 (15.1–15.3) | 3.7 (3.7–3.8) | 11.5 (11.4–11.6) |
| All immigrants | 23 147 | 18.5 (18.0–19.0) | 3.7 (3.5–4.0) | 14.8 (14.3–15.2) |
| By length of residence: | ||||
| <1 year | 3489 | 15.2 (14.1–16.5) | 2.8 (2.3–3.4) | 12.5 (11.4–13.6) |
| 1 year | 6323 | 17.4 (16.4–18.3) | 3.1 (2.6–3.5) | 14.3 (13.5–15.2) |
| 2–5 years | 6807 | 20.7 (19.7–21.7) | 4.3 (3.8–4.8) | 16.4 (15.6–17.3) |
| ≥6 years | 6528 | 19.0 (18.0–20.0) | 4.3 (3.8–4.8) | 14.7 (13.9–15.6) |
| Low CS-levela | 14 446 | 14.8 (14.2–15.4) | 3.2 (2.9–3.5) | 11.6 11.1–12.2 |
| By length of residence: | ||||
| <1 year | 2280 | 11.7 (10.4–13.1) | 2.0 (1.5–2.7) | 9.7 (8.5–11.0) |
| 1 year | 3904 | 13.1 (12.0–14.2) | 2.2 (1.8–2.7) | 10.9 (9.6–11.9) |
| 2–5 years | 3494 | 15.7 (14.5–17.0) | 3.7 (3.1–4.3) | 12.0 (11.0–13.2) |
| ≥6 years | 4768 | 17.0 (16.0–18.1) | 4.2 (3.6–4.8) | 12.9 (11.9–13.9) |
| High CS-levelb | 8701 | 24.6 (23.7–25.50) | 4.6 (4.2–5.1) | 20.0 (19.1–20.8) |
| By length of residence: | ||||
| <1 year | 1209 | 21.9 (19.6–24.4) | 4.2 (3.2–5.5) | 17.7 (15.6–20.0) |
| 1 year | 2419 | 24.3 (22.6–26.0) | 4.4 (3.6–5.3) | 19.8 (18.3–21.5) |
| 2–5 years | 3313 | 25.9 (24.4–27.5) | 4.9 (4.2–5.7) | 21.0 (19.7–22.5) |
| ≥6 years | 1760 | 24.3 (22.3–26.3) | 4.5 (3.6–5.6) | 19.7 (17.9–21.7) |
a: Including women from Iraq, former Yugoslav countries, Pakistan, Poland, Turkey and Vietnam.
b: Including women from the Philippines, Somalia, Sri Lanka and Thailand.
In the ‘high’ group (Philippines, Somalia, Sri Lanka and Thailand), the planned and emergency CS rates did not vary much across length-of-residence categories. The proportion of caesareans that were planned remained at 18–19% across length-of-residence categories. In Robson Group 1, the CS rate was twice as high among immigrants (13.7%) as among non-immigrants. This was also the case for Robson Groups 1 and 2 combined (CS rate 21.1%; Supplementary Data). The results by country groups were consistent with the findings in the pooled groups, except for Somali women where the proportion of planned CS decreased with increasing length of residence. Operative vaginal delivery and induction of labour were not associated with length of residence in either immigrant group.
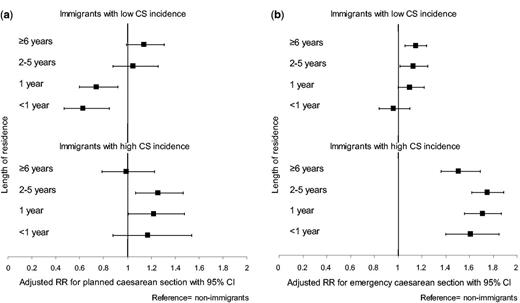
The relative risks of (a) planned and (b) emergency caesarean section by length of residence vs. non-immigrants, Norway 1990–2009. The low incidence group included women born in Iraq, former Yugoslav countries, Pakistan, Poland, Turkey and Vietnam. The high incidence group included women born in the Philippines, Somalia, Sri Lanka and Thailand. Risk was adjusted for maternal age, year of delivery, birth facility, multiple delivery, gestational age, pregestational diabetes, preeclampsia, placenta praevia and abruptio, small-for-gestational and large-for-gestational age infants.
In the ‘high’ group, the risks of planned CS were largely similar to those of non-immigrants, except for the 2–5 years group (figure 1). However, the main finding was a 51–75% increased risk of emergency CS for immigrants across all residency categories in comparison with non-immigrants. This was also the case in Robson groups 1+2 where the risk was doubled across residency categories in comparison with non-immigrants.
The multivariable analyses including immigrants only are presented in table 3. In the ‘low’ group, the adjusted risk of CS increased with increasing categories of length-of-residence (P trend 0.008) and the risk was associated to planned CS (P trend <0.001). Compared with newly arrived immigrants (<1 year), the risk of planned CS was increased with 70% among immigrants with residence of 2–5 years, and the risk was twice as high in those with residency of 6 years or more. There was no trend in the risk of emergency CS in the ‘low’ group. The results remained unchanged in women aged ≥19 years at immigration, while in women <19 years no association was found. In the ‘high’ group, there was no trend across categories of residence regardless of CS type.
Relative risk of caesarean section in low- and high incidence primiparous immigrants by length of residence, Norway, 1990–2009
| Population group | Caesarean section | Planned caesarean | Emergency caesarean | ||||
|---|---|---|---|---|---|---|---|
| aRR (95% CI) | P trend | aRR (95% CI) | P trend | aRR (95% CI) | P trend | ||
| Low CS-levela | |||||||
| Immigrants length of residence: | 0.008 | <0.001 | 0.292 | ||||
| <1 year | 1.00 (Reference) | 1.00 (Reference) | 1.00 (Reference) | ||||
| 1 year | 1.13 (0.97–1.31) | 1.14 (0.78–1.65) | 1.12 (0.87–1.41) | ||||
| 2–5 years | 1.23 (1.06–1.44) | 1.70 (1.19–2.42) | 1.13 (0.96–1.35) | ||||
| ≥6 years | 1.27 (1.03–1.56) | 2.01 (1.28–3.17) | 1.11 (0.95–1.33) | ||||
| High CS-levelb | |||||||
| Immigrants length of residence: | 0.201 | 0.726 | 0.214 | ||||
| <1 year | 1.00 (Reference) | 1.00 (Reference) | 1.00 (Reference) | ||||
| 1 year | 1.07 (0.92–1.24) | 0.98 (0.70–1.39) | 1.09 (0.92–1.29) | ||||
| 2–5 years | 1.13 (0.96–1.32) | 1.08 (0.76–1.55) | 1.14 (0.96–1.35) | ||||
| ≥6 years | 1.06 (0.81–1.38) | 0.91 (0.49–1.66) | 1.09 (0.81–1.47) | ||||
Relative risk adjusted for maternal age, year of delivery, year of arrival, age at immigration, level of birth facility, multiple delivery, gestational age, pregestational diabetes, preeclampsia, placenta previa, abruptio placentae (only for CS and emergency CS) and small-for-gestational age (5 percentile) and large-for-gestational age (95 percentile). Test for trend in Poisson multiple regression models.
a: Including women from Iraq, former Yugoslav countries, Pakistan, Poland, Turkey and Vietnam.
b: Including women from the Phillippines, Somalia, Sri Lanka, and Thailand.
Discussion
This study is the largest European study to date to examine the association between an immigrant’s length of residence and risk of CS. We found that associated risks varied according to low or high uptake of CS and also differed for planned versus emergency CS. In the immigrant group with low CS rates, women who had lived in Norway for ≥2 years were more likely to deliver by planned CS, compared with women of shorter residencies. There was no similar association for emergency CS. Comparing immigrants in the low group with non-immigrants, planned CS risk converged by 2–5 years of residence in Norway. For emergency CS, the risks were greater after ≥2 years of residency compared with the majority population. Among immigrants in the high group, planned CS risk were not different; however, the risk of emergency CS was higher than among the majority population irrespective of length of residency.
The strengths of this study include the high quality and completeness of the data on exposure, a detailed length-of-residence classification and the ability to differentiate between types of CS. Differential misclassification of CS is believed to be minimal and unlikely to affect the associations that were found. The present study also had limitations. The pooling of immigrants into ‘low’ or ‘high’ CS rate groups was not driven by a prior hypothesis, and the groups were diverse in characteristics and migration history. However, a stratification by country of birth was mainly consistent with the pooled results. We controlled estimates for maternal morbidity; however, we did not have information on all potential confounders (i.e. maternal BMI) and thus cannot exclude confounding by unmeasured factors. Maternal education was not included in models due to a high proportion of missing values among recent immigrants
Our study found that the association between immigrants’ length of residence and CS varies with maternal country of birth. These associations were robust and remained in adjusted models and across sub-analyses. Two studies from Canada showed higher likelihood of CS among recent immigrants (<2 years and <5 years) compared with immigrants with longer residencies.21,28 However, the type of CS was not distinguished. A recent study comparing emergency CS to planned CS or vaginal delivery in Canadian immigrants did not find an effect of length of residence (cut-off <2 years), which is in accordance with our findings.20 A recent UK study found a length-of-residence effect on the likelihood of emergency CS in multiparous, but not primiparous women.35 However, none of these studies differentiated immigrant groups by CS level which could explain the inconsistencies found.
Although our study cannot determine causal relations, the rapid change in planned CS risk with increasing length of residence after adjusting for biological risk factors is likely a result of social inclusion. Markers of successful integration, such as majority language skills, education and work participation increase with length of stay in Norway.36 Integration is likely to affect women’s delivery preferences and to empower women to present these to health staff, even in the absence of a medical indication. Acculturation processes work both ways and may also change the attitudes and decision-making of health staff. The interaction between age at immigration and length of residence categories is consistent with mechanisms of a relatively rapid acculturation to delivery norms and desires of the majority population. Women that arrived at a young age are integrated into the host educational system and are further likely to differ from older immigrant women in terms of resources and support.
However, for immigrants from some countries, we did not find this pattern of convergence with local norms, indicating a higher burden of intrapartum complications. In general, abnormal labour/dystocia and foetal distress are the most common indications for intrapartum CS.37 Diabetes and high maternal BMI could increase the risk of abnormal labour through effects on the infant’s birth weight; however, birth weight was not an independent predictor for emergency CS. Furthermore, a combination of short maternal stature and paternal characteristics could affect the occurrence of dystocia. We found a high proportion of ethnic Norwegian partners among women born in Thailand and the Philippines; however, Philippine-born women have been shown to have an increased CS risk irrespective of the partner’s origin.18 Other explanations could be poor compliance with having a planned CS, as shown among Somali women.19 However, our findings remained after excluding this group. Furthermore, high emergency CS rates could be a result of compromised prenatal risk identification. Interestingly, we found a declining uptake of planned CS with increasing residence among Somali women, probably due to an increase in deinfibulation.19,38 Nevertheless, this has not translated into reduced CS levels. Primiparous Somali women still experience the highest level of both overall and emergency CS in our study. Finally, studies have shown that disadvantaged women are more likely to receive an emergency CS.39 However, as socio-economic position improve across length of residence in most immigrant groups to Norway, this is unlikely to be the sole explanation of our findings.36 Clinical studies are needed to identify the mechanism for the sustained high CS rates among particular country groups.
In summary, acculturation processes regarding delivery mode do not seem to impact uniformly across immigrant subgroups. When evaluating equity in labour outcomes, both country of birth and length of residence should be taken into account. Our findings show that a broad geographical classification would even out real differences. The criteria for selection to a planned CS, derived from the majority population, might not be suitable for the identification of high-risk immigrant women. While current policy to reduce the planned CS rate is appropriate for non-immigrants, the policy focus for certain immigrant groups should be to reduce emergency CS through more active prenatal engagement among subgroups with sustained elevated risk.
Funding
This work was supported by a grant from the Norwegian Resource Centre for Women’s Health, Women and Children's Division, Oslo University Hospital, Norway.
Conflicts of interest: None declared.
The likelihood of planned caesarean delivery increased with increasing length of residence in immigrants with low overall caesarean rates, reaching the levels in non-immigrants after 2 years of stay.
The 50–75% elevated likelihood of an emergency caesarean delivery among certain immigrant groups was not mitigated with increasing length of residence.
Efforts to improve labour outcomes should focus on better pre-birth assessment of immigrant subgroups with a sustained high likelihood of emergency caesarean section.
Acknowledgements
The authors thank the Medical Birth Registry of Norway and Statistics Norway for providing data and registry linkages for the study. Pernille Frese assisted in the layout of the figures.
References

Comments