


Abstract
Risk for COVID-19 hospitalizations increases with increasing age and presence of underlying medical conditions. However, the burden has not been well-assessed in metropolitan and nonmetropolitan areas by race/ethnicity among Medicare population with chronic conditions.
We used the 2020 Medicare data to estimate COVID-19 hospitalization rates by race/ethnicity among Medicare beneficiaries for COVID-19 by metropolitan status and to assess the association of hospitalizations from COVID-19 with each of selected 29 chronic conditions for patients by metropolitan status and by race/ethnicity.
The COVID-19 hospitalization rate was higher among beneficiaries residing in nonmetropolitan counties than those residing in metropolitan counties in 2020. Approximately 1 in 2 AI/AN, 1 in 3 NHB, Hispanic and A/PI, and 1 in 4 NHW beneficiaries with COVID-19 residing in nonmetropolitan counties were hospitalized. Beneficiaries with COVID-19 and chronic conditions were more likely to be hospitalized compared with those without chronic conditions.
Hospitalization rates among beneficiaries with COVID-19 and chronic conditions were not distributed equally by race/ethnicity and by metropolitan status. Researchers, policymakers and practitioners can use these findings to explore more effective ways of reducing racial/ethnic and geographic disparities among minorities disproportionately affected by COVID-19 and are at highest risk of hospitalization.
Introduction
SARS-CoV-2, the virus that causes coronavirus disease 2019 (COVID-19), and the resulting coronavirus disease 2019 (COVID-19) pandemic continues to be a major public health crisis in the USA. In the early pandemic, hospitalization rates for COVID-19 increased dramatically since March 2020 among US populations of all ages, with the highest being among older adults.1,2 Race/ethnicity, socioeconomic status, access to health care and occupation are risk markers affecting COVID-19–associated hospitalization and death.3 Risk for severe COVID-19–associated outcomes increase with increasing age and presence of underlying medical conditions.4,5 Approximately 90% of hospitalized persons have been reported to have ≥1 underlying medical condition.1 Serious complications from COVID-19 have been observed among persons aged ≥65 years, who account for 50% of hospital and intensive care unit admissions and 80% of deaths.5
Metropolitan areas have been the focus of COVID-19 illness and deaths.6 Initially, COVID-19 case prevalence was lower in nonmetropolitan than in metropolitan areas; however, COVID-19 has increased spread from metropolitan areas to nonmetropolitan areas.7,8 Increased COVID-19 hospitalization in nonmetropolitan areas can negatively affect those health care systems already lacking resources.
Racial/ethnic minority groups are at an increased risk for serious illness and death from COVID-19.9 Non-Hispanic Black (NHB), Hispanic and American Indian/Alaska Native (AI/AN) persons have had a disproportionately higher burden of COVID-19 hospitalization and mortality, compared with non-Hispanic White (NHW) persons;10 however, the burden has not been well-assessed in metropolitan and nonmetropolitan areas by race/ethnicity. Older populations in nonmetropolitan areas have higher proportions of underlying health conditions and other health challenges, compared with those in metropolitan areas.11 We estimated COVID-19 hospitalization rates by race/ethnicity among Medicare beneficiaries (MBs) with fee-for-service (FFS) claims for COVID-19 for those residing in metropolitan and nonmetropolitan counties from 1 January 1 to 31 December 2020. We also examined the association of hospitalization from COVID-19 and each of 29 chronic conditions among MBs with COVID-19 in metropolitan and nonmetropolitan counties. Finally, we assessed hospitalizations among MBs with each of 29 chronic conditions by race/ethnicity and by metropolitan status.
Methods
We used the 2020 preliminary monthly FFS Medicare claims-based data for 1 January–31 December 2020, available through the Centers for Medicare and Medicaid Services (CMS, https://www.cms.gov/) Virtual Research Data Center to calculate COVID-19–associated hospitalization rates among beneficiaries. We included any beneficiaries who had a claim for COVID-19 if they had a primary or secondary diagnosis International Classification of Diseases, Tenth Revision, Clinical Modification (ICD-10-CM)12 code B97.29 (other coronavirus as the cause of diseases classified elsewhere) during 1 January–31 March 2020; ICD-10-CM code U07.1 (2019 novel coronavirus, COVID-19, confirmed by laboratory testing) from 1 April 2020, onward for any health care setting.13 A hospitalized patient had a diagnosis of COVID-19 on an FFS claim for an inpatient hospital setting. We used data for all FFS beneficiaries rather than only those aged ≥65 years. Therefore, our findings were generalizable to all persons who were eligible for Medicare, including 15.3% of beneficiaries who had disabilities, end-stage renal disease (ESRD), or Amyotrophic Lateral Sclerosis (Lou Gehrig’s disease) and were aged ≤ 65 years.
Our dependent variable was a beneficiary with COVID-19 with or without a claim for hospitalization. Our independent variables were chronic conditions included in the 2019 (the most recent data available) Chronic Conditions Data Warehouse (CCW)14 as follows: acute myocardial infarction; atrial fibrillation; heart failure; hypertension; ischemic heart disease; stroke; peripheral vascular disease; chronic kidney disease; diabetes; hyperlipidemia; anemia; rheumatoid arthritis/osteoarthritis; Alzheimer disease; depression; obesity; chronic obstructive pulmonary disease (COPD); schizophrenia; lung cancer; liver disease; viral hepatitis; HIV/AIDS; asthma; osteoporosis; tobacco use; opioid use disorder; spina bifida and other congenital anomalies of the nervous system (hereafter spina bifida); and sickle cell disease. Additionally, we included ESRD and cardiovascular disease. ESRD was identified from the variable of Medicare entitlements. The category of cardiovascular disease included the diagnoses of acute myocardial infarction, atrial fibrillation, heart failure, hypertension, ischemic heart disease, stroke and peripheral vascular disease. These preexisting conditions were selected because of (i) high prevalence among beneficiaries or (ii) previous studies reporting that COVID-19 patients with these conditions were likely to be at higher risk for hospitalization than those without these conditions. We summarized the number of pre-existing conditions for each beneficiary with or without hospitalization as 0, 1–3, 4–5 or ≥6.
We estimated the frequencies of beneficiaries with COVID-19 with or without hospitalization by sex (male/female), race/ethnicity (NHW, NHB, Hispanic, Asian/Pacific Islander [A/PI], AI/AN or other/unknown), US census region of residence (Northeast, West, Midwest or South), residence of metropolitan or nonmetropolitan (metropolitan [large central metropolitan and large fringe metropolitan, medium metropolitan or small metropolitan] or nonmetropolitan [micropolitan and noncore]),15 Medicare entitlement (ESRD, disabled or aged) and dual eligibility.
We calculated two measures: (i) hospitalization rate per 100 beneficiaries with COVID-19 in metropolitan or nonmetropolitan counties and (ii) COVID-19 hospitalization rates per 100 000 beneficiaries enrolled at any time during the study period in metropolitan and nonmetropolitan counties. We analyzed the characteristics of FFS MBs with COVID-19 hospitalizations by metropolitan status. We analyzed 29 multivariable logistic regression models to examine associations between hospitalization and each selected chronic condition among MBs with COVID-19 by race/ethnicity in metropolitan and nonmetropolitan counties. We used a two-tailed chi-square test for significance at P < 0.05. All analyses were performed in the secured environment of the CMS Virtual Research Data Center through the CCW. The data used in this study were de-identified by the Centers for Medicare & Medicaid Services and were subject to a data-use agreement between Centers for Disease Control and Prevention (CDC) and the Centers for Medicare & Medicaid Services. As such, CDC deemed the study exempt from institutional review board review.
Results
In 2021, hospitalization rates for COVID-19 were 1180.5/100 000 and 1250.2/100 000 beneficiaries among beneficiaries residing in metropolitan and nonmetropolitan counties, respectively. Among those with COVID-19, 27.3% in metropolitan and 26.7% in nonmetropolitan counties were hospitalized (Table 1). The highest COVID-19 hospitalization rates were observed among AI/AN beneficiaries, followed by NHB, Hispanic, NHW and A/PI in both metropolitan and nonmetropolitan areas. The COVID-19 hospitalization rates were higher for beneficiaries residing in nonmetropolitan counties than in metropolitan counties in any racial and ethnic groups, except for A/PI. The COVID-19 hospitalization rates for AI/AN beneficiaries were ~2.4 times and 3.0 times higher than for NHW beneficiaries in metropolitan and nonmetropolitan counties, respectively. The rates for NHB beneficiaries were ~2 times higher than NHW beneficiaries in metropolitan and nonmetropolitan areas. Among beneficiaries with a COVID-19 diagnosis, ~1 in 2 AI/AN, 1 in 3 NHB, Hispanic and A/PI, and 1 in 4 NHW beneficiaries residing in nonmetropolitan counties were hospitalized for COVID-19 illness. The AI/AN beneficiaries with COVID-19 residing in nonmetropolitan counties had higher hospitalization rate than AI/AN beneficiaries with COVID-19 residing in metropolitan counties.
COVID-19-associated hospitalization rates per 100 000 MBs with FFS claims in metropolitan and nonmetropolitan areas, by race/ethnicity, USA, 1 January–31 December 2020
| Race/ethnicity | No. of MBs | No. of COVID-19 MBs | No. of Hospitalized COVID-19 MBs | COVID19-Hospitalization Rate/100 000 MBs | Hospitalized rate/100 COVID-19 MBs | Race/Ethnicity | No. of MBs | No. of COVID-19 MBs | No. of Hospitalized COVID-19 MBs | COVID-19 Hospitalization Rate/100 000 MBs | Hospitalized rate/100 COVID-19 MBs |
|---|---|---|---|---|---|---|---|---|---|---|---|
| Metropolitan | Nonmetropolitan | ||||||||||
| NHW | 23 769 184 | 976 213 | 240 544 | 1012.0 | 24.6 | NHW | 6 885 583 | 309 263 | 77 732 | 1128.9 | 25.1 |
| Non-Hispanic Black | 3 193 093 | 171 648 | 64 655 | 2024.8 | 37.7 | Non-Hispanic Black | 439 702 | 28 968 | 10 320 | 2347.0 | 35.6 |
| Hispanic | 2 327 401 | 139 686 | 46 333 | 1990.8 | 33.2 | Hispanic | 235 968 | 14 753 | 5087 | 2155.8 | 34.5 |
| Asian/Pacific Islander | 1 212 402 | 39 846 | 11 813 | 974.3 | 29.6 | Asian/Pacific Islander | 47 866 | 1216 | 360 | 752.1 | 29.6 |
| American Indian/Alaska Native | 101 791 | 6742 | 2506 | 2461.9 | 37.2 | American Indian/Alaska Native | 111 789 | 9190 | 3847 | 3441.3 | 41.9 |
| Other/unknown | 1 025 223 | 32 914 | 7533 | 734.8 | 22.9 | Other/unknown | 161 061 | 5092 | 1192 | 740.1 | 23.4 |
| Total | 31 629 094 | 1 367 049 | 373 384 | 1180.5 | 27.3 | Total | 7 881 969 | 368 482 | 98 538 | 1250.2 | 26.7 |
Abbreviation: COVID-19, coronavirus disease 2019.
Characteristics of hospitalized beneficiaries with COVID-19 residing in nonmetropolitan counties were significantly different (P < 0.05) from those residing in metropolitan areas (Supplemental Table 1). Beneficiaries hospitalized with COVID-19 were more likely to be aged ≥65 years (86.2 and 89.1%), to be male (50.6 and 51.1%), to be NHW (64.4 and 78.9%), to reside in the South (38.4 and 50.3%) and to have multiple chronic conditions (50.3 and 45.1% with ≥6 selected conditions) residing in metropolitan and nonmetropolitan counties, respectively. A higher percentage of NHB and Hispanic beneficiaries with COVID-19 lived in metropolitan counties (17.3% NHB and 12.4% Hispanic) compared with nonmetropolitan counties (10.5% NHB and 5.2% Hispanic) (Fig. 1). In contrast, a higher percentage of AI/AN beneficiaries with COVID-19 lived in nonmetropolitan counties (3.9%) compared with metropolitan counties (0.7%). Metropolitan residents hospitalized with COVID-19 were more likely to be enrolled in both Medicare and Medicaid (54.1%) versus nonmetropolitan residents who were more likely to be enrolled in Medicare only (53.7%).
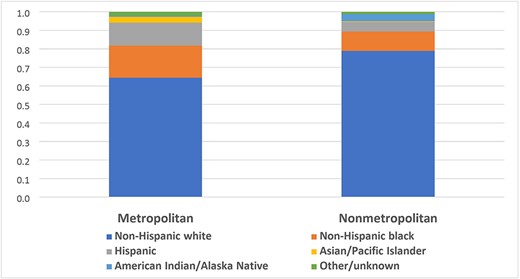
Percentagea of MBs hospitalized for COVID-19 illness, by race/ethnicity, by metropolitan status, USA, 1 January–31 December 2020. aSignificantly different between beneficiaries residing in metropolitan and nonmetropolitan for chi-square test at P < 0.05.
Prevalence rates of chronic conditions were significantly different (P < 0.05) among hospitalized MBs with COVID-19 residing in nonmetropolitan counties compared with metropolitan counties (Table 2). The five most common chronic conditions among beneficiaries hospitalized for COVID-19 residing in nonmetropolitan counties were cardiovascular disease, hypertension, hyperlipidemia, diabetes and rheumatoid arthritis/osteoarthritis. In metropolitan counties, the five most common chronic conditions were cardiovascular disease, hypertension, hyperlipidemia, chronic kidney disease and diabetes. There was less than 8% difference in prevalence of all these conditions between metropolitan and nonmetropolitan areas.
Prevalence of chronic conditions among Medicare beneficiaries with FFS claims hospitalized for coronavirus disease 2019 (COVID-19) residing in metropolitan and nonmetropolitan areas, USA, 1 January–31 December 2020
| Conditionsa | Total | Metropolitan | Nonmetropolitan | Absolute difference (%) |
|---|---|---|---|---|
| 100% (n = 462 175) | 100% (n = 365 668) | 100% (n = 96 507) | ||
| Cardiovascular diseaseb,c | 80.7 | 80.7 | 80.7 | 0.1 |
| Hypertensionc | 73.7 | 73.7 | 73.5 | 0.2 |
| Hyperlipidemia | 57.4 | 58.0 | 55.1 | 3.0 |
| Diabetes | 45.2 | 45.5 | 44.1 | 1.4 |
| Chronic kidney disease | 45.9 | 46.6 | 43.1 | 3.5 |
| Anemia | 39.6 | 41.3 | 33.3 | 8.0 |
| Ischemic heart disease | 42.3 | 42.4 | 42.0 | 0.5 |
| Rheumatoid arthritis/osteoarthritis | 42.9 | 42.6 | 44.0 | 1.4 |
| Peripheral vascular disease | 27.5 | 28.9 | 22.0 | 7.0 |
| Depression | 29.5 | 30.3 | 26.4 | 3.9 |
| Heart failure | 30.1 | 30.2 | 29.6 | 0.7 |
| Obesityc | 29.1 | 29.1 | 29.3 | 0.2 |
| Chronic obstructive pulmonary disease | 21.1 | 20.7 | 22.7 | 2.0 |
| Alzheimer disease/dementia | 10.4 | 11.1 | 7.9 | 3.3 |
| Atrial fibrillation | 13.2 | 13.3 | 12.9 | 0.4 |
| Tobacco | 9.2 | 9.1 | 9.5 | 0.4 |
| Stroke | 7.8 | 8.2 | 6.4 | 1.8 |
| Osteoporosis | 8.0 | 8.3 | 6.9 | 1.4 |
| Asthma | 7.6 | 7.9 | 6.3 | 1.5 |
| ESRD | 6.6 | 7.0 | 4.9 | 2.1 |
| Schizophrenia | 4.5 | 4.9 | 2.7 | 2.2 |
| Liver disease | 7.1 | 7.4 | 5.9 | 1.5 |
| Opioid use disorder | 3.3 | 3.4 | 3.0 | 0.4 |
| Hepatitis | 1.9 | 1.3 | 1.0 | 0.3 |
| Acute myocardial infarctionc | 1.7 | 1.7 | 1.6 | 0.0 |
| Lung cancer | 1.3 | 1.3 | 1.2 | 0.2 |
| HIV/AIDS | 0.5 | 0.6 | 0.2 | 0.4 |
| Spina bifida and other congenital anomalies of the nervous system | 0.3 | 0.3 | 0.2 | 0.1 |
| Sickle cell disease | 0.1 | 0.1 | 0.1 | 0.1 |
aChronic condition prevalence among hospitalized Medicare beneficiaries with COVID-19 residing in nonmetropolitan counties was significantly different from hospitalized beneficiaries with COVID-19 residing in metropolitan counties by chi-square test at P < 0.05, except for cardiovascular disease, hypertension, obesity and acute myocardial infarction.
bIncludes acute myocardial infarction, atrial fibrillation, heart failure, hypertension, ischemic heart disease, stroke/transient ischemic attack and peripheral vascular disease.
cNot significantly different in chronic condition prevalence among hospitalized Medicare beneficiaries with COVID-19 residing in nonmetropolitan counties versus in metropolitan counties by chi-square test at P < 0.05.
All selected chronic conditions were significantly associated with hospitalization among beneficiaries with COVID-19 in both metropolitan and nonmetropolitan areas after controlling for age, sex and race/ethnicity, except for Alzheimer disease/dementia in metropolitan areas (Supplemental Table 2). The five conditions with the highest odds for hospitalization among beneficiaries with COVID-19 residing in nonmetropolitan counties were ESRD [Adjusted odds ratios—aOR: 2.53, 95% confidence interval (CI): 2.43, 2.64], sickle cell disease (aOR: 2.35, 95% CI: 1.58, 3.49), chronic kidney disease (aOR: 1.68, 95% CI: 1.65, 1.70), lung cancer (aOR: 1.61, 95% CI: 1.49, 1.74) and COPD (aOR: 1.59, 95% CI: 1.56, 1.62). Similarly, the five conditions with the highest odds for hospitalization in metropolitan counties were ESRD (aOR: 2.52, 95% CI: 2.48, 2.57), sickle cell disease (aOR: 2.14, 95% CI: 1.89, 2.41), chronic kidney disease (aOR: 1.70, 95% CI: 1.68, 1.71), acute myocardial infarction (aOR: 1.65, 95% CI: 1.60, 1.71) and heart failure (aOR; 1.58, 95% CI: 1.57, 1.60). Among all Medicare populations, beneficiaries with COVID-19 had a slightly higher odds of hospitalization for the majority of selected chronic conditions in nonmetropolitan counties than beneficiaries with the same conditions in metropolitan counties.
Beneficiaries with COVID-19 in any racial and ethnic groups having any of the selected conditions, ESRD, chronic kidney disease, COPD, acute myocardial infarction and heart failure were more likely to be hospitalized (aORs: 1.24–2.79) compared with those without the conditions in both metropolitan and nonmetropolitan areas (Table 3). In general, NHW beneficiaries with COVID-19 residing in metropolitan counties with most of the selected chronic conditions had slightly higher odds of hospitalization compared with NHW beneficiaries with COVID-19 residing in nonmetropolitan counties with the same conditions. In contrast, NHB beneficiaries with COVID-19 in nonmetropolitan counties with most of the selected chronic conditions had slightly higher odds of hospitalization than NHB beneficiaries residing in metropolitan counties with the same conditions. Racial and ethnic disparities in hospitalization for COVID-19 were observed among beneficiaries with selected conditions in metropolitan and nonmetropolitan areas. NHB beneficiaries with COVID-19 and sickle cell disease were at increased risk for hospitalization in both metropolitan (aOR: 1.93, 95% CI: 1.69, 2.20) and nonmetropolitan counties (aOR: 2.00, 95% CI: 1.28, 3.11), compared with NHB beneficiaries with COVID-19 but without sickle cell disease. Similarly, Hispanic nonmetropolitan beneficiaries with COVID-19 and liver disease had the highest odds (aOR: 1.47, 95% CI: 1.29, 1.69) for hospitalization among all racial/ethnic groups (aORs: 1.20–1.38) than Hispanic beneficiaries with COVID-19 but without the condition in both metropolitan and nonmetropolitan areas.
| Metropolitan counties | Nonmetropolitan counties | |||||
|---|---|---|---|---|---|---|
| Condition | NHW | Non-Hispanic Black | Hispanic | NHW | Non-Hispanic Black | Hispanic |
| aOR (95% CI) | aOR (95% CI) | aOR (95% CI) | aOR (95% CI) | aOR (95% CI) | aOR (95% CI) | |
| ESRD | 2.79 (2.70, 2.88)d | 2.16 (2.09, 2.22)d | 2.66 (2.56, 2.76)d | 2.66 (2.51, 2.83)d | 2.37 (2.19, 2.56)d | 2.47 (2.18, 2.80)d |
| Chronic kidney disease | 1.70 (1.68, 1.71)d | 1.69 (1.66, 1.73)d | 1.67 (1.63, 1.71)d | 1.67 (1.64, 1.69)d | 1.80 (1.71, 1.89)d | 1.69 (1.57, 1.81)d |
| Chronic obstructive pulmonary disease | 1.68 (1.66, 1.70)d | 1.25 (1.22, 1.29)d | 1.24 (1.20, 1.29)d | 1.65 (1.62, 1.68)d | 1.32 (1.24, 1.42)d | 1.38 (1.24, 1.54)d |
| Acute myocardial infarction | 1.63 (1.57, 1.70)d | 1.58 (1.45, 1.71)d | 1.84 (1.66, 2.03)d | 1.42 (1.32, 1.52)d | 1.84 (1.48, 2.30)d | 1.53 (1.14, 2.05)d |
| Heart failure | 1.61 (1.59, 1.62)d | 1.49 (1.46, 1.52)d | 1.55 (1.51, 1.59)d | 1.59 (1.56, 1.63)d | 1.63 (1.54, 1.72)d | 1.50 (1.38, 1.63)d |
| Lung cancer | 1.57 (1.51, 1.63)d | 1.22 (1.10, 1.35)d | 1.18 (1.01, 1.38)d | 1.65 (1.53, 1.79)d | 1.47 (1.09, 1.98)d | 0.90 (0.49, 1.66) |
| Sickle cell disease | 1.56 (0.97, 2.50) | 1.93 (1.69, 2.20)d | 2.17 (1.30, 3.64)d | NR | 2.00 (1.28, 3.11)d | NR |
| Obesity | 1.52 (1.50, 1.54)d | 1.35 (1.32, 1.38)d | 1.22 (1.19, 1.26)d | 1.518 (1.49, 1.55)d | 1.39 (1.32, 1.47)d | 1.33 (1.23, 1.44)d |
| Diabetes | 1.51 (1.50, 1.52)d | 1.40 (1.37, 1.42)d | 1.42 (1.39, 1.45)d | 1.523 (1.50, 1.55)d | 1.51 (1.44, 1.58)d | 1.42 (1.32, 1.52)d |
| Opioid use disorder | 1.45 (1.41, 1.49)d | 1.18 (1.12, 1.24)d | 1.13 (1.05, 1.21)d | 1.410 (1.34, 1.48)d | 1.52 (1.32, 1.75)d | 1.05 (0.83, 1.33) |
| Cardiovascular diseasec | 1.44 (1.43, 1.46)d | 1.26 (1.22, 1.29)d | 1.20 (1.17, 1.23)d | 1.431 (1.40, 1.46)d | 1.36 (1.27, 1.46)d | 1.18 (1.09, 1.28)d |
| Spina bifida and other congenital anomalies of the nervous system | 1.43 (1.30, 1.56)d | 1.14 (0.94, 1.38) | 0.98 (0.77, 1.25) | 1.35 (1.13, 1.62)d | 0.80 (0.46, 1.37) | 1.90 (0.90, 4.02) |
| Hypertension | 1.39 (1.37, 1.40)d | 1.26 (1.23, 1.29)d | 1.22 (1.19, 1.25)d | 1.35 (1.33, 1.38)d | 1.33 (1.24, 1.41)d | 1.19 (1.10, 1.28)d |
| Ischemic heart disease | 1.38 (1.37, 1.39)d | 1.31 (1.28, 1.34)d | 1.30 (1.27, 1.33)d | 1.42 (1.40, 1.45)d | 1.41 (1.34, 1.49)d | 1.30 (1.21, 1.40)d |
| Schizophrenia | 1.38 (1.35, 1.41)d | 0.83 (0.80, 0.86)d | 1.01 (0.95, 1.06) | 0.99 (0.94, 1.04) | 0.77 (0.70, 0.85)d | 0.61 (0.48, 0.78)d |
| Hepatitis | 1.31 (1.25, 1.37)d | 1.07 (1.02, 1.13)d | 1.14 (1.06, 1.23)d | 1.26 (1.15, 1.39)d | 1.15 (.96, 1.38) | 1.28 (0.95, 1.72) |
| Liver disease | 1.30 (1.27, 1.32)d | 1.20 (1.16, 1.25)d | 1.22 (1.17, 1.26)d | 1.38 (1.33, 1.43)d | 1.31 (1.17, 1.46)d | 1.47 (1.29, 1.69)d |
| Asthma | 1.30 (1.27, 1.32)d | 1.14 (1.11, 1.19)d | 1.06 (1.01, 1.10)d | 1.35 (1.30, 1.40)d | 1.23 (1.12, 1.36)d | 1.26 (1.08, 1.47)d |
| Anemia | 1.29 (1.28, 1.31)d | 1.30 (1.27, 1.33)d | 1.40 (1.36, 1.43)d | 1.31 (1.28, 1.33)d | 1.43 (1.36, 1.50)d | 1.44 (1.33, 1.55)d |
| Peripheral vascular disease | 1.29 (1.28, 1.31)d | 1.16 (1.13, 1.18)d | 1.28 (1.25, 1.31)d | 1.20 (1.18, 1.23)d | 1.20 (1.13, 1.27)d | 1.17 (1.07, 1.28)d |
| Atrial fibrillation | 1.28 (1.26, 1.30)d | 1.25 (1.20, 1.30)d | 1.15 (1.10, 1.20)d | 1.25 (1.22, 1.28)d | 1.26 (1.14, 1.40)d | 1.06 (0.91, 1.24) |
| Tobacco | 1.26 (1.23, 1.28)d | 0.91 (0.88, 0.93)d | 0.96 (0.92, 1.00) | 1.15 (1.12, 1.19)d | 1.02 (0.95, 1.10) | .90 (0.79, 1.03) |
| Stroke | 1.21 (1.18, 1.23)d | 1.09 (1.05, 1.12)d | 1.17 (1.11, 1.22)d | 1.10 (1.06, 1.13)d | 1.03 (0.95, 1.12) | 1.09 (0.93, 1.26) |
| Hyperlipidemia | 1.20 (1.18, 1.21)d | 1.20 (1.17, 1.22)d | 1.07 (1.05, 1.10)d | 1.22 (1.20, 1.24)d | 1.20 (1.15, 1.27)d | 1.13 (1.06, 1.22)d |
| Depression | 1.18 (1.17, 1.20)d | 0.94 (0.92, 0.96)d | 1.04 (1.02, 1.07)d | 1.09 (1.07, 1.11)d | 0.90 (0.84, 0.95)d | 0.94 (0.87, 1.02) |
| Rheumatoid arthritis/osteoarthritis | 1.10 (1.09, 1.11)d | 1.03 (1.00, 1.05)d | 0.95 (0.93, 0.97)d | 1.14 (1.12, 1.16)d | 1.09 (1.04, 1.15)d | 1.00 (.93, 1.08) |
| Osteoporosis | 1.07 (1.05, 1.09)d | 1.00 (0.96, 1.06) | 0.99 (0.95, 1.04) | 1.07 (1.03, 1.10)d | 0.99 (0.87, 1.14) | 0.98 (0.85, 1.13) |
| Alzheimer disease/dementia | 0.99 (0.98, 1.01) | 0.89 (0.86, 0.93)d | 1.14 (1.10, 1.19)d | 0.76 (0.74, 0.79)d | 0.77 (0.71, 0.84)d | 0.81 (0.70, 0.92)d |
| HIV/AIDS | 0.83 (0.74, 0.91)d | 0.99 (0.92, 1.06) | 0.90 (0.79, 1.02) | 1.06 (0.78, 1.43) | 1.32 (1.00, 1.74) | 1.00 (0.45, 2.24) |
Abbreviation: NR, not reliable.
aAdjusted for age and sex.
bAsian/Pacific Islander and American Indian/Alaska Native excluded because of insufficient sample sizes.
cIncludes acute myocardial infarction, atrial fibrillation, heart failure, hypertension, ischemic heart disease, stroke/transient ischemic attack and peripheral vascular disease.
dSignificant for chi-square test at P < 0.05.
| Metropolitan counties | Nonmetropolitan counties | |||||
|---|---|---|---|---|---|---|
| Condition | NHW | Non-Hispanic Black | Hispanic | NHW | Non-Hispanic Black | Hispanic |
| aOR (95% CI) | aOR (95% CI) | aOR (95% CI) | aOR (95% CI) | aOR (95% CI) | aOR (95% CI) | |
| ESRD | 2.79 (2.70, 2.88)d | 2.16 (2.09, 2.22)d | 2.66 (2.56, 2.76)d | 2.66 (2.51, 2.83)d | 2.37 (2.19, 2.56)d | 2.47 (2.18, 2.80)d |
| Chronic kidney disease | 1.70 (1.68, 1.71)d | 1.69 (1.66, 1.73)d | 1.67 (1.63, 1.71)d | 1.67 (1.64, 1.69)d | 1.80 (1.71, 1.89)d | 1.69 (1.57, 1.81)d |
| Chronic obstructive pulmonary disease | 1.68 (1.66, 1.70)d | 1.25 (1.22, 1.29)d | 1.24 (1.20, 1.29)d | 1.65 (1.62, 1.68)d | 1.32 (1.24, 1.42)d | 1.38 (1.24, 1.54)d |
| Acute myocardial infarction | 1.63 (1.57, 1.70)d | 1.58 (1.45, 1.71)d | 1.84 (1.66, 2.03)d | 1.42 (1.32, 1.52)d | 1.84 (1.48, 2.30)d | 1.53 (1.14, 2.05)d |
| Heart failure | 1.61 (1.59, 1.62)d | 1.49 (1.46, 1.52)d | 1.55 (1.51, 1.59)d | 1.59 (1.56, 1.63)d | 1.63 (1.54, 1.72)d | 1.50 (1.38, 1.63)d |
| Lung cancer | 1.57 (1.51, 1.63)d | 1.22 (1.10, 1.35)d | 1.18 (1.01, 1.38)d | 1.65 (1.53, 1.79)d | 1.47 (1.09, 1.98)d | 0.90 (0.49, 1.66) |
| Sickle cell disease | 1.56 (0.97, 2.50) | 1.93 (1.69, 2.20)d | 2.17 (1.30, 3.64)d | NR | 2.00 (1.28, 3.11)d | NR |
| Obesity | 1.52 (1.50, 1.54)d | 1.35 (1.32, 1.38)d | 1.22 (1.19, 1.26)d | 1.518 (1.49, 1.55)d | 1.39 (1.32, 1.47)d | 1.33 (1.23, 1.44)d |
| Diabetes | 1.51 (1.50, 1.52)d | 1.40 (1.37, 1.42)d | 1.42 (1.39, 1.45)d | 1.523 (1.50, 1.55)d | 1.51 (1.44, 1.58)d | 1.42 (1.32, 1.52)d |
| Opioid use disorder | 1.45 (1.41, 1.49)d | 1.18 (1.12, 1.24)d | 1.13 (1.05, 1.21)d | 1.410 (1.34, 1.48)d | 1.52 (1.32, 1.75)d | 1.05 (0.83, 1.33) |
| Cardiovascular diseasec | 1.44 (1.43, 1.46)d | 1.26 (1.22, 1.29)d | 1.20 (1.17, 1.23)d | 1.431 (1.40, 1.46)d | 1.36 (1.27, 1.46)d | 1.18 (1.09, 1.28)d |
| Spina bifida and other congenital anomalies of the nervous system | 1.43 (1.30, 1.56)d | 1.14 (0.94, 1.38) | 0.98 (0.77, 1.25) | 1.35 (1.13, 1.62)d | 0.80 (0.46, 1.37) | 1.90 (0.90, 4.02) |
| Hypertension | 1.39 (1.37, 1.40)d | 1.26 (1.23, 1.29)d | 1.22 (1.19, 1.25)d | 1.35 (1.33, 1.38)d | 1.33 (1.24, 1.41)d | 1.19 (1.10, 1.28)d |
| Ischemic heart disease | 1.38 (1.37, 1.39)d | 1.31 (1.28, 1.34)d | 1.30 (1.27, 1.33)d | 1.42 (1.40, 1.45)d | 1.41 (1.34, 1.49)d | 1.30 (1.21, 1.40)d |
| Schizophrenia | 1.38 (1.35, 1.41)d | 0.83 (0.80, 0.86)d | 1.01 (0.95, 1.06) | 0.99 (0.94, 1.04) | 0.77 (0.70, 0.85)d | 0.61 (0.48, 0.78)d |
| Hepatitis | 1.31 (1.25, 1.37)d | 1.07 (1.02, 1.13)d | 1.14 (1.06, 1.23)d | 1.26 (1.15, 1.39)d | 1.15 (.96, 1.38) | 1.28 (0.95, 1.72) |
| Liver disease | 1.30 (1.27, 1.32)d | 1.20 (1.16, 1.25)d | 1.22 (1.17, 1.26)d | 1.38 (1.33, 1.43)d | 1.31 (1.17, 1.46)d | 1.47 (1.29, 1.69)d |
| Asthma | 1.30 (1.27, 1.32)d | 1.14 (1.11, 1.19)d | 1.06 (1.01, 1.10)d | 1.35 (1.30, 1.40)d | 1.23 (1.12, 1.36)d | 1.26 (1.08, 1.47)d |
| Anemia | 1.29 (1.28, 1.31)d | 1.30 (1.27, 1.33)d | 1.40 (1.36, 1.43)d | 1.31 (1.28, 1.33)d | 1.43 (1.36, 1.50)d | 1.44 (1.33, 1.55)d |
| Peripheral vascular disease | 1.29 (1.28, 1.31)d | 1.16 (1.13, 1.18)d | 1.28 (1.25, 1.31)d | 1.20 (1.18, 1.23)d | 1.20 (1.13, 1.27)d | 1.17 (1.07, 1.28)d |
| Atrial fibrillation | 1.28 (1.26, 1.30)d | 1.25 (1.20, 1.30)d | 1.15 (1.10, 1.20)d | 1.25 (1.22, 1.28)d | 1.26 (1.14, 1.40)d | 1.06 (0.91, 1.24) |
| Tobacco | 1.26 (1.23, 1.28)d | 0.91 (0.88, 0.93)d | 0.96 (0.92, 1.00) | 1.15 (1.12, 1.19)d | 1.02 (0.95, 1.10) | .90 (0.79, 1.03) |
| Stroke | 1.21 (1.18, 1.23)d | 1.09 (1.05, 1.12)d | 1.17 (1.11, 1.22)d | 1.10 (1.06, 1.13)d | 1.03 (0.95, 1.12) | 1.09 (0.93, 1.26) |
| Hyperlipidemia | 1.20 (1.18, 1.21)d | 1.20 (1.17, 1.22)d | 1.07 (1.05, 1.10)d | 1.22 (1.20, 1.24)d | 1.20 (1.15, 1.27)d | 1.13 (1.06, 1.22)d |
| Depression | 1.18 (1.17, 1.20)d | 0.94 (0.92, 0.96)d | 1.04 (1.02, 1.07)d | 1.09 (1.07, 1.11)d | 0.90 (0.84, 0.95)d | 0.94 (0.87, 1.02) |
| Rheumatoid arthritis/osteoarthritis | 1.10 (1.09, 1.11)d | 1.03 (1.00, 1.05)d | 0.95 (0.93, 0.97)d | 1.14 (1.12, 1.16)d | 1.09 (1.04, 1.15)d | 1.00 (.93, 1.08) |
| Osteoporosis | 1.07 (1.05, 1.09)d | 1.00 (0.96, 1.06) | 0.99 (0.95, 1.04) | 1.07 (1.03, 1.10)d | 0.99 (0.87, 1.14) | 0.98 (0.85, 1.13) |
| Alzheimer disease/dementia | 0.99 (0.98, 1.01) | 0.89 (0.86, 0.93)d | 1.14 (1.10, 1.19)d | 0.76 (0.74, 0.79)d | 0.77 (0.71, 0.84)d | 0.81 (0.70, 0.92)d |
| HIV/AIDS | 0.83 (0.74, 0.91)d | 0.99 (0.92, 1.06) | 0.90 (0.79, 1.02) | 1.06 (0.78, 1.43) | 1.32 (1.00, 1.74) | 1.00 (0.45, 2.24) |
Abbreviation: NR, not reliable.
aAdjusted for age and sex.
bAsian/Pacific Islander and American Indian/Alaska Native excluded because of insufficient sample sizes.
cIncludes acute myocardial infarction, atrial fibrillation, heart failure, hypertension, ischemic heart disease, stroke/transient ischemic attack and peripheral vascular disease.
dSignificant for chi-square test at P < 0.05.
Discussion
Main findings of the study
Our findings indicate that COVID-19 hospitalization rates among enrolled MBs with COVID-19 varied by metropolitan status, by selected chronic conditions and by race/ethnicity. NHB and AI/AN beneficiaries with COVID-19 had substantially higher hospitalization rates than NHW beneficiaries with COVID-19 in both metropolitan and nonmetropolitan counties. AI/AN beneficiaries with COVID-19 had the highest risk for COVID-19-associated hospitalizations than beneficiaries in any other racial and ethnic groups. AI/AN beneficiaries residing in nonmetropolitan counties were more likely to require inpatient medical services than AI/AN residing in metropolitan counties after becoming infected.
Our results also confirm that COVID-19 patients with one of the selected chronic condition were at increased risk to be hospitalized for COVID-19–associated outcomes than those without the conditions. The associations between COVID-19 hospitalization and chronic conditions varied by racial/ethnic group and by metropolitan status. Substantial variations existed in the likelihood of hospitalization among beneficiaries with COVID-19 by demographic attributes in metropolitan and nonmetropolitan areas.
What is already known on this topic
Increased risk for COVID-19–associated hospitalizations among beneficiaries with selected chronic conditions residing in metropolitan versus in nonmetropolitan areas might be attributable to multiple factors. Prior studies showed that nonmetropolitan populations face higher risk for serious COVID-19 outcomes than metropolitan populations, perhaps because of major vulnerabilities (e.g. unavailability of tests for COVID-19, laboratory delays, fewer physicians, lack of mental health services, higher disability rates, higher poverty, lack of insurance, lack of health care facilities for early diagnosis, lack of social services and lack of access to transportation).16–20
What this study adds
Our results indicate that the hospitalization rates among NHB and Hispanic beneficiaries were double the rates among NHW beneficiaries in metropolitan and nonmetropolitan areas. Moreover, COVID-19 NHB nonmetropolitan patients with any of the selected chronic conditions generally had slightly higher odds of hospitalization than NHB metropolitan patients with the same conditions. This may be due to the Black rural population having been less prepared for the pandemic compared with the Black urban population because of state-level policies (e.g. social distancing), sociodemographic contextual factors (e.g. poverty, broadband access to telehealth visits) and comorbidities and co-exposures (e.g. higher prevalence for diabetes and smoking, and work-related exposures).18–20 Furthermore, the historically rooted structural racism that Black population may face when seeking care in nonmetropolitan areas may have been and may remain a fundamental cause of racial/ethnic inequalities in COVID-19 burden.21,22 Racism, both interpersonal and structural, may negatively affect the mental and physical health of millions of people, preventing them from attaining their highest level of health, and consequently, affecting the health of our nation.23 Racial and ethnic minority groups experience higher rates of morbidity and mortality across a wide range of health conditions, and the life expectancy of non-Hispanic Black Americans is 4 years lower than that of White Americans.24
Hispanics also face a variety of barriers to receiving health care services of high quality. A survey reported that more than one in four Latinos (27%) lacks a regular health care provider, and one in two Latinos will develop diabetes over their lifetime.25 Hispanic workers residing in metropolitan areas are disproportionately concentrated in certain industries more deeply affected by the economic recession because of the COVID-19 pandemic (e.g. restaurants, hotels and construction).26 Hispanic farmworkers and laborers (e.g. manufacturing and meat-processing facilities) in nonmetropolitan areas are experiencing worst pandemic effects because of inability to maintain social distance or acquire personal protective equipment.27
Our results indicate that ~1 in 2 AI/AN versus 1 in 4 NHW beneficiaries with COVID-19 residing in nonmetropolitan counties were hospitalized for COVID-19 illness. The majority of AI/ANs reside in rural areas on tribal lands, thus facing greater challenges regarding COVID-19 testing, including test kit and material shortages, care delays, delays in pandemic-response funding and lack of personal protective equipment.28 AI/AN tribal members typically have higher percentages of poverty, unemployment and crowded housing, and lower socioeconomic status and insurance coverage.29,30 AI/AN populations have disproportionately higher prevalence and mortality rates for certain chronic conditions, including obesity, diabetes and cardiovascular disease than the general population.31 Thus, rural AI/AN populations have higher social vulnerability and are more affected by the COVID-19 pandemic than other racial/ethnic groups. Racial and ethnic minority populations had disproportionate impact and health inequalities were evidenced and widen during the COVID-19 pandemic.32
Although the prevalence of most of the selected chronic conditions were found higher in metropolitan residents than in nonmetropolitan residents in this study, our results indicate that the prevalence of rheumatoid arthritis/osteoarthritis, obesity, COPD and tobacco were higher in nonmetropolitan than metropolitan areas. Prior studies reported that rural communities often have worse health outcomes, have less access to care and are less diverse than urban communities33 (e.g. high-dose opioid prescriptions,34 obesity35 and tobacco use36). These factors increase the risk for poor COVID-19 outcomes in rural areas and disproportionately affect racial/ethnic minorities.
COVID-19 has spread rapidly from metropolitan to nonmetropolitan areas.7,37 The CDC reported that COVID-19 incidence was highest among residents of large central and large fringe metropolitan areas in the early pandemic and increased spread into rural communities and then to all urban–rural areas.38 US geographic areas most affected by the pandemic have changed temporally, leading to variation in COVID-19 incidence by urbanicity and region.39 Impacts of the COVID-19 pandemic on rural or nonmetropolitan residents have been severe. Other important factors attribute to the differences in COVID-19–associated hospitalizations between metropolitan and nonmetropolitan areas include differences in health systems and hospital resources,16 perception of COVID-19 risk,40 adoption of preventive behaviors7 and policies in mitigation restrictions.41
Limitations
Our results are based on data regarding beneficiaries who had FFS claims for COVID-19–associated hospitalization. Beneficiaries who were asymptomatic or did not have a claim for COVID-19 care were excluded. Our estimates did not include beneficiaries who enrolled in the Medicare managed care because data were unavailable for analysis. Distribution of Medicare populations42 is different from the US general population; therefore, our estimates might not be directly comparable with studies using surveillance system data. COVID-19 effects are likely underestimated because of delays in Medicare data collection and reporting and might be less reliable for certain racial/ethnic groups in nonmetropolitan counties because of limited statistical power for small sample sizes. Misclassification of MBs’ race/ethnicity in administrative data may influence our estimates in racial/ethnic disparities in hospitalization for COVID-19.43 Lastly, Data on other factors contributing to health care usage, racial/ethnic disparities, possible associated conditions for illness or mitigation measures were not available in Medicare and were not considered.
Conclusions
These findings confirm that COVID-19–associated hospitalizations among beneficiaries with COVID-19 varied by metropolitan status, by selected chronic conditions and by race/ethnicity. The COVID-19 hospitalization rates were higher for beneficiaries residing in nonmetropolitan counties than in metropolitan counties in any racial and ethnic groups, except for A/PI. AI/AN and NHB beneficiaries with COVID-19 in nonmetropolitan counties have higher hospitalization rates than other race/ethnicities. Substantial variations existed in the likelihood of hospitalization among beneficiaries with COVID-19 by demographic attributes in metropolitan and nonmetropolitan areas. These findings highlight the importance of increasing test availability, social services, vaccination and improved access to health care for nonmetropolitan populations at highest risk for being hospitalized with COVID-19. Researchers, policymakers and practitioners can use these findings to explore more effective ways of reducing racial/ethnic and geographic disparities among minorities disproportionately affected by COVID-19 and are at highest risk of hospitalization.
Disclaimer
The findings and conclusions in this report are those of the authors and do not necessarily represent the official position of the Centers for Disease Control and Prevention.
Acknowledgements
The authors thank the CMS staff for their data support and disclosure view, staff in the Chronic Conditions Warehouse Help Desk for software and technical support and staff in the Centers for Disease Control and Prevention’s Center for Surveillance, Epidemiology, and Laboratory Services for their administrative support. We extend special thanks to C. Kay Smith, MEd, former CDC staff, for editorial support. Federal officials not involved in the study approved the ethical conduct of the analysis and reporting of de-identified Medicare data that did not involve human research.
Conflict of interest
The authors declare no conflicts of interest.
Man-Huei Chang, Epidemiologist
Ramal Moonesinghe, Statistician
Benedict I. Truman, Associate Director for Science, National Center for HIV/AIDS, Viral Hepatitis, STD, and TB Prevention
References
Roberts ME, Doogan NJ, Stanton CA, et al. . Rural versus urban use of traditional and emerging tobacco products in the United States, 2013-2014.
