


Aims: To identify the characteristics of current drinker and risky alcohol-drinking pattern by profiles in Malaysia. Methods: We analyzed data from the National Health and Morbidity Survey 2011. It was a cross-sectional population-based with two stages stratified random sampling design. A validated Alcohol Use Disorder Identification Test Malay questionnaire was used to assess the alcohol consumption and its alcohol related harms. Analysis of complex survey data using Stata Version 12 was done for descriptive analysis on alcohol use and risky drinking by socio-demography profiles. Logistic regression analysis was used to measure the association of risky drinking status with the socio-demography characteristics. Results: The prevalence of current alcohol use was 11.6% [95% confidence interval (CI): 10.5, 12.7], among them 23.6% (95% CI: 21.0, 26.4) practiced risky drinking. The onset for alcohol drinking was 21 years old (standard deviation 7.44) and majority preferred Beer. Males significantly consumed more alcohol and practiced risky drinking. Current alcohol use was more prevalent among urbanites, Chinese, those with high household income, and high education. Conversely, risky drinking was more prevalent among rural drinkers, Bumiputera Sabah and Sarawak, low education and low household income. The estimated odds of risky drinking increased by a factor of 3.5 among Males while a factor of 2.7 among Bumiputera Sabah and Sarawak. Education status and household income was not a significant predictor to risky drinking. Conclusion: There was an inverse drinking pattern between current drinker and risky drinking by the socio-demography profiles. Initiating early screening and focused intervention might avert further alcohol related harms and dependence among the risky drinkers.
INTRODUCTION
In 2011, the World Health Organization estimated that there were ∼2 billion people worldwide consuming alcohol beverages and 76.3 million had an alcohol use disorder (WHO, 2011). Alcohol problems exist on a continuum of severity ranging from social drinker to alcohol dependence. The detrimental effects of alcohol use to health may not associated only with the total volume of consumption or drinking frequency—in fact irregular heavy drinking has been proven to cause harm to the drinker (Rehm et al., 2003; Room et al., 2005).
Consuming higher volume of alcohol may increase the risk of non-communicable diseases such as cancer, coronary heart disease and intentional injury (Room et al., 2005). Alcohol also causes harm to developing fetus, psychiatric morbidity; including depression, anxiety and suicides (WHO, 2011; Petrakis et al., 2002). Though the per capita consumption of alcohol varies widely around the world, the burden of disease and death remains significant in most countries (Hagmann, 2001).
In Malaysia, alcohol-drinking estimates of 5-year change in recorded adult aged 15 years and above per capita consumption have been classified as stable (WHO, 2011) and Malaysia was classified under low consumption with high percentages of past year abstainers. Strikingly, recent study reported one in two of current drinkers in Malaysia engaged with harmful drinking pattern like binge drinking habit that is alarming (Mutalip et al., 2013). Perhaps the most worrisome is the factors of access, price and availability of alcohol in the market that potentially affect risky drinking pattern as the cheapest bottle of high alcoholic content like Samsu (local alcoholic beverage) costs as little as RM 1.50, equivalent to US 0.36 per bottle and easily available at local convenient stores (GAPA, 2001).
Presently in Malaysia, primary health care and hospital-based setting focus on intervention and treatment among drinkers diagnosed with alcohol abuse and dependence. In fact, harmful drinking such as irregular excessive drinking to heavy episodic drinking are widespread across the population and not merely exhibited by abusive or dependence drinkers (Woerle et al., 2007; Neumark, 2012). Initiating early population-based approach may avert the severity of hazardous drinking in community that might reduce the cost of hospitalization and palliative care caused by alcoholism (Room et al., 2005).
For a better feasible intervention, it is important to identify the high-risk population by examining the pattern of alcohol consumption by socio-demographic factors that could impart information on lifestyles and health outcomes due to their drinking (Oers et al., 1999). Few studies had reported socio-demography factors such as age, gender and socio-economic status were associated to drinking problems (Oers et al., 1999; Thomkins et al., 2007; Wu et al., 2008a; Assanangkornchai et al., 2010) and their findings were useful in providing information for focused intervention at their respective communities.
Therefore, this study was carried out to obtain insight information pertaining to the patterns of alcohol consumption and risky drinking in relation to socio-demography characteristics among the population in Malaysia. We would also like to examine the preference for types of alcohol beverages and adverse effects that associated with drinking use among the drinkers. This information is essential to estimate the magnitude and trends of alcohol-related harms, strengthening the advocacy, formulating policy and assess the impact of existing intervention.
METHODOLOGY
Data source and sample
Data was obtained from the National Health and Morbidity Survey (NHMS) 2011, a cross-sectional population-based study conducted between the period of April 2011 to July 2011. The study employed two stages stratified random sampling design with a proportionate allocation across the stratum. Details of the methodology were provided in the report (IPH, 2011).
All eligible households aged 13 years and above who consented to participate were included in the NHMS study. For the purpose of this study, we included all respondents who reported consumed alcohol for the past 12 months prior to data collection. The NHMS 2011 study protocol was approved by the Medical Review and Ethics Committee (MREC), Ministry of Health Malaysia.
Instruments
A structured and validated Malay version of Alcohol Use Disorder Identification Test (AUDIT-M) questionnaire was used in this study and was adopted from AUDIT questionnaire designed by the WHO that has been published elsewhere (Saunders et al., 1993; Allen et al., 1997; Babor et al., 2001).
The AUDIT-M has been translated into three languages including Bahasa Malaysia, Mandarin and Tamil. The Bahasa Malaysia translation has been back translated and cross-culturally validated (Pearson's correlation, r = 0.94, Cronbach α = 0.84), while the Mandarin version was adapted from the validated Chinese study (Wu et al., 2008b). Respondents were provided with a codebook that illustrated one standard drink of alcoholic beverage that contains 10 g of pure alcohol (KKM, 2010). Score was given to respondent who completed their AUDIT-M. For the purpose of this study, two classifications were used namely low risk (score = 1–7) or risky (AUDIT-M score = 8–40).
Measures and definition of variables
All independent variables in categorical included socio-demography and alcohol use variables. Socio-demography variables include residency either urban or rural, sex, ethnicity comprised Malay, Chinese, Indian, Bumiputera Sabah and Sarawak (Borneo natives), and 16 other ethnicities grouped in ‘Others’. Education attainment includes those who never attended school was grouped ‘No formal education’, followed by primary education, secondary education and tertiary education. Household income status includes low income with household income less than RM 2600, middle income with household income ranging from RM 2600 to RM 5599 and high income with household income greater than RM 5600 per month.
Alcohol use data variables
Prior to data collection, all respondents who consumed alcohol beverages for the past 12 months were defined as current drinker. The ex-drinker was among those who had stopped drinking alcohol beverages for the past 12 months. Ever-drinker was among those who had history of alcohol consumption at least once in their lifetime, and lifetime abstainer was defined among those who never consumed alcohol beverages in their lifetime.
Frequency of drinking was measured by how much drink they drank for the past 12 months with a possible categorical answer (1) = once in a month, (2) = 2–4 times a month, (3) = 2–3 times a week or (4) = 4 or more times a week.
The types of alcohol beverages were grouped according to the percentage of alcohol content. Category 1 = Shandy with alcohol content <2%, category 2 = Beer includes Lager, Ale, or Stout, with alcohol content <9%. Category 3 = Wine, includes cider, champagne, peri, tuak, tuak kelapa, lihing or todi, with alcohol content between 10 and 25%, and category 4 = Brandy includes rum, whiskey, vodka, gin, samsu, samcheng, montoku or langkau with alcohol content >30%. Harmful effects due to alcohol use were examined include feeling of remorse, blackout and self-inflicted injury or causing injury to others.
Data analysis
Analysis of complex sample design was incorporated in this study including weights and stratification using Stata 12 software (Stata Corporation).
A descriptive analysis for continuous variables was carried out to observe the estimated mean of drinking onset among all respondents by sex. Bivariate categorical analysis was done to calculate estimated prevalence of alcohol consumption and risky drinking by the socio-demography characteristics.
A multiple logistic regression analysis of survey data were utilized to assess the association between categorical dependent variable of risky drinking with the independent variables of potential socio-demographic characteristics, i.e. strata, sex, ethnicity, education level and household income.
Preliminary bivariate association analyses were done including Rao-Scott F-Tests to assess the association of risky drinking with the individual selected socio-demography characteristic variables. All significant independent variables that associated with risky drinking at P-value <0.25 were selected for main effects in multivariate logistic regression. Adjusted Wald test was utilized to evaluate the contribution of each selected independent variables in multivariate logistic model. A diagnostic testing for the goodness of fit was done to ensure the fit of the logistic regression model for all selected parameters with the risky drinking status. Interactions were assessed to ensure any interactions might scientifically relevant among the independent variables that may affect the model in term of multi-collinearity. A final model that was created includes all those predictors, which were significantly associated with risky drinking at the level of P-value <0.05.
RESULTS
Response rate
In total, 21,011 respondents were eligible to participate in this study and there were 99.3% (n = 20,869) had responded. Among them, there were 86.7% (n = 18,073) reported did not consume alcohol and 8.4% (n = 1,759) respondents consumed alcohol for the past 12 months prior to data collection. Among the past year drinkers, there were only 96.2% (n = 1692) had completed their AUDIT-M questionnaire and was given a score while 0.7% (n = 181) were excluded and not given score for their drinking status due to incompleteness. There were 4.9% (n = 1,037) ex-drinker were also excluded for the purpose of this study.
Socio-demography characteristics of respondent
Majority of respondents (71.3%) resided in urban areas and 51.5% were males. The population consisted of the following ethnicities: 50.5% Malays, 24.9% Chinese, 7.0% Indian, 11.1% Bumiputera Sabah and Sarawak, and 6.4% other ethnicities. By education level, majority of respondents had completed secondary education (45.4%), followed by primary education (26.5%), tertiary education (18.5%), and those who had no formal education (9.7%). Majority of respondents came from low-income family (42.5%), middle income (39.3%) and high income (18.2%).
Prevalence of alcohol use and risky drinking status
The prevalence of lifetime abstainer was 81.7% (95% CI: 80.3, 83.1) and ever-consumed alcohol was 17.8% (95% CI: 16.4, 19.2). Meanwhile, the prevalence of current drinker was 11.6% (95% CI: 10.5, 12.7) and ex-drinker was 6.1% (95% CI: 5.5, 6.7). Among the current drinker, 23.6% (95% CI: 21.0, 26.4) had practiced risky drinking.
As demonstrated in Table 1, the prevalent of current drinker was significantly higher among the urbanites than in rural. Despite low alcohol consumption in rural, they were more likely to practice risky drinking. As for sex, males consumed more alcohol than females and concurrently practiced risky drinking.
Baseline socio-demographic characteristics of the current drinker in Malaysia
| SCD characteristics | Current drinker | Risky drinker | ||||
|---|---|---|---|---|---|---|
| n | N | Prevalence (%) | n | N | Prevalence (%) | |
| Malaysia | 1759 | 2,394,204 | 11.6 (10.5, 12.7) | 395 | 540,888 | 23.6 (21.0, 26.4) |
| Location | ||||||
| Urban | 1144 | 1,887,084 | 12.6 (11.3, 14.0) | 236 | 391,518 | 21.8 (18.9, 24.9) |
| Rural | 615 | 507,119 | 8.9 (7.3, 10.9) | 159 | 149,369 | 30.4 (24.9, 36.5) |
| Sex | ||||||
| Male | 1314 | 1,815,499 | 17.2 (15.6, 18.9) | 364 | 493,367 | 28.3 (25.3, 31.5) |
| Female | 445 | 578,705 | 5.7 (4.9, 6.6) | 31 | 47,521 | 8.7 (5.3, 13.9) |
| Ethnicity | ||||||
| Malay | 71 | 89,354 | 0.9 (0.6, 1.2) | 24 | 26,774 | 31.5 (20.6, 44.8) |
| Chinese | 966 | 1,416,402 | 27.5 (25.2, 30.0) | 137 | 220,247 | 16.4 (13.5, 19.8) |
| Indian | 255 | 272,440 | 18.8 (15.7, 22.3) | 65 | 76,956 | 29.8 (22.1, 38.8) |
| Bumiputera Sarawak and Sabah | 360 | 466,266 | 20.3 (16.8, 24.3) | 136 | 170,879 | 37.4 (31.1, 44.3) |
| Others | 107 | 149,743 | 11.3 (7.7, 16.1) | 33 | 46,031 | 30.9 (21.0, 42.9) |
| Education attainment | ||||||
| No formal education | 107 | 130,797 | 7.7 (5.6, 10.5) | 20 | 25,672 | 20.9 (12.6, 32.6) |
| Primary education | 388 | 460,830 | 9.4 (8.1, 10.9) | 94 | 109,753 | 25.2 (19.9, 31.3) |
| Secondary education | 855 | 1,160,078 | 12.0 (10.7, 13.4) | 228 | 328,261 | 29.4 (25.2, 33.9) |
| Tertiary education | 401 | 635,858 | 15.0 (12.8, 17.4) | 53 | 77,201 | 12.7 (9.2, 17.2) |
| Household income | ||||||
| Low income | 606 | 740,044 | 8.4 (7.3, 9.7) | 165 | 203,505 | 28.4 (23.6, 33.7) |
| Medium income | 710 | 974,245 | 12.0 (10.5, 13.7) | 159 | 217,407 | 23.7 (19.8, 28.2) |
| High income | 443 | 679,913 | 18.1 (15.4, 21.2) | 71 | 119,974 | 18.2 (14.1, 23.2) |
| Age | ||||||
| 13–17 | 83 | 121,053 | 4.2 (3.3, 5.6) | 17 | 303,305 | 26.8 (15.9, 41.5) |
| 18–29 | 504 | 866,650 | 14.0 (12.2, 16.0) | 142 | 220,300 | 26.4 (21.4, 32.0) |
| 30–39 | 418 | 568,060 | 14.5 (12.8, 16.5) | 94 | 126,364 | 23.1 (18.4, 28.7) |
| 40–49 | 354 | 435,155 | 13.2 (11.3, 15.4) | 80 | 98,166 | 23.3 (18.3, 29.2) |
| 50–59 | 250 | 244,664 | 10.5 (8.8, 12.4) | 39 | 40,180 | 17.9 (12.6, 24.7) |
| ≥60 | 150 | 158,621 | 7.7 (6.2, 9.5) | 23 | 25,572 | 16.9 (10.7, 25.5) |
By ethnicity, Chinese were more prevalent with alcohol use followed by Bumiputera Sabah and Sarawak, Indian and other ethnicity while Malays were the least. Conversely Chinese were the least who practiced risky drinking, therefore, risky drinking was more predominant among the Bumiputera Sabah and Sarawak, Malays and Other ethnicity.
By education attainment, those with tertiary education were more prevalent to alcohol use. The drinking pattern declined from those with higher to lower education attainment. In contrast, those with at least secondary education were more prevalent to risky drinking followed by the lower education attainment. Similar patterns were exhibited by the household income status.
Those aged between 18 and 39 years old showed the highest prevalence of alcohol consumption than the other age groups and the pattern declined by the advanced age. Elderly was more common with low risk drinking but young adults were prevalent to risky drinking.
Onset age for alcohol drinking
The onset age for alcohol drinking was 21 years old (SD 7.4). Male was significantly more likely to drink earlier at age of 20.3 [95% CI: 19.9, 20.7] than female (21.9, 95% CI: 21.3, 22.6).
Alcoholic beverages commonly consumed
Overall beer (59.7%, 95% CI: 56.8, 62.6) was the most preferred drink in Malaysia, followed by Wine (16.9%, 95% CI: 14.6, 19.3), Shandy (13.3%, 95% CI: 11.3, 15.5) and Brandy (10.1%, 95% CI: 8.3, 12.2). Males and females showed similar favoritism to beer compared with other alcoholic beverages.
Majority of those who practiced risky drinking preferred Beer (64.3, 95% CI: 58.1, 70.0) followed by Brandy 15.6%, 95% CI: 11.3, 21.2), Wine (13.0%, 95% CI: 9.5, 17.6) while Shandy was the least preferred (7.1%, 95% CI: 3.9, 12.6).
Amount consumed and drinking frequency
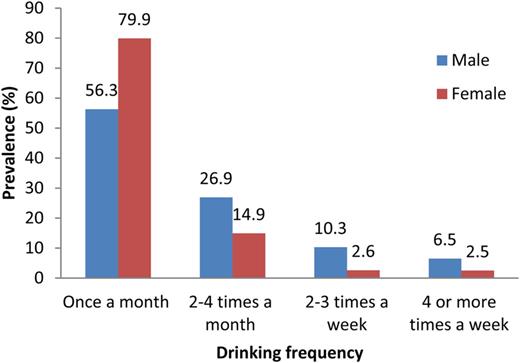
Drinking frequency by male and female.
Adverse effects
Most of the current drinkers were ever advised on their drinking while ever experienced injury or self-inflicted injury due to alcohol drinking was the least. Males were getting more alcohol-related problems than females as per illustrated in Table 2.
Associated adverse effects due to alcohol consumption by sex
| Drinking problems | National | Male | Female | P-value |
|---|---|---|---|---|
| Feeling of remorse/guilt after drinking | 13.10% (11.0, 15.5) | 15.50% (12.8, 18.2) | 5.20% (1.8, 8.7) | P < 0.001a |
| Blackout | 15.70% (13.1, 18.8) | 18% (14.9, 21.6) | 6.60% (3.5, 12.2) | P < 0.001a |
| Injury to self or others | 3.70% (2.7, 5.0) | 4.70% (3.2, 6.2) | 0.50% (−2.3, 1.2) | P < 0.001a |
| Advice on drinking | 27.30% (24.4, 30.3) | 32% (28.5, 35.6) | 12.2 (7.9, 16.5) | P < 0.001a |
aSignificance at P < 0.05.
Multivariate analysis to predict socio-demography as associated potential predictors to risky drinking
From the Table 3, potential predictors like sex and ethnicity (excluding the Malays) had a significant relationship with the risky drinking after adjusting for the relationships of all other potential predictors at P < 0.05.
Estimates of crude and adjusted odd's ratios for the risky drinking outcome (n = 1,684, n = 2,284,554)
| Variable | Category | Simple logistic regression | Multiple logistic regression | ||||
|---|---|---|---|---|---|---|---|
| b | Crude OR (95% CI) | P | b | Adjusted OR (95% CI) | P | ||
| Strata | Urban | – | 1 | – | – | 1 | – |
| Rural | 0.452 | 1.571 (1.125, 2.193) | P = 0.008a | −0.136 | 0.873 (0.576, 1.322) | P = 0.521 | |
| Sex | Male | 1.422 | 4.144 (2.422, 7.092) | P = < 0.000a | 1.266 | 3.546 (2.111, 5.954) | P = 0.000a |
| Female | – | 1 | – | – | 1 | – | |
| Ethnicity | Malay | 0.851 | 2.341 (1.252, 4.373) | P = 0.008a | 0.590 | 1.805 (0.909, 3.583) | P = 0.091 |
| Chinese | – | 1 | – | – | 1 | – | |
| Indian | 0.770 | 2.160 (1.353, 3.447) | P = 0.001a | 0.544 | 1.722 (1.081, 2.745) | P = 0.022a | |
| Bumiputera Sabah and Sarawak | 1.114 | 3.048 (2.111, 4.399) | P = 0.000a | 1.008 | 2.741 (1.768, 4.250) | P = 0.000a | |
| Others | 0.823 | 2.277 (1.302, 3.982) | P = 0.004a | 0.758 | 2.135 (1.143, 3.988) | P = 0.017a | |
| Education level | No formal education | – | 1 | – | – | 1 | – |
| Primary education | 0.248 | 1.282 (0.584, 2.814) | P = 0.535 | 0.408 | 1.504 (0.640, 3.535) | P = 0.348 | |
| Secondary education | 0.459 | 1.582 (0.773, 3.239) | P = 0.209 | 0.712 | 2.038 (0.920, 4.514) | P = 0.079 | |
| Tertiary education | −0.590 | 0.554 (0.255, 1.204) | P = 0.136 | −0.080 | 0.923 (0.385, 2.212) | P = 0.857 | |
| Unclassified | 0.203 | 1.020 (0.294, 3.537) | P = 0.974 | 0.192 | 1.212 (0.384, 3.822) | P = 0.742 | |
| Household income | Low income | 0.574 | 1.775 (1.198, 2.631) | P = 0.004a | 0.0679 | 1.070 (0.656, 1.747) | P = 0.785 |
| Medium income | 0.333 | 1.396 (0.946, 2.058) | P = 0.092 | −0.062 | 0.940 (0.615, 1.437) | P = 0.774 | |
| High income | – | 1 | – | – | 1 | – | |
Adjusted Wald Test for all parameters: F(12, 434) = 7.08 P < 0.001.
Reference categories for categorical predictors are: strata (urban); sex (female); ethnicity (Chinese); education level (no formal education; household income (≥RM 5600)
aSignificance at P < 0.05.
Males significantly had higher odds of 3.5 times to risky drinking than females after adjusting the effect of strata, ethnicity, education level and household income. Ethnicity was significantly associated with risky drinking where Bumiputera Sabah and Sarawak had the highest odds of 2.7 followed by other ethnicity with the odds of 2.1 higher than Chinese relatively. Indian had odds of 1.7 higher than Chinese relatively after adjusting for all the other covariates, however the Malays showed no significant association with risky alcohol use. Strata, education level and household income did not show any significant association with risky alcohol use.
DISCUSSION
For the past 5 years, there was no significant change to the prevalence of current alcohol use despite slight increased from 11.1% in 2006 to 11.6% in 2011 (IPH, 2008). This study is not comparable to a study in NHMS 1996 because the alcohol use module only included nonMuslim respondents aged 18 years old and above (IPH, 1999).
In comparison to other Asian country, the prevalence for current alcohol use status in Malaysia was still lower than Thailand (28.6%) (Assanangkornchai et al., 2010). As expected, the prevalence of abstinence in Malaysia was higher than other neighboring countries like Singapore (74.8%) and Thailand (61.9%) (DEDC, 2007; Assanangkornchai et al., 2010) and these drinking pattern might differ due to socio-cultural factors exhibited by the drinkers from each of the countries (Bloomfield et al., 2003). As the Malays were the major respondents in this study, they had diluted the prevalence of alcohol use due to alcohol-drinking restrictions by their religion.
However, when comparing lifetime abstainers in Malaysia with other countries populous by the Muslims, Malaysia had the lowest lifetime abstainers (81.7%) compared with Bangladesh (93.6%) and Indonesia (84.3%) (WHO, 2011). Higher abstinence in Bangladesh was due to their country's policy on strict prohibition of production, sale and consumption of alcoholic beverages that prevent accessibility and alcohol use in their population (GAPA, 2001).
In this study, the urbanites drank more alcohol than rural residents and the pattern remain unchanged for the past 5 years (IPH, 2008). Higher alcohol use in urban is associated with living status and social activity as reported in few studies (Wu et al., 2008a; Peltzer and Ramlagan, 2009; Assanangkornchai et al., 2010).The widespread of alcohol marketing, affordability and accessibility to drinking outlets have influenced more urbanites to drink (Room, 1990; WHO, 2001; Wu et al., 2008a).
In contrast, alcohol use in rural was lower than urban but rural drinkers exhibited higher prevalence of risky drinking. Excessive drinking in rural was related to the availability of homemade alcohol production that induced risky drinking (Room, 1990; ADCA, 2011). It was denoted that excessive drinking in rural has become a community acceptance that was associated with their poor awareness on adverse alcohol use (ADCA, 2011).
Differences in drinking by ethnicity background have been associated with religious beliefs and cultural practices especially among the drinkers in Asia (Bich et al., 2009). This study found high consumption of alcohol among the Chinese that also contributed to a higher prevalence of alcohol use as noted among the urbanites. As for Indians, similar pattern was observed from previous study where alcohol use and risky drinking among them was low (IPH, 1999, 2008). However, this does not imply that the Indian drinkers at lower risk because it was noted they were inclined for cheap alcohol beverages with high alcohol content (GAPA, 2001) and majority of alcohol dependence cases at hospital were predominant by the Indians (IPH, 1999).
The high-risk group for alcohol consumption was clearly observed among the Bumiputra Sabah and Sarawak where alcohol drinking is socially acceptable in their community that attributable to their cultural background (IPH, 1999). Alcohol is easily available especially during festive seasons because they tend to produce homemade alcohol beverages with high alcohol content (IPH, 1999; GAPA, 2001). Alcohol use among the Malays is uncommon and they were the least to consume alcohol due to religion restrictions. Strikingly, the Malays drank hazardously and the pattern has remained unchanged from previous study (IPH, 2008). It is also proven that irregular drinking pattern among the Malays induced heavy drinking and this behavior of drinking was similarly reported among those irregular underage drinkers in Thailand (Assanangkornchai et al., 2010).
This study found gender differences on alcohol consumption where males were predominant than females, which is consistent with other studies (WHO, 2001; Almeida-Filho et al., 2004; Lim et al., 2007; Saarni et al., 2008; Bich et al., 2009; Assanangkornchai et al., 2010). Males also more prone to risky drinking practice and simultaneously took alcohol more frequent and experienced more alcohol related problems (Almeida-Filho et al., 2004; Hao et al., 2004; Assanangkornchai et al., 2010). Study revealed place of drinking signify the differences of alcohol drinking among males and females (Assanangkornchai et al., 2010). Males drink frequently at bars or friend's house (Assanangkornchai et al., 2010) that linked to their socializing and networking activity (Wu et al., 2008a). Males also found to drink more at their workplace (Assanangkornchai et al., 2010) when they were occupationally stress (Almeida-Filho et al., 2004). Females tend to abstain themselves from alcohol due to cultural restrictions (WHO, 2001; Assanangkornchai et al., 2010) and typically they might drank occasionally at home or at parties (Assanangkornchai et al., 2010). Despite lower prevalence of alcohol consumption, females tended to drink more frequent when compared with other types of risky drinking (Lim et al., 2007) and younger females prone to drink more and get drunk as cultural changes by time in Thailand (Assanangkornchai et al., 2010).
There is evidence suggesting that the age of onset played a significant predictor to lifetime alcohol related problems (Kraus et al., 2000) and early drinking may cause alcohol disorder in later life (Kraus et al., 2000; Hingson et al., 2006; Gomez et al., 2011). Several countries reported early onset for alcohol drinking as early as 16 years old and below (Kraus et al., 2000; Pitkanen and Lyyra, 2005). Conversely, this study reported a drinking onset later as early as 21 years old and as expected, males more likely to drink earlier than females.
Similarly with other studies, current alcohol drinking was more prevalent among those aged 30 to 39 years old and the pattern increased from aged 18 to 29 years old and declined as advanced age (McKee et al., 2000; Hao et al., 2004; Lim et al., 2007). However, risky drinking pattern was prevalent among those aged 29 years old and below that is noted with irregular drinking habit leading to excessive consumption of alcohol (Assanangkornchai et al., 2010).
This study revealed an antipodes-drinking pattern by the socioeconomic status such as household income status and education attainments. Current drinking pattern peaked among those with high income and high education attainments while in contrary, risky drinking pattern was prevalent among those with low household income and low education attainments. Previous study in Malaysia reported similar findings where alcohol consumption has positive relationship with the increase of income (IPH, 1999). Other study revealed that education attainment was significantly correlated with risky drinking habit whereby those with lower education attainments reported at risk for heavy drinking compared with those with high education attainments (Thomkins et al., 2007; Bich et al., 2009). Low self-esteem, insecure feeling and lack of economic and social stability were factors that induced risky drinking among those with low education attainment (Thomkins et al., 2007).
In this study, majority drinkers preferred Beer than any other beverages as Beer is easily available at the markets compared with other alcoholic beverages (GAPA, 2001). In Malaysia, beer and stout are sold together with soft drinks at supermarkets without requirement for license, and it is the most commonly served at most coffee shops (GAPA, 2001) compared with other alcoholic beverages like Wine that are limited and served at selected licensed premises and bars. Those with risky drinking pattern also had preference for beer and high alcohol content like brandy. Risky drinker with alcohol dependence problem usually has preference for high alcohol content like spirits, therefore require for intensive treatment (Baltieri et al., 2009).
Similar findings was reported in other study where harmful effects due to drinking were more prevalent among males than females (Oers et al., 1999), where males tended to experience blackouts, feeling remorse, and injury. Males were also more prone to remorse and getting involved in fighting while females who drink harmfully usually experienced remorse (Assanangkornchai et al., 2010). All those outcomes were significantly associated with excessive drinking behavior as demonstrated by males.
Recommendation
Intensify early screening by incorporating nursing vital signs with assessment of alcohol and tobacco use had evidently prompted for substance abuse cessation and increase intervention rates among people with drinking problems (Seale et al., 2010). Coalition from the stakeholders, religious groups, nongovernmental organizations, educators and academicians will improve best practices policy and activities to prevent and reduce the alcohol-related harm in the community. Controlling outlet density and increase the alcohol tax might limit alcohol accessibility and subsequently reduce harmful drinking pattern, heavy drinking and alcohol related harms (Chaloupka et al., 2002; Weitzman et al., 2003).
Limitations
We used AUDIT-M, an alcohol-screening tool to assess risky drinking pattern profile among respondents in the population and confirmation of such condition would be based on clinical diagnosis for further treatment (Neumark, 2012). Presently, AUDIT-M is widely used in primary healthcare setting in Malaysia for screening and early detection consequently for intervention of alcohol use problems and related harms.
Secondly, the score for AUDIT-M was adopted from the cutoff score from WHO (Babor et al., 2001; KKM, 2010). The AUDIT-M cutoff score has yet validated in the context of Malaysian population or by gender differences. Gender differences in alcohol drinking and metabolism have been discussed elsewhere (ICAP, NIAAA, 1997). We anticipate further psychometric evaluation in order to accurately detect risky drinking for further early prevention and treatment.
CONCLUSION
Alcohol consumption was higher in urban but the risky drinking pattern widespread in rural. Males, Bumiputera Sabah and Sarawak were prevalent for alcohol consumption and at risk for risky drinking. Risky drinking was also more predominant among lower socio-economic groups despite lower consumption. Early screening and focused intervention is necessary to prevent prolong drinking and severe alcohol dependence that could burden the cost of treatment and medical care.
Conflict of interest statement
None declared.
Acknowledgements
The authors are grateful to the Director General of Health in Malaysia for allowing us to publish the findings of this study.
