


Abstract
frailty impacts older adults’ ability to recover from an acute illness, injuries and other stresses. Currently, a systematic synthesis of available interventions to prevent or reduce frailty does not exist. Therefore, we conducted a scoping review of interventions and international policies designed to prevent or reduce the level of frailty in community-dwelling older adults.
we conducted a scoping review using the framework of Arksey and O'Malley. We systematically searched articles and grey literature to identify interventions and policies that aimed to prevent or reduce the level of frailty.
fourteen studies were included: 12 randomised controlled trials and 2 cohort studies (mean number of participants 260 (range 51–610)), with most research conducted in USA and Japan. The study quality was moderate to good. The interventions included physical activity; physical activity combined with nutrition; physical activity plus nutrition plus memory training; home modifications; prehabilitation (physical therapy plus exercise plus home modifications) and comprehensive geriatric assessment (CGA). Our review showed that the interventions that significantly reduced the number of frailty markers present or the prevalence of frailty included the physical activity interventions (all types and combinations), and prehabilitation. The CGA studies had mixed findings.
nine of the 14 studies reported that the intervention reduced the level of frailty. The results need to be interpreted with caution, as only 14 studies using 6 different definitions of frailty were retained. Future research could combine interventions targeting more frailty markers including cognitive or psychosocial well-being.
Introduction
With increasing age the risk of frailty increases. While there are several definitions of frailty, it is seen as a multidimensional concept with various indicators such as weight loss, lack of physical activity and lack of strength [1, 2]. A systematic review showed that the weighted prevalence of frailty in community-dwelling older adults was 10.7% (ranging between 4.0 and 59.1) [3].
Previous research has shown that frail older adults are more at risk for adverse health outcomes, such as falls, mobility decline, hospitalisation, institutionalisation and increased risk of death [4]. Research highlights that frailty is potentially reversible [5]. Therefore, it is important to identify frailty to prevent, reduce and postpone adverse health consequences for older adults and their caregivers. There have been many studies examining the prevalence of frailty and validity of several frailty models. However, there has not been a comprehensive review of interventions and/or policies that can prevent or reduce the level of frailty in community-dwelling older adults. Ideally, these interventions could be implemented by primary healthcare providers and/or older adults and /or their families/caregivers, and would focus on improving outcomes that are important to older adults [6]. A comprehensive review of interventions to prevent and reduce frailty is also important for healthcare professionals who will want to ensure that they are well equipped to assist community-dwelling older adults and their families/caregivers once frailty is identified.
Therefore, in this scoping review, our aim was to identify relevant peer-reviewed and grey literature on interventions and policies to prevent and/or delay frailty in community-dwelling older adults. Our research question was: Which interventions and policies focused on reducing frailty exist and to what extent are these interventions effective? We have chosen the scoping review methodology as it allows for inclusion of quantitative and qualitative studies, grey literature and includes a stakeholder consultation which we considered important for future intervention development and uptake.
Methods
The scoping review methodology protocol has been published [7] but we describe it briefly below.
Review methodology
We used the scoping review methodological framework as described by Arksey and O'Malley [8] with the modifications recommended [9, 10] Our six-stage scoping review model included: (i) identifying the research question; (ii) identifying relevant studies; (iii) selecting studies; (iv) charting data; (v) summarising and reporting the results and (vi) consulting with stakeholders. We followed the reporting guidelines for PRISMA statement [11].
Search methods
Our inclusion criteria were: original publications of an intervention to prevent or to reduce the level of frailty in community-dwelling older adults aged ≥65 years; and/or studies that included a wider age range were eligible if the mean/median age of the study population was aged 65 years and over and/or if they had included a subgroup analysis for the population aged >65 years. Included studies needed to provide a measure of frailty before and after the intervention. Grey literature that had information on the effect of the interventions or policies to prevent or reduce frailty were eligible.
We searched for publications dated between January 2000 and February 2016 using key words and Medical Subject Headings terms such as frail elderly or frailty AND interventions or evaluation study randomised trial AND Aged or 65 and over or senior. Searches (including grey literature) were performed with no language restrictions and carried out by three librarians on our team. See Appendix A for the Medline search strategy used.
We searched the Cochrane Central Register of Controlled Trials (CENTRAL), Cochrane Effective Practice and Organisation of Care Group (EPOC), MEDLINE, EMBASE, Cumulative Index to Nursing and Allied Health (CINAHL), Allied and Complementary Medicine (AMED), Psych INFO, Ageline, Sociological Abstracts, Web of Science, Applied Social Sciences Index and Abstracts (ASSIA), Database of Abstracts of Reviews of Effects (DARE), Health Technology Assessment (Canadian Search Interface) databases and reference lists of included studies. We searched trial registries for potential studies in progress.
Study selection
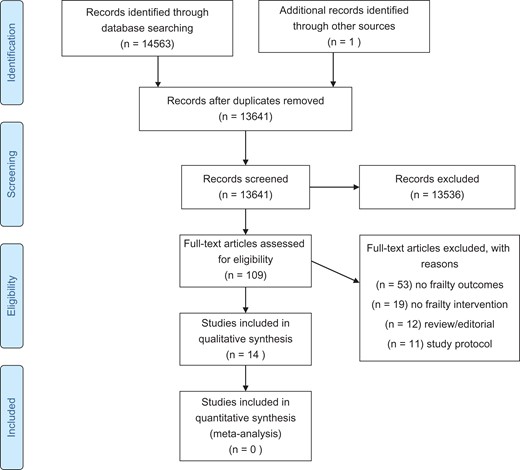
PRISMA FLOW CHART of the selection of included studies in the review.
Data abstraction
We used standardised data collection forms developed by the research team. Data were abstracted by two reviewers independently and compared. The information abstracted included: characteristics of the study population, study design details, frailty assessment used and levels of frailty of study participants, intervention details and outcomes, analyses used.
Quality assessment
We assessed the quality of the included studies using the Mixed Methods Appraisal Tool (MMAT) [12]. The MMAT is a quality assessment tool that is useful to assess qualitative, quantitative and mixed method studies. Incomplete reporting, preventing reproducibility and transparency in the methods, and factors that can lead to selection bias such as low response rates (<60%), contamination in trials, measurement error, etc. can all lead to lower quality ratings. By using the MMAT it allowed us to use one quality assessment tool to review all studies. We used the MMAT to review study quality but we did not exclude any study based on the score.
Data analysis
We summarised the results using a narrative descriptive synthesising approach. There was heterogeneity in study inclusion criteria, interventions, frailty assessment tools and outcomes, thus a pooled analysis was not appropriate.
Consultation
We organised a stakeholder consultation (step 6 of the framework) on 19 May 2016 including older adults, family caregivers, representatives of provincial and national community organisations, senior organisations and primary care organisations to provide feedback on the findings and to develop next steps in research and practice. An older adult and caregiver reviewed the results for accuracy. We summarised their feedback and present it below.
Results
Characteristics of included studies
In this review, 14,563 abstracts were retrieved, and after deduplication 13,641 abstracts were reviewed by two independent reviewers. One hundred and nine articles were selected for full text review and 14 studies were included in this review. Twelve studies were randomised controlled trials (RCTs) [13–23] and two studies were part of larger cohort studies [24, 25] (see Supplementary data, Tables A and B, available at Age and Ageing online). Seven studies were conducted in Asia [5, 17–19, 21, 24, 25], 3 in Europe [16, 20, 23], 3 in USA [13–15] and 1 in Australia [22]. Sample sizes varied from 51 to 610 with a mean of 260 participants and a total of 3,632 participants. The total and the mean number of participants for RCTs were 2,475 and 206. The study mean age ranged from 70 [5] to 86 years [23]. The percentage women in the study ranged from 48% [21] to 100% [18, 19].
Quality of the included studies
The quality assessment results are presented in Supplementary data, Table C, available at Age and Ageing online. The quality was moderate to good for most studies. The response rate was not reported for the two cohort studies [24, 25] and for the RCTs it varied between 39% [18] and 100% [20]. The randomisation, allocation concealment and the level of blinding were not always described [5, 14, 16, 20, 21]. For four studies it was not reported whether the analysis was intent-to-treat [14, 16, 18, 19]. Two studies had a drop-out rate greater than 20% and thus selection bias may be present [14, 16].
Interventions studied
The interventions included physical activity compared to control (four studies) [13, 14, 16, 24]; physical activity combined with nutrition compared to control (four studies) [17–20]; physical activity plus nutrition plus memory training compared to control (one study) [5]; home modifications (one study); prehabilitation physical therapy (PT; plus exercise plus home modifications) (one study) [15] and geriatric assessment (three studies) [21–23] (Table 1 and Supplementary data, Table D, available at Age and Ageing online).
Characteristics of included participants
| First author and publication year | Country of study | % women | Frailty definition used in study | Inclusion criteria | Exclusion criteria | Sample size and mean age of participants |
|---|---|---|---|---|---|---|
| Binder 2002 [14] | USA | CG 53% IG 52% | Frailty based on 3 measures: (i) the PPT, (ii) activities of daily living and (iii) measurement of peak oxygen uptake |
|
| N = 119, mean age 83, SD 4 |
| Cameron 2013 [22] | Australia | 68% | The CHS criteria |
|
| N = 241, mean age 83.3, SD 6 |
| Cesari 2015 [13] | USA | 68.9 | The CHS criteria |
|
| N = 424, mean age 76.8, SD 4.2 |
| Chan 2012 [17] | Taiwan | 59% | CCSHA_CFS_TV and the CHS frailty criteria |
|
| N = 117, mean age 71.4, SD 3.7 |
| Gill 2003 [15] | USA | 90% | Physically frail which as determined by two tests (rapid gait speed) and single chair stand. |
|
| N = 188, mean age 83, SD 5 years |
| Gine-Garriga 2010 [16] | Spain | 61% | Physical frailty Gill and Tinetti definition or self-reported exhaustion |
|
| N = 51, mean age IG 84.1 (SD 3) and control 83.9 (SD 2.8) |
| Gustafsson 2012 [23] | Sweden | 64% | Adjusted CHS criteria |
|
| N = 459, mean age control was 86, preventative home visit mean age 86 and senior meetings mean 85 |
| Kim 2015 [18] | Japan | 100% | The CHS criteria |
|
| N = 131, mean age 81, SD 3 years |
| Kwon 2015 [19] | Japan | 100% | Lowest 20% handgrip strength and lowest quartile walking speed (2 of 5 CHS criteria) |
|
| N = 89, mean age 76.8 range (70–84) |
| Li 2010 [21] | Taiwan | 48% | The CHS criteria and BI |
|
| N = 310, mean age IG is 78.4, SD 8.2 and the CG is 79.3 SD 8.5 |
| Ng 2015 [5] | Singapore | 61% | The CHS frailty criteria |
|
| N = 246, mean age 70.0, SD 4.7 |
| Tarazona-Santabalbina 2016 [20] | Spain | 54% | The CHS and Edmonton Frailty Scale |
|
| N = 100, mean age IG 79.7 (SD 3.6) and control 80.3 (SD 3.7) |
| Mitoku 2014 [25] | Japan | 65% | Frailty = a change in of care level |
|
| N = 547, mean age 81.4, SD 7.1 |
| Yamada 2012 [24] | Japan | 77% | Frailty score >10 on the frailty checklist items 1–20 |
|
| N = 610, mean age exercise group 79.7, SD 6.3 and mean age CG 80.3, SD 6.6 |
PPT, Physical Performance Test; ADL, activity of daily living; SD, standard deviation; CG, control group; IG, intervention group; HTN, hypertension; CCSHA_CFS_TV, Chinese Canadian Study of Health and Aging Clinical Frailty Scale Telephone Version; CHS, Cardiovascular Health Study consisting of 5 frailty markers; SPBB, short physical performance battery; NH, nursing home; LTCI, long-term care insurance; BI, Barthel index.
The physical activity interventions included group classes in all nine studies [5, 13, 14, 16–20, 24] with sessions ranging in frequency from once weekly [19] to 5 days per week [20]. Most included strength, balance, coordination, flexibility and aerobic exercises provided by exercise professionals, which were progressively increased based on the individuals’ competency and performance. The studies that examined a nutritional arm included interventions ranging from milk fat supplementation [18], supplementation using multi-fibre formula enriched with iron, folate, vitamin B6, B12, D and calcium [5], education [19, 20] and cooking classes based on healthy nutrition focused on the strengthening of muscles through protein and vitamin D rich ingredients in addition to supplementation of vitamin D [19], and one study combined nutritional consultation with exercise [17].
The prehabilitation intervention included PT assessment, environmental assessment of the home and a progressive competency-based exercise programme. The study by Gustafsson et al. had three arms in total including two intervention arms, one group that received a single preventative home visit and one arm that attended 4 weekly educational meetings and a follow-up home visit. The study by Cameron et al. [22] evaluated a multifactorial intervention including a comprehensive geriatric assessment and case management. Li et al. [21] used a similar intervention to that of Cameron et al. The cognitive intervention in the study of Ng et al. [5] consisted of a 2-hour weekly training to stimulate short-term memory and improve attention and information processing skills, as well as reasoning and problem-solving capacity for a 12-week period followed by a booster session. The study by Ng et al. [5] included a combination of exercise, nutrition and cognitive interventions.
The control groups were given successful/healthy ageing interventions (booklets and/or classes) [13, 15, 17], home low-intensity exercise programme [14], usual care [5, 16, 19–23] or placebo supplements [18].
Effect of interventions on frailty
The frailty definitions used are listed in Table 1 and most studies used the Cardiovascular Health Study frailty phenotype (also known as Fried's phenotype) (10 studies) [5, 13, 16–23], the Tinetti/Gill criteria (2 studies) [14, 15] or the Japanese Frailty checklist (2 studies) [24, 25].
The studies that compared exercise to control conditions showed a significant reduction in the total number of frailty markers [13], all individual frailty markers studied [14, 16] or reduction in prevalence of frailty [24] (see Table 2 and Supplementary data, Table E, available at Age and Ageing online). These findings were significant up to 12 months following the completion of the study. Exercise plus nutrition compared with control identified a significant reduction in the prevalence of frailty [17, 18, 20] and mean Edmonton Frailty Scale score [20]. Kwon et al. [19] showed a significant impact on improving grip strength immediately after intervention in the exercise arm compared to control only. Ng et al. showed a significant reduction in the prevalence of frailty ranging from 36% to 48% with the highest reduction in the combination intervention (exercise, nutrition and cognition) followed by exercise, cognitive function and nutrition at 12 months.
Measures of frailty and outcomes of study
| First author and publication year | Frailty definition used in study | Level of frailty of participants pre-intervention | Impact of intervention on frailty outcome |
|---|---|---|---|
| Binder 2002 [14] | Frailty based on 3 measures: (i) the PPT, (ii) activities of daily living and (iii) measurement of peak oxygen uptake | 100% were frail | The IG compared to CG has significantly greater improvements in the modified PPT, significant improvement in VO2max, no change in ADL function |
| Cameron 2013 [22] | The CHS criteria: presence of 5 FM: ≥3 is considered frail; 1–2 pre-frail and 0 = robust. | At baseline all were frail. In the IG 64% had 3, 28% had 4 and 8% had 5 FM. In the CG 65% had 3, 25% had 4 and 10% had 5 FM | Significant reduction in the prevalence of frailty and the number of FM in the IG P < 0.05 at 12 months |
| Cesari 2015 [13] | The CHS criteria | Mean number of FM at baseline is 1.67 (SD 1.1) | At 12 months the CG group had a prevalence of frailty of 19.1% and the IG group 10.0 % (P < 0.05). The mean number of FM in the CG group decreased 0.21 and in the IG group 0.48 at 12 months (P < 0.05) |
| Chan 2012 [17] | CCSHA_CFS_TV and the CHS frailty criteria | At baseline 40% was category 3 (well), 47% category 4 (vulnerable), 11% mildly frail (5) and 2% moderately frail (6). With CHS-PCF 87% were pre-frail and 13% frail at baseline | At 3 months significant difference between EN and non-EN group in the reduction in the number of frail persons |
| Gill 2003 [15] | Physically frail which as determined by 2 tests (rapid gait speed and single chair stand) | In the IG 64% had moderate frailty and in the CG 60%. The others were severely frail | At 7 and 12 months statistically significant differences between IG and CG (decline in the FM in CG) |
| Gine-Garriga 2010 [16] | Physical frailty which as determined by 2 tests (rapid gait speed and single chair stand) or self-reported exhaustion | All participants were frail. At baseline in the IG 59% were classified as frail using the CES-D compared to 63–74% in the CG. At baseline the mean gait speed time needed for the IG was 11.73 (SD 0.6), and for the CG 11.87 (SD 0.65). Mean BI at baseline for IG was 73.4 (SD 2.35) and CG 70.8 (SD 2.35) BI scale ranges (0–90). The mean chair stand test at baseline was 19.55 (SD 0.7) for the IG and 17.05 (SD 0.9) for CG | The IG had greater improvements in all physical frailty tests and those results were maintained at week 36 and significant |
| Gustafsson 2012 [23, 30] | Adjusted CHS criteria | At baseline 70% in the CG was pre-frail (1–2 FM), and 19% frail (>2 FM) and this was 67% and 20% in preventative home visits group and 70% and 16% in senior meetings group | The findings showed an non-significant intervention effect |
| Kim 2015 [18] | The CHS criteria | At baseline the Ex+ MFGm group 33% had 3, 49% had 4 and 18% had 5 FM, the Ex+ placebo 54% had 3, 30% had 4 and 15% had 5 FM. the MFGM group at baseline 44% had 3, 41% had 4 and 15% had 5. The placebo 51% had 3, 46% had 4 and 3% had 5 FM | The percentage non-frail participants at post-intervention was significantly higher in the Ex+ MFGM group (58%) than in the MFGM group (28%) or placebo (30%) (P < 0.05). At 7 month follow-up it was also significantly greater in the Ex+MFGM group (46%), and Ex+placebo (39%) compared to placebo (15%) |
| Kwon 2015 [19] | Lowest 20% handgrip strength and lowest quartile walking speed | 100% were pre-frail | The exercise group compared to the CG had a significant improvement in handgrip strength after the intervention but the effects were reduced at 6 months (NS). No change in walking speed |
| Li 2010 [21] | CHS frailty criteria and BI | At baseline 17% in the IG and 19.6% in the CG were frail. 83% is pre-frail in the IG and 80.4% in the CG group | The findings showed an non-significant intervention effect |
| Ng 2015 [5] | The CHS frailty criteria | Mean number of FM in each group at baseline Nutrition (2.1), Cognitive (2.0), physical (2.2), combined (2.1) control (1.8) | Significant reduction in the number of FM across all 4 groups (P < 0.05). Significant reduction in prevalence of frailty in all IGs compared to control (P < 0.05) |
| Tarazona-Santabalbina 2016 [20] | The CHS and Edmonton Frailty Scale | Mean baseline number of frailty criteria in the IG 3.6 (SD 0.8) compared to CG 3.8 (SD 0.6). The mean Edmonton frail score was 8.6 (SD 2.4) for the IG and 8.5 (SD 1.9) for the CG | The frailty score significantly improved in the IG (P < 0.001), 31.4% had a reversal of frailty and none in the CG. Similarly, the Edmonton Frail scale also significantly improved (mean frailty score after IG 7.7 and 9.3 for CG) |
| Mitoku 2014 [25] | Frailty = a change in of care level | Unclear | The results were NS |
| Yamada 2012 [24] | Frailty score >10 on the frailty checklist | CG frailty checklist pre score 7.3 and IG 7.4 | The total score for exercise group after intervention was 7.1 SD 4.0 and control 8.0 SD 4.8 P < 0.001. During the year, 8% of intervention and 18% in the CG were newly certified for LTCI (considered frail) P < 0.05 |
VO2 max, maximum volume of oxygen consumption; FM, frailty marker; CCSHA_CFS-TV, Chinese Canadian Study of Health and Aging Clinical Frailty Scale Telephone Version; CHS_PCF, cardiovascular health Study Phenotypic Classification of Frailty; EN, Exercise and Nutrition; CES-D, Center for Epidemiological Studies Depression scale; EX+MFGM, exercise and milk fat globule membrane; Ex, Exercise; NS, not significant; P, P-value; HR, hazard ratio.
The studies using geriatric assessment had mixed findings and only Cameron et al. showed a significant reduction in the prevalence of frailty and the total number of frailty markers [22]. Mitoku showed non-significant results of home modifications on frailty prevalence [25].
Adherence and adverse events
While not all studies reported adherence rates, those that did report them ranged from 20% to 28% (for the different components of the intervention) [17] to 100% [14]. Tarazona et al. [20] reported that 77% of participants in the intervention group had 3–6 h. per week exercise and attendance of 50% was associated with an OR of reduction in frailty of 4.4 (95% confidence interval 1.2–16.0) and a number needed to treat of 3.2 (2.0–4.5).
The adverse event reports were very low for the total of 3,632 participants included in the 14 studies ranging from 0 adverse events [16], [22, 23], to 2 injuries each in the exercise arms of two studies [5, 14]. Two studies [13, 15] reported similar adverse events rates in intervention and control groups.
International policies on frailty
Diverse international policies have been developed aiming to prevent or improve frailty [26–28] (see Supplementary data, Table F, available at Age and Ageing online). The European Commission has recently created a key initiative that targets the prevention of functional decline and frailty (European Scaling-up Strategy in Active and Healthy Ageing) [29] that includes an action group focused on the prevention and early diagnoses of frailty and functional decline (both physical and cognitive) [27]. Other European initiatives are the SPRINTT Project (SPRINTT) [28], a large clinical trial with the overall goal of improving frailty care and prevention; and advocates for use of the SHARE-FI, an instrument developed to identify frailty in Primary Care settings [26].
Stakeholder consultation
Thirty-three stakeholders including persons living with frailty, their caregivers and administrators of healthcare organisations attended our consultation meeting in person or by webinar. A concern expressed by many attenders was that interventions studied so far were focused exclusively on physical function. Stakeholders commented that a broader definition of frailty including cognitive, social and psychological areas was required and so too are then the interventions to modify it. Stakeholders felt the assessment of frailty in these intervention studies would benefit from the inclusion of a more subjective method, such as the perspective of the caregiver. Caregivers spoke of the need to focus on the process of assisting frail elders to actually follow through on physical regimes as prescribed in these studies and the over-reliance on caregivers to assist with delivering the intervention; they felt this potential burden should be considered carefully. Finally, stakeholders spoke about the stigma regarding frailty and suggested it should addressed as very few people want to be labelled as ‘frail’, which makes inviting them into possible programmes to prevent frailty even more difficult.
Discussion
Our scoping review highlighted that, up until now, only 9 of the 14 studies were effective in preventing or reducing the frailty using the level of frailty as the intervention target. The effective interventions included exercise, nutrition, cognitive training, geriatric assessment and management and prehabilitation. Our review also revealed that most of these interventions were feasible with adherence rates around 70% for most studies. The exercise interventions ranged in duration, frequency, and type of exercises, but all were effective in reducing the level of frailty in pre-frail or frail individuals. The samples were representative of the average community-dwelling older adult: mean ages were in the seventies and eighties, and half to all participants were women.
Recommendations for future research
Future studies should examine interventions to prevent frailty in non-frail patients as all included studies were focused on reducing frailty among pre-frail or frail participants and this is also the trend for the studies in progress (Supplementary Data Table G, available at Age and Ageing online). Furthermore, interventions were focused on only 1–2 frailty markers and seldom on cognitive and psychological well-being. Cameron et al., [22] showed significant findings despite an intervention adherence rate of only 26–50%, by addressing all identified issues including psychosocial health. Ng et al., [5] showed greater benefits in the groups who received all three intervention components including the cognitive memory training. It is highly likely that individuals with less optimal psychosocial well-being are not participating in exercise and nutrition studies if their psychosocial well-being is not addressed. Furthermore, more intervention studies focusing on older adults should include frailty as an outcome and measure it pre- and post-intervention so that the evidence base for preventing and managing frailty grows.
The quality of the reporting of the study details should be enhanced by including randomisation and allocation concealment, response rates, details of statistical analyses and trial registration number, as well as number and type of chronic conditions/comorbidities as this was not clear for all included studies. To enhance the generalisability of the findings, intervention studies should include older adults with cognitive impairment as several studies had quite ‘high’ levels of cognitive function as cut-off criteria for enrolment in the study. With the ageing of the population and the desire to age in place, it is important that more studies include a cognitive intervention arm as this was only included in one of the studies we identified in the existing literature. Lastly, caregivers should be included in future studies; none of these studies involved caregivers, though they are clearly key partners in interventions and may also themselves benefit from the interventions given the impact of prolonged caregiving on their own health and well-being. Ensuring that caregivers are not overburdened is key to the success of this strategy as noted by our stakeholder group.
The strengths of this scoping review included a comprehensive systematic search of electronic databases and grey literature carried out by librarians. However, the results need to be interpreted with caution. Due to our inclusion criterion that studies needed to have a frailty outcome measure, we have excluded studies that have been focused on frail persons, but did not measure frailty as an intervention outcome; of the over 13,000 abstracts we only identified 14 studies that met the inclusion criteria. Furthermore, the studies were based on six different definitions of frailty, some of which included disability in activities of daily living. As well, the study populations were heterogeneous in their level of baseline frailty.
While the reduction in frailty was statistically significant in nine studies (even though the reductions were small in some studies), currently there is no indication what a clinically meaningful change in frailty is. Several studies showed no impact on activity of daily living (ADL) function or fall rates. In some studies statistical significance was obtained because the intervention group remained stable while the control group deteriorated. Thus, new interventions need to be developed to identify interventions with a larger impact on clinically important outcomes which is in line with the recommendations recently published in the White Book on frailty [6] and as suggested by Fairhall et al. [30], such as measures of participation in life roles. Although these measures are relatively unused in research focused on frailty, they align with the description of ‘social and cognitive frailty’ and our stakeholder feedback to use a broader definition of frailty and to include psychosocial well-being. For future studies it will be important to have larger samples in RCTs and to have sufficient power for subgroup analyses to determine what intervention works best for what level of frailty. We also could not perform a meta-analysis as the interventions were so different in terms of treatment duration, frequency and different combinations of interventions. Further studies should consider utilising the frailty components rather than set definitions. Finally, even though the scoping review allowed for qualitative studies, none were identified, which provides another potential area for future enquiry. In conclusion, most interventions were feasible, safe and reduced the level of frailty in older community-dwelling pre-frail and frail individuals, but more studies are needed to confirm these findings.
This scoping review focused on interventions targeting the level of frailty showed that there were 14 studies of which 9 were shown to significantly reduce the level of frailty in community-dwelling older adults.
More research is needed as the few conducted studies so far have had heterogeneous study populations and future studies should include larger samples and more older adults with cognitive impairment.
No study involved caregivers of frail older adults who may facilitate participation in the intervention study and may benefit from the intervention themselves.
Supplementary data
Supplementary data are available at Age and Ageing online.
Acknowledgements
We would like to thank all older adult and family caregivers, Ms. Keatings, CARP members, Care Watch, Alzheimer Society Canada, VHA Home HealthCare, the Toronto Regional Geriatrics Program, Toronto-Central Community-Care Access Centre, City of Toronto, Ontario Afghan Family seniors Services Association, CIHR Institute of Aging and all healthcare providers who participated in our stakeholder meeting.
Conflicts of interest
None declared.
Funding
This work was supported by Technology Evaluation in the Elderly Network (TVN) knowledge synthesis grant [grant# FRA2015-A-07]. Dr Martine Puts is supported by a Canadian Institutes of Health Research New Investigator Award. The funder had no role in the design of the study.

Comments