


Abstract
The European Union has been criticized for responding to the COVID-19 pandemic in a reactive, rather than prosilient manner. For the EU bloc to be prosilient, it needs to have the right early warning indicators to allow short-term healthcare system preparedness and agile planning of the public health response.
The association of COVID-19 disease burden, as measured by mortality (COVID-19 and all-cause), hospital and ICU occupancy, with incidence rate (IR), total positivity rate (TPR) and adjusted TPR as proposed by Vong and Kakkar, was investigated using Poisson regression analysis. This was carried out using both real-time data and time lags of up to 8 weeks to identify potential for early warning of spikes in disease burden. ECDC weekly figures for these indicators were used, and the analysis was repeated for the subset of data after Week 42 of 2020, when the EU Council introduced minimum COVID-19 testing rates.
TPR and IR were noted to be the most predictive of COVID-19 disease burden whilst adjusted TPR applied on weekly data was not associated. TPR behaved better at predicting all-cause mortality in both analyses. The TPR and IR were both best associated with hospital and ICU occupancy and COVID-19 mortality with a short time lag (2–3 weeks in the case of TPR with hospital occupancy and COVID-19 mortality).
Monitoring TPR can provide a 2–3-week warning of a spike in hospital occupancy and COVID-19 mortality. This time, if well utilized, could help health systems save countless lives by mobilising resources.
Introduction
The COVID-19 pandemic in Europe and the European Union’s response
The first confirmed SARS-CoV-2 infection in Europe was reported in France on the 24 January 2020.1 Up until 1 month later, eight EU member states had registered confirmed cases of COVID-19.2 The number of countries affected increased rapidly thereafter and within 6 weeks, all 27 member states of the European Union had documented cases of COVID-19.3 By mid-March, WHO had declared Europe the epicentre of the pandemic.4
The pandemic had a devastating impact in Europe both in terms of health and socioeconomic repercussions. By early May of 2021, >31 million cases of COVID-19 had been reported in the European Union and the official death toll from COVID-19 had exceeded 700 000.5 Economic activity declined in all affected countries, to varying extents, with shrinkage of the European Union’s GDP reaching 6.1% in 2020 when compared with the previous year.6
The rapid spread of the SARS-CoV-2 virus led to situations where the healthcare systems of several member states were overwhelmed, resulting in insufficient capacity to provide necessary care to surging numbers of severely affected COVID-19 patients and delays in provision of essential care for other conditions.7 The European Union has been criticized for its failure to institute a prompt, co-ordinated response to the pandemic, particularly in the early weeks when requests for support from Italy, the first European country to be brought to its knees by the pandemic, failed to result in swift mobilization of required resources to the worst-affected regions.8 Additionally, the fact that the region experienced successive waves of infection, despite the introduction of a common monitoring strategy and monitoring maps by ECDC as far back as October 2020,9 reflects the reality that crucial lessons were not learned following the first wave.
Europe could have taken a prosilient approach and learnt from past challenges to prepare itself better for future ones, rather than adopting a purely reactive stance throughout the pandemic.
Our question is, if we are seeking to foster a more prosilient European response to the pandemic, what indicators are best placed to help us predict the healthcare resource requirements and plan the public health interventions required to effectively manage the pandemic?
Indicators of COVID-19 disease burden
While it may not accurately reflect the number of active cases in the population, for many infectious diseases, the reported incidence rate (IR) is one of the best and most responsive indicators of disease burden, even if it may underestimate disease transmission.10 This is particularly problematic in case of COVID-19 as IR can vary markedly from true incidence due to a significant proportion of asymptomatic cases (Lavezzo et al., 2020).11
Other ‘traditional’ indicators considered to reflect the epidemic burden are hospital occupancy and ICU occupancy.12 In the case of COVID-19, excess deaths have also been put forward as a particularly useful indicator for the burden of COVID-19, because official COVID-19 death tolls are widely considered to be underestimates of the total fatalities caused by COVID-19.13–15, On the other hand, figures for excess deaths take into account not only the official COVID-19 death toll but also fatalities resulting from delay/postponement in required healthcare, mental health problems caused or exacerbated by the pandemic situation and reductions in mortality due to decreased mobility, decreased transmission of other infectious diseases and frail persons who would otherwise have died from chronic conditions passing away earlier from COVID-19.16 While WHO considers all these deaths as deaths caused by COVID-19,17 this was not applied consistently by all countries. Hence the extent to which official COVID-19 death rates reflect the total deaths caused directly and indirectly by COVID-19 varies widely from country to country.
Proposed ‘early warning’ indicators
Since the start of the pandemic, a number of indicators have been put forward as potential ‘early warning’ indicators for which rising trends quickly pick up a worsening epidemiological situation and sound the alarm for imminent surges in the COVID-19 burden variables discussed above and the accompanying resource requirements in healthcare and other sectors.
While it is in itself also a proxy for COVID-19 disease burden as discussed above, the IR of COVID-19 is also used as an early warning indicator due to the lag observed between disease onset and clinical deterioration requiring hospitalization.18 However, its use as a sole indicator to reflect the pandemic situation has been criticized due to its failure to take into account volume of testing.19
Another such indicator is the test positivity rate or total positivity rate (TPR),20 which is calculated by dividing the number of new positive cases by the number of tests. The TPR has been shown to have a strong correlation to the number of hospitalizations. In a study analysing data from a Spanish health area, TPR was associated with the number of admissions due to COVID-19, with the strongest association being for the scenario representing a 2-day lag between these variables, respectively.21 In an analysis of time-series data from Italy, peaks in TPR generally preceded peaks in COVID-19 hospitalizations by ∼16 days and peaks of ICU admissions by ∼13 days.22 Building on these findings, Gaspari and Fenga have put forward a forecasting tool built on the TPR index that can predict hospital and ICU overload 12 days in advance.23
Various adjustments to the TPR have been proposed, including the inclusion of antigen tests in the denominator,22 testing parameters and the proportional use of different testing protocols24 and an adjustment that takes into account the number of persons vaccinated.22 Vong and Kakkar put forward an adjusted TPR that amends the TPR to reflect the relative increase in cases and the relative increase in tests, and show how it reflects the COVID-19 caseload more appropriately than the TPR.25 Additionally, the geometric means of the reported IR and the TPR have also been proposed as suitable proxies for actual COVID-19 prevalence.10
Based on analysis of COVID-19 monitoring data in Greece, a ‘severity detection rate’ (SDR) predicting the number of ICU admissions that will be required based on caseload and testing volume 12 days prior was shown to have high accuracy (Pearson r = 0.99).26 Some countries have also used COVID-19 hospitalization rates and ICU admission rates as indicators for staged mitigation measures,27 but we will not expand upon this in this paper as for the purposes of an early warning indicator, we argue that acting once hospital or ICU admission have already risen is acting too late.
Methods
Dataset
Data published by ECDC were used to construct a dataset that included variables reflecting the burden of COVID-19 across the European Union (namely weekly hospital occupancy, weekly ICU occupancy, weekly count of COVID-19 deaths and weekly mortality from all causes). The dataset was also populated with variables identified in the literature as potential predictors for COVID-19 burden, namely the TPR, the adjusted TPR and the 14-day IR for COVID-19.
In view of the evidence for the range in lag between the peak for the proposed indicator variables and the peak in the variables reflecting COVID-19 burden (which were taken as the dependent variables in our analysis), additional dependent variables were coded to represent 1–8 weeks of potential lag in correlation between dependent variables and predictors. The dataset included data for each EU member state (wherever available) starting from week 12 of 2020 up to week 15 of 2021. The time period prior to week 12 of 2020 was omitted from the analysis for reasons of poor data coverage in the early weeks of the pandemic.
Selection of potential predictors
Despite the fact that the proposed formula for calculating the adjusted TPR requires daily data and our data were in weekly format (because daily data are not published by ECDC for all the variables required), it was decided to include it regardless and test whether this predictor would retain its utility when calculated using weekly data and additionally whether it would be correlated to any of the burden variables tested. The SDR discussed above was not included as one of the predictors as its calculation requires multiple variables not available from ECDC datasets (such as daily figures for COVID-19 patients in ICU and discharged from ICU).
Analysis
Stata was used to carry out a Poisson regression analysis, where each of the variables reflecting COVID-19 burden were in turn tested against each of the predictors listed above for 0–8 weeks lag scenarios. Two sets of analysis were carried out, the first with the full dataset and the second with a subset of the data from week 42 of 2020 onwards (when ECDC introduced a common monitoring strategy as discussed above, which included a minimum COVID-19 testing rate).
The value for McFadden’s Pseudo-R2 (a measure representing goodness-of-fit) was documented for each analysis together with the number of observations for the specific run of Poisson regression. Confidence intervals were calculated for pseudo-R2 using the method based on large-sample theory put forward by Olkin and Finn.28
Justification of the use of all-cause mortality as a proxy for excess mortality
As discussed above, the death rate officially attributed to COVID-19 significantly underestimates the actual total deaths caused by COVID-19. Excess deaths are considered a better proxy for the true mortality from COVID-19 because, assuming that the background mortality has remained more or less the same as in previous years, excess deaths occurring during the pandemic have mainly been caused by COVID-19.16 Unfortunately, figures for excess mortality over the pandemic period are not consistently available for a sufficient proportion of EU member states to enable the inclusion of excess mortality as a variable in our analyses. For this reason, total mortality was included as an alternative proxy for all-cause mortality caused by COVID-19 for which sufficient data were available. Total mortality is also considered to be an indicator of disease burden in its own right in epidemic/pandemic situations.29 An inherent limitation of using excess morality/total mortality as proxy of deaths caused by the COVID-19 pandemic is that it does not take into account other events that may have contributed to excess mortality during the pandemic period (we do not have visibility of major events affecting excess mortality in Europe during this period, apart from the earthquake that occurred in Croatia on 29 December 2020 which is thought to have claimed the lives of <10 persons).
Results
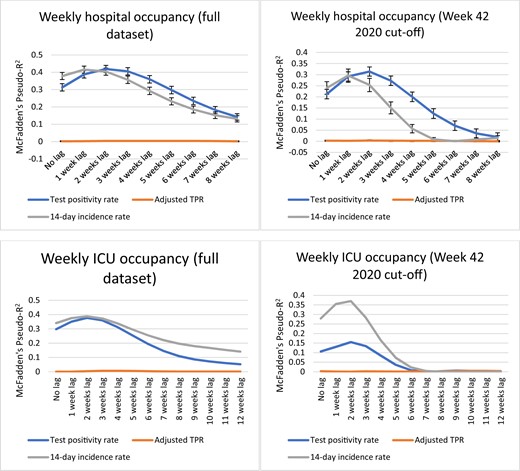
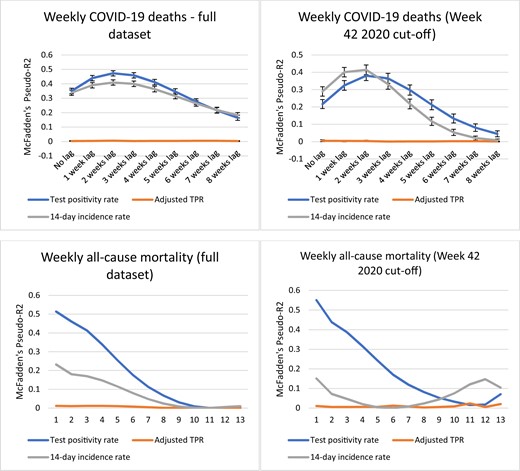
See figures 1 and 2 for graphs plotting the values of pseudo-R2 for the 0–8-week lag scenarios in each analysis. Throughout the analyses, the adjusted TPR had very low values for pseudo-R2 reflecting a lack of correlation and will not be mentioned further in the results section.
Analysis results for weekly hospital occupancy and weekly ICU occupancy
Analysis results for weekly COVID-19 deaths and weekly all-cause mortality
Interpretation of pseudo-R2 values
With respect to the interpretation of pseudo-R2 values resulting from Poisson regression analysis, it should be kept in mind that pseudo-R2 is not a proportion of the explained variance as is the case for values of R2 resulting from ordinary least squares regression models. Pseudo-R2s are not meant to be compared across datasets or interpreted independently, but are useful for the evaluation of multiple models on the same dataset, with the highest value for Pseudo-R2 reflecting which model is a better predictor of the outcome under study.30
Weekly hospital occupancy
For the full dataset, the highest value for pseudo-R2 is very similar for both the TPR and the IR (0.419 vs. 0.415, respectively). For IR, pseudo-R2 peaks at a lag of 1 week while for the TPR pseudo-R2 peaks at a lag of 2 weeks.
In the analysis including only the period after the introduction of ECDC’s weekly monitoring maps the difference is more marked, with the TPR predicting fluctuations in hospital occupancy at 2 weeks (1 week earlier than the IR) and having higher pseudo-R2 for most data points, hence qualifying as the better-fitted model.
Weekly ICU occupancy
For the full dataset, the IR is a better-fitted model overall with generally higher values for pseudo-R2 (peaking at 0.39 vs. a peak of 0.38 for the TPR), thought it should be noted that there is overlap in confidence intervals at the peak of the curves.
In the analysis including only the period after the introduction of ECDC’s weekly monitoring maps the IR predicts weekly ICU occupancy significantly better (peak pseudo-R2 of 0.37 vs. peak pseudo-R2 of 0.16 for TPR).
Weekly COVID-19 deaths
With significantly higher values for pseudo-R2 for most data points, for the analysis on the full dataset weekly COVID-19 deaths are clearly better predicted by the TPR, with the closest correlation occurring at a lag time of 2 weeks. In the analysis including only the period after the introduction of ECDC’s weekly monitoring maps, the pseudo-R2 for the IR at the peak of the graph (2–3 weeks lag) does not lie within the CI for the TPR by a small margin and vice versa (0.38 vs. 0.41, respectively). Hence IR is marginally but significantly better associated with weekly COVID-19 deaths in this analysis. For both analyses, pseudo-R2 values for both TPR and IR peak at 2 weeks lag.
All-cause mortality
In the case of all-cause mortality there is no lag element, both for the analysis on the full dataset and the analysis including only the period after the introduction of ECDC’s weekly monitoring maps. The IR is a substantially inferior predictor to the TPR for both analyses (peak pseudo-R2 of 0.23 vs. 0.51 for the full dataset, peak pseudo-R2 of 0.55 vs. 0.15 for the monitoring maps dataset).
Discussion
Firstly, the adjusted TPR did not hold up well to being tested on weekly instead of daily data and returned very low values for R2 for all of the COVID-19 burden variables it was analysed against for both analyses.
Neither of the remaining predictor variables clearly emerged as a superior indicator across the board, with the indicator that correlates best varying according to the COVID-19 burden variable being analysed. In the case of weekly ICU occupancy, the IR resulted in the better-fitted model for both analyses while in the case of all-cause mortality the TPR emerged clearly as a better predictor in each case. With respect to hospital occupancy the TPR is a better predictor for the analysis including only the period after the introduction of ECDC’s weekly monitoring maps, while despite both indicators having similar peak values for pseudo-R2 in the full analysis, the TPR is considered a preferable indicator in practical terms as it provides an additional week of forewarning, correlating best with a lag of 2 weeks as opposed to a lag of 1 week for the IR. In the case of deaths officially attributed to COVID-19, the TPR results in a better-fitted model for the full analysis while for the analysis including only the period after the introduction of ECDC’s weekly monitoring maps, the IR performs marginally better.
In the analysis including only the period after the introduction of ECDC’s weekly monitoring maps, the IR predicts weekly ICU occupancy significantly better, which is likely linked to the fact that to be admitted to ICU, a patient is almost certainly a confirmed case, due to the fact that severely affected individuals are much likelier to be tested than those mildly affected. The marked decrease in pseudo-R2 values for the TPR for the analysis including only the period after the introduction of ECDC’s weekly monitoring maps (compared with the full analysis) is notable, pointing towards a potential advantage gained from the introduction of a European monitoring framework.
An unexpected result is the lack of lag in the results for all-cause mortality for both analyses. As discussed previously, excess mortality and, by extension, all-cause mortality is a function of several drivers including deaths directly caused by COVID-19 and indirect mortality that results from required healthcare being delayed, postponed or avoided in the context of a pandemic. While for COVID-19 deaths the TPR and the IR correlate most strongly at a lag time of 2 weeks, for all-cause mortality there is no lag. This suggests that deaths indirectly caused by COVID-19-related barriers precede the peak of deaths directly attributed to COVID-19. Such a finding ties in with a number of published charts comparing excess deaths with official COVID-19 death rates where excess deaths are seen to rise before official COVID-19 death rates in several cases, notable examples including Poland, Lithuania, Slovakia and Ecuador.14
If one had to consider the full analysis (which includes the period with no minimum standards for COVID-19 testing) as a pilot for the comparison of countries at a global level, the TPR may be the better indicator for global comparisons of COVID-19 disease burden, assuming that mortality indicators tend to best reflect the burden of COVID-19 disease irrespective of a country’s diagnostic capacity.
Figure 3 summarizes the better-performing predictors for each COVID-19 burden indicator for both of the analyses.
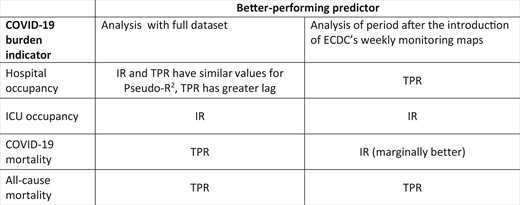
Table summarizing better-performing predictors for both analyses. IR, incidence rate; TPR, test positivity rate
Implications of the results for the European pandemic response
Some countries such as Australia and China have successfully managed the COVID-19 pandemic by implementing strict border controls to prevent reintroduction of the virus in areas where transmission had fallen to low levels.31,32 In the European Union, country interdependence is high, particularly in the case of small states, and hence individual EU member states are less able to effectively shut themselves off from the rest of the world in response to a pandemic. The EU took the decision to restrict border movements during virtual meetings of EU leaders held on the 17 and 26 March 2020,33 by which time, as described above, the SARS-CoV-2 virus had already spread to all member states of the Union. The application of such border restrictions too late and too loosely has been blamed for the rapid spread of the SARS-CoV-2 virus across the European Union.3
Despite the laying out of a EU Global Health Policy by the EU Council in 2010,34 and despite measures taken by the SHARP Joint Action,35 the overall EU health policy response to the pandemic lacked cohesion. This is likely a consequence of the fact that with respect to matters relating to human health overall, the EU only has the competence to ‘support, co-ordinate or supplement actions of the Member States’36 and hence an EU-level health policy framework is absent, or at best, patchy. However, and particularly in view of the fact that safety concerns in public health matters specifically fall under shared policy competence, in the case of pandemic preparedness and response, due to the scale of the efforts required to address such crises, the objective of controlling the pandemic can be better achieved by actions harmonized at an EU level.
We argue that Europe can be prosilient in its handling of the pandemic by having robust, responsive surveillance systems in place and utilizing the data they provide to anticipate; such as by promptly restricting movement into and out of areas experiencing a surge in COVID-19 cases and quickly mobilizing resources to assist the affected area (both healthcare resources and other resources that might be required, such as food). This would help to contain transmission to as localized an area as possible. Such an approach is supported by an analysis of data from 16 European countries which showed a strong correlation between the number of fatalities from COVID-19 (both total and per million inhabitants) and the days elapsed between the first reported case and the institution of lockdown measures (R2 of 0.722 and 0.590, respectively).37 Furthermore, simulations of a network mobility model for Europe showed that air travel can predict the diffusion pattern of the pandemic, with unconstrained mobility resulting in accelerated spread.3
Guided by this rationale, our analysis aimed to identify indicators that can be used to manage the pandemic in a prosilient manner by providing prior warning of an upcoming rise in COVID-19 disease burden, with the TPR and IR emerging as useful predictors. Such indicators can be used at both EU and country level to guide the escalation and de-escalation of COVID-19 mitigation measures, for the purposes of short-term healthcare system preparedness (e.g. forecasting of hospital beds, ICU beds and number of ventilators required in following weeks) and for agile planning of the public health response (e.g. mobilizing human resources to increase the number of case managers and contact tracers available to deal with cases).
One hopes that lessons learned shall also serve as a basis for the handling of future pandemics.
Conflicts of interest: None declared.
Additional Content
A video to accompany this paper is available at https://youtube.com/playlist?list=PLv5eq4ZCoNWubJurAJ-7Ht33cjNshLw7R.
References
ECDC. Timeline of ECDC’s response to COVID-19,
Our World in Data. Coronavirus (COVID-19) Cases,
World Health Organization. WHO Director-General’s opening remarks at the media briefing on COVID-19,
Our World in Data. Cumulative confirmed COVID-19 deaths,
International Monetary Fund. World Economic Outlook Database,
Council of the European Union. Council Recommendation on a Coordinated Approach to the Restriction of Free Movement in Response to the COVID-19 Pandemic (Issue October),
Tracking covid-19 excess deaths across countries. The Economist,
Institute of Health Metrics.
World Health Organization. Opening remarks—Technical Advisory Group meeting on COVID-19 mortality assessment,
ECDC. Questions and answers on COVID-19: medical information,
UCLA Institute for Digital Research and Education. What are pseudo-Rsquareds?
Council of the European Union. Council conclusions on the EU role in Global Health, Vol. 32.

Comments